
When a substance is injected directly into living tissue, the first question is not always whether it works.
Before efficacy comes control.
A local ablative approach depends on a simple but fundamental property: the reaction must have a defined boundary. If an active agent continues to move and react for hours after administration, the final treated volume becomes difficult to predict. If the agent is rapidly consumed upon contact, the treatment domain may be determined primarily by the amount delivered.
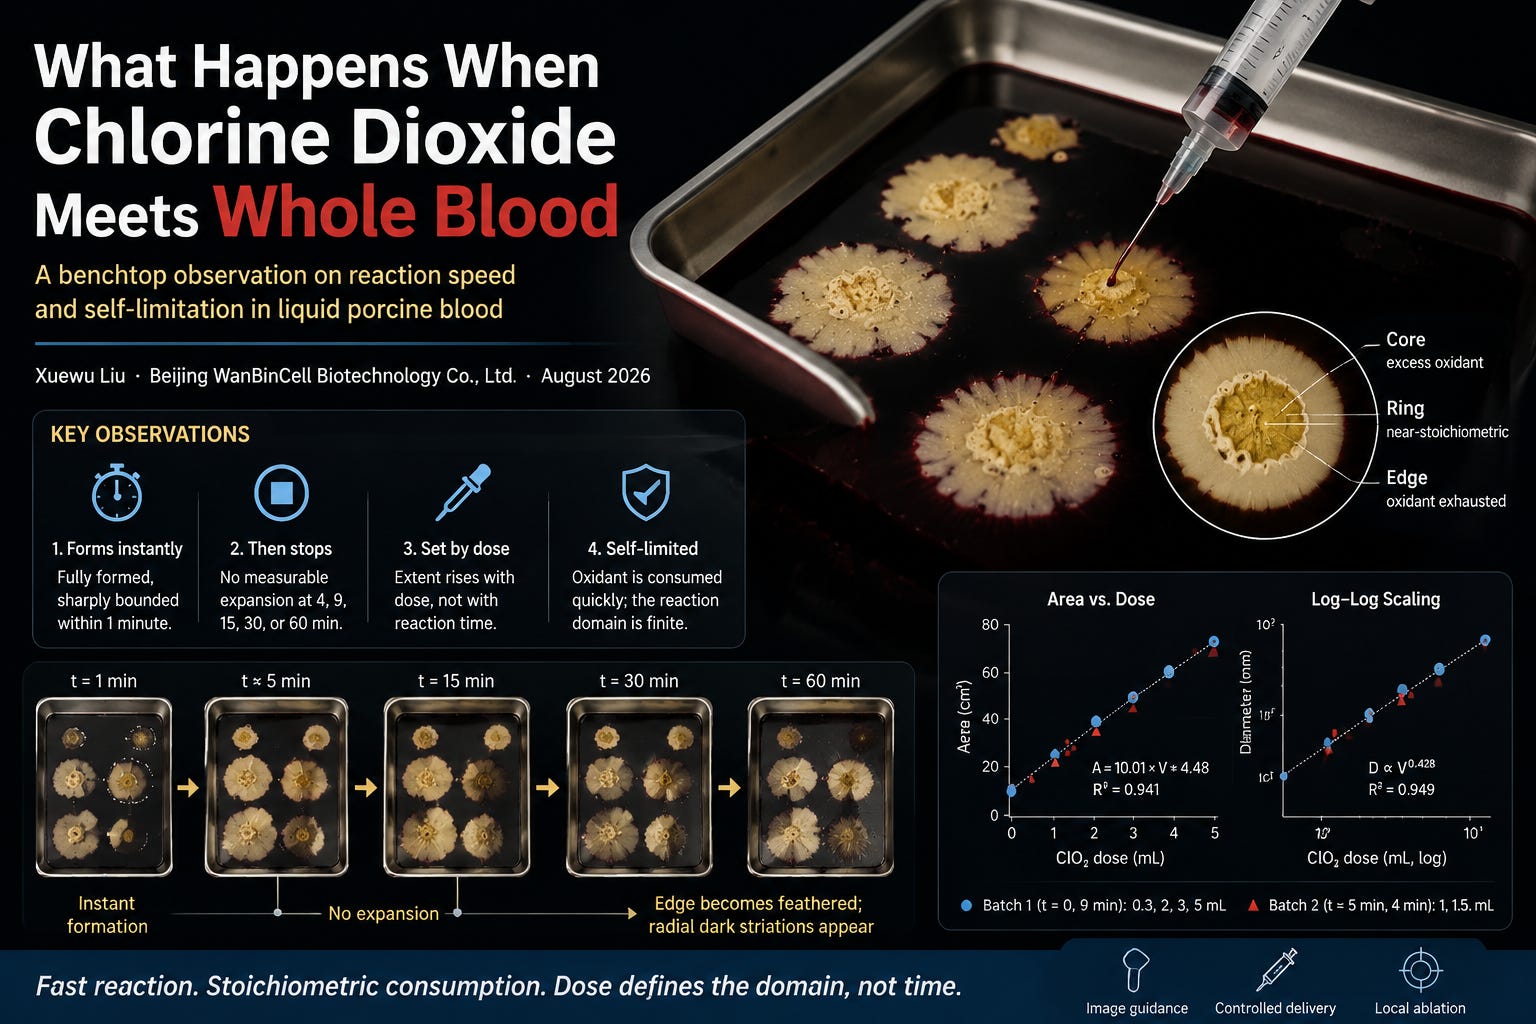
This report describes a simple benchtop observation designed to examine that question for chlorine dioxide (ClO₂).
The experiment does not study tumors, does not measure cell death, and does not evaluate therapeutic efficacy. Liquid porcine blood was used only as a visually responsive chemical environment, where oxidation-related colour change allows direct observation of reaction location and time course.
The purpose was narrow:
How fast does the reaction appear?
Does the visible reaction zone continue expanding after formation?
Is the final extent more closely related to dose or to elapsed time?
The answer from this simple model was striking: the visible reaction boundary formed within minutes and remained stable during subsequent observation.
This observation does not establish clinical outcomes. It provides only a physical-chemical observation about reaction behaviour in a blood-based model.
Understanding these basic properties is an important step before more complex biological models are considered.
For any ablative agent injected directly into tissue, one question comes before efficacy: does it stop?
If an agent persists locally and keeps advancing into surrounding tissue over hours, the treated volume cannot be predicted from the dose administered. If instead it is consumed on contact, the treated volume is set by how much you inject — and becomes something you can plan for.
This is a simple benchtop observation addressing that question for chlorine dioxide (ClO₂). It is not a therapeutic study, and it makes no claim about tumours, tissue, or cell killing. It asks one narrow question, in the crudest possible system, and reports what happened.
Whole blood is one of the most reducing-equivalent-dense media in the body — haemoglobin, glutathione, albumin thiols, ascorbate. It is also, conveniently, its own indicator. When haem iron is oxidised and the porphyrin ring is degraded, the colour changes dramatically and irreversibly.
That makes liquid blood a self-reporting exhaustion assay. Wherever the oxidant reacted, the colour changed. Wherever it did not, the blood stayed dark red-black. The boundary between the two is visible to the naked eye, with no stain, no instrument, and no processing.
Medium. 500 g of refrigerated liquid (unclotted) porcine blood, in a stainless steel tray, left undisturbed with a level surface.
Reagent. Stabilised chlorine dioxide solution, 20 000 ppm (2 % w/v, ≈ 20 mg ClO₂ per mL).
Application. Applied to the blood surface by syringe at separate points, far enough apart that the reaction zones never touched. Batch 1 (t = 0): 0.3, 2, 3 and 5 mL. Batch 2 (t ≈ 5 min): 1 and 1.5 mL, onto clear areas of the same tray.
Observation. Photographed at 1, 5, 15, 30 and 60 minutes. Maximum diameter of each discoloured zone measured with digital callipers. At the time of measurement, Batch 1 zones had been reacting for 9 minutes and Batch 2 zones for 4 minutes.
Only diameter and area were measured. Depth was not measured.
Within one minute of application, every point had produced a fully formed, sharply bounded pale yellow-white zone against the dark red-black of the unreacted blood. There was no diffuse gradient between the two — the edge was crisp.
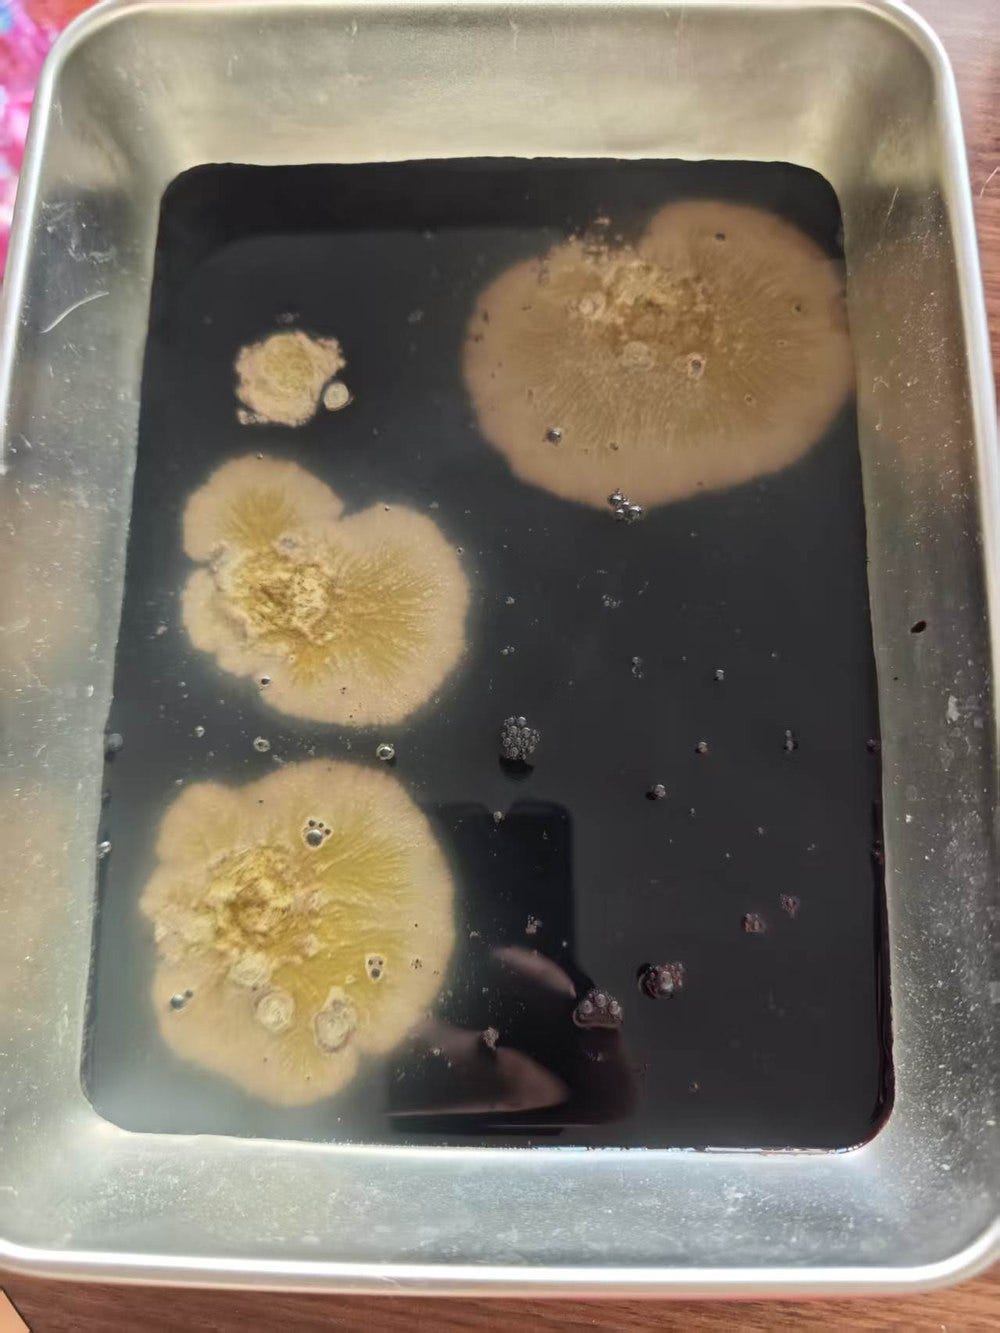
Figure 1. t = 1 min. Batch 1 (0.3, 2, 3 and 5 mL). Sharply bounded discoloured zones are already fully formed.
Each zone also showed a stable internal structure: a granular yellow-green core, a cream-white mid-ring, and a sharp outer edge. This layering can be read as an iso-dose map — excess oxidant at the centre where porphyrin degradation went furthest, near-stoichiometric conditions in the ring, and exhausted oxidant at the edge.
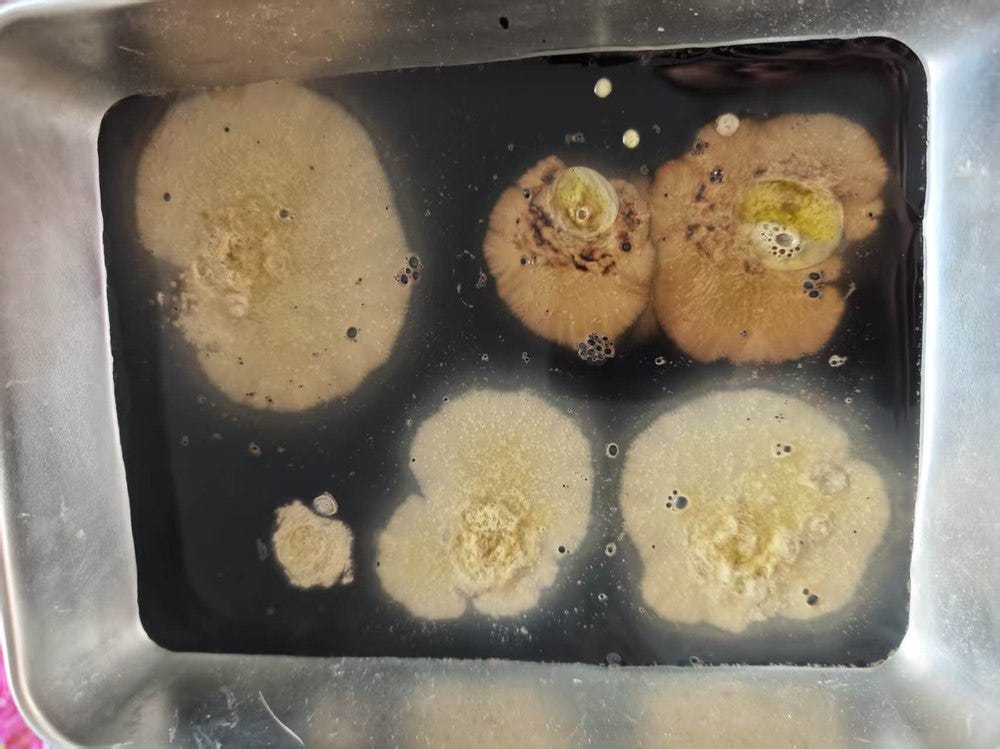
Figure 2. t ≈ 5 min, after adding 1 mL and 1.5 mL (upper right). The new points formed just as fast, and the Batch 1 boundaries had not moved.
At 15 and 30 minutes, the boundary positions, shapes and internal colour layering were indistinguishable from the one-minute images. Surface foam increased slightly; the boundaries did not move.
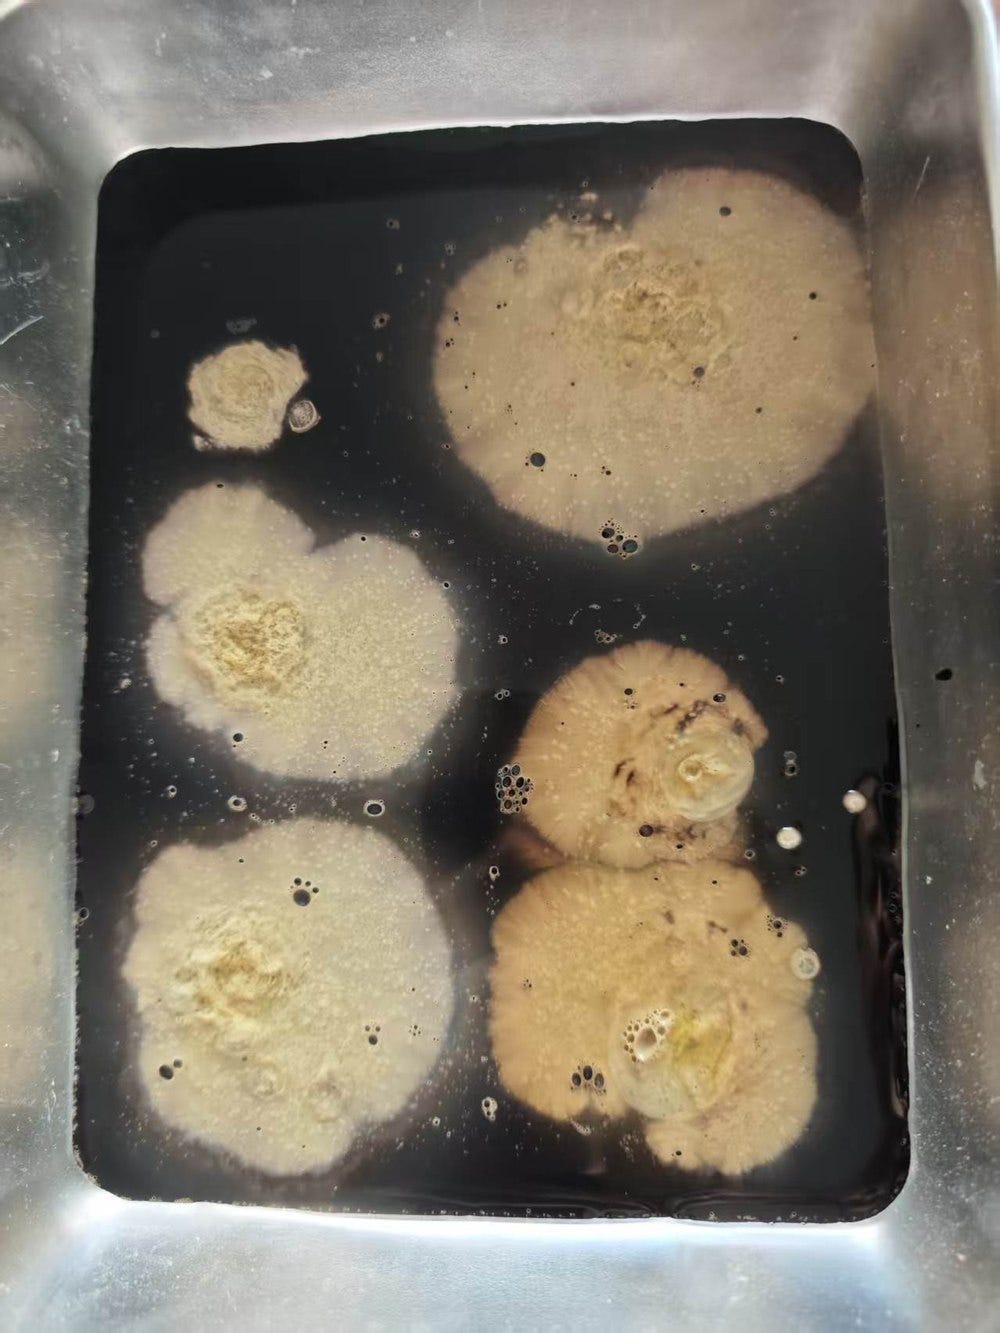
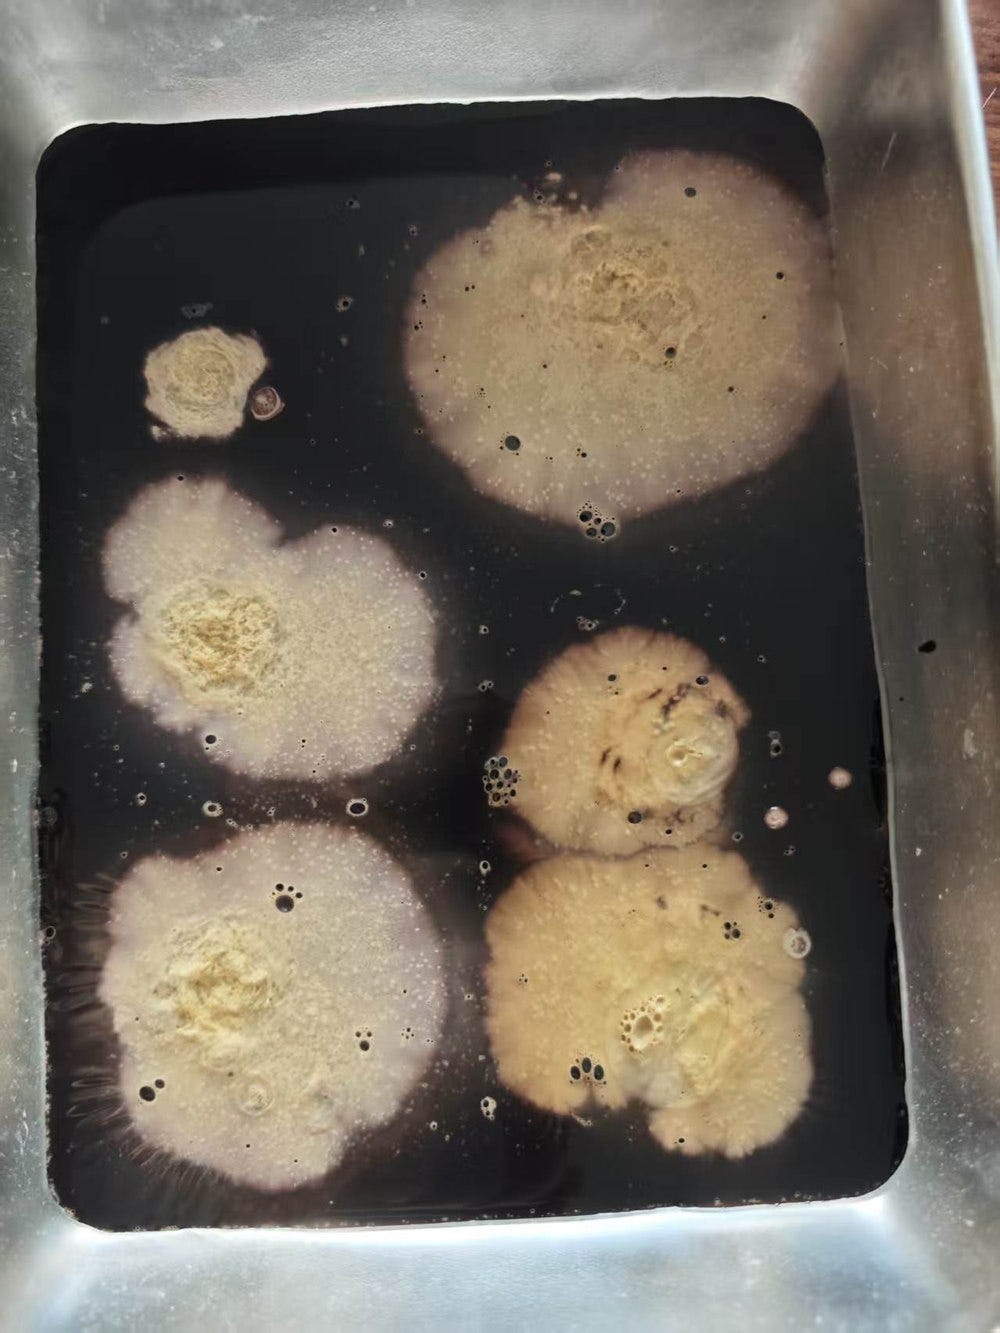
Figure 3 (left) t = 15 min; Figure 4 (right) t = 30 min. No expansion relative to Figures 1–2.
At 60 minutes the extent of the discoloured zones was still not measurably larger — but two things had changed in appearance. The edges had gone from smoothly lobed to feathery, and dark striations had appeared in the surrounding blood, radiating outward from each zone. Neither was present at 30 minutes.
I am recording this rather than explaining it. It could be oxidation products diffusing or convecting outward; it could be red cell sedimentation; photographs cannot distinguish these. A tray of blood left to stand for an hour with no ClO₂ added would settle the question, and I have not run that control.
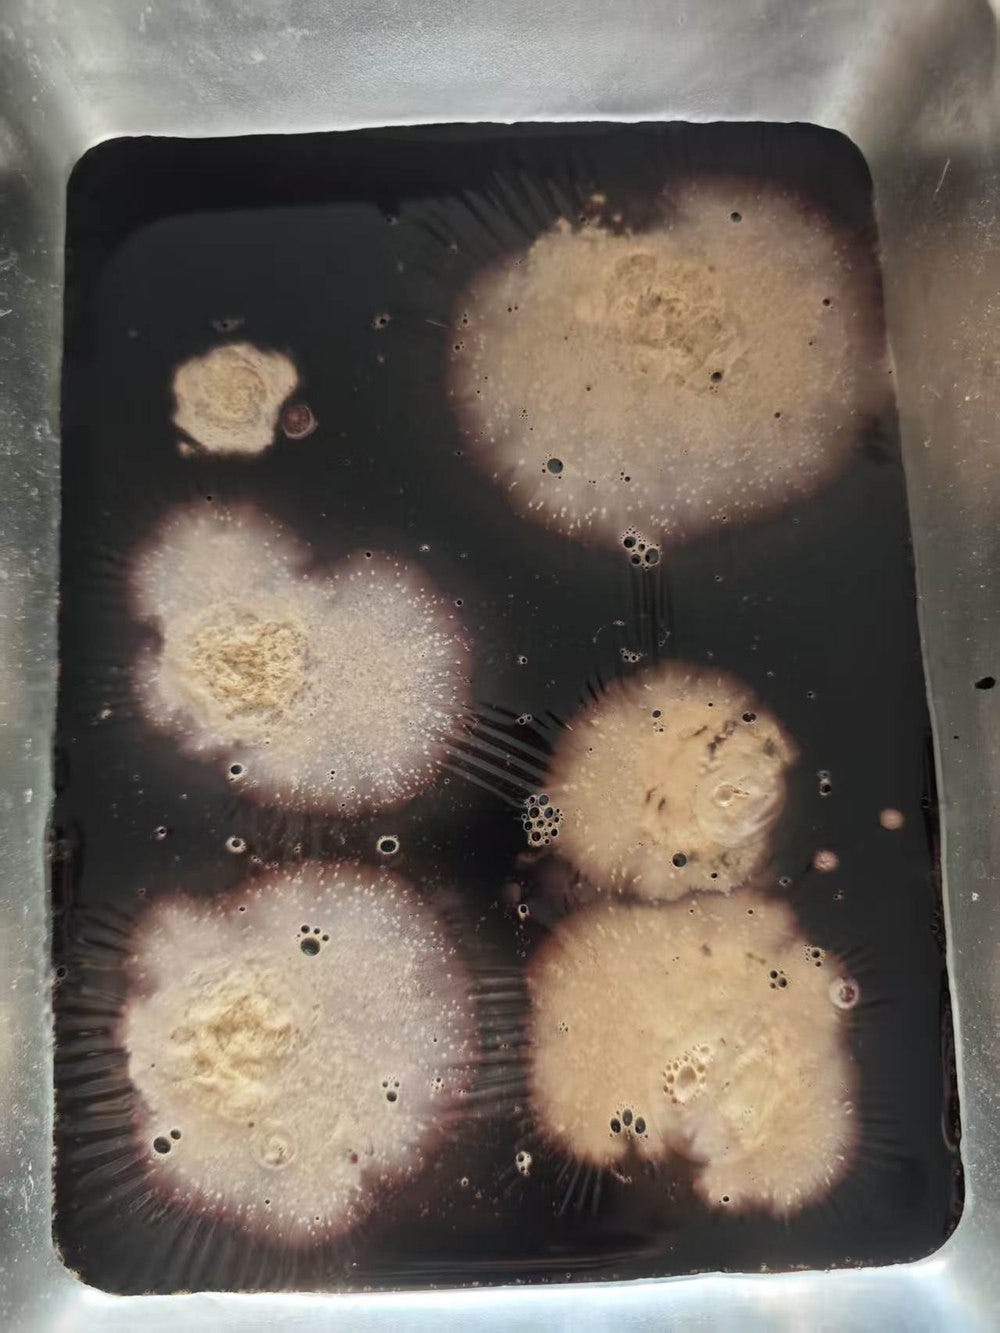
Figure 5. t = 60 min. Extent unchanged from Figure 4; radial dark striations and feathered edges have appeared.
Comments
Nothing yet. Say the first thing.
Sign in to join the conversation.