
Cover Photo - Jupiter’s Moons in a Small Telescope
Welcome to Issue #51 of The Classroom Astronomer!
Sky Lessons - Observing Keplerian Laws in Action, Part 1
First Post of Exploration of the Universe with Big Data - What Data Are We Seeing?
In The Galactic Times #103
In this Issue of The Classroom Astronomer we’ll see the first of two articles in the Sky Lessons column you can use when school resumes, finding examples of Kepler’s Laws you can measure. We will be using Jupiter and its Moons for one. No telescope? No problem, we’ll point you to some other sources. With Jupiter being in its best period of visibility this year, this is the perfect time to try this at home or at school!
The first post on the Exploration of the Universe with Big Data postings is here (and in The Galactic Times) and freely accessible. It is the stage setter, the underpinnings of astronomical data. In this article we assume nothing, we start with the ultimate foundational basics, the three basic observations we can make about star light, and build up from there. In the next posting, in mid-January, yours truly will present the objects he is going to be using as his ‘guinea pigs’ to explore in the Big Data sets. Then we will begin the explorations in datasets in earnest, but always keeping in mind the basics.
Enjoy!
Dr. Lawrence Krumenaker, Publisher
Email: newsletter@classroomastronomer.com
Website: Classroomastronomer.com
In ancient days there were three empirical observations that everybody could agree on: the sky appeared to rotate around us as if we were inside a rotating sphere, two objects slowly changed their positions in the sky on a daily basis—apparently shifting their locations in front of the stars in the inside of the aforementioned sphere—the Sun and Moon; and there were strange moving lights in the sky—stars that wandered, the planetes asters—at variable speeds, with occasional reversals of direction. Science is observational and empirical, but often the obvious explanations, such as the celestial sphere around us, are deceptive, and wrong. All those moving objects were explained by there being even more rotating spheres inside the biggest sphere, containing stars. To make these Ptolemaic (named after the ancient Greek scientist who perfected the earth-centered system) spheres inside or attached in some way to those planets were even more spheres to accommodate the changing speeds and reversal of motions, for some objects anyway.
One of the flaws of that system, a natural proclivity of humans, is that everything up there was ‘perfect’ (except down here on Earth) and as the celestial objects seemed to go around us, everything up there had to be on perfect circular (or spherical) pathways or spheres. It is that proclivity that caused thousands of years of wrong knowledge and explanations of what we saw in the sky. Making (such) assumptions is all too frequently the cause of error and not knowing the truth.
That slowly began to change in the early 1600s. Historically we teach that that moment began a bit earlier, with the Copernican Theory, with Polish cleric-astronomer Copernicus ‘pretending’ that the Sun was in the center of the Universe and not Earth. Why? Because it made the mathematics of predicting the places of planets in the sky easier—and we all like math to be easier, right? By pretending it was that way, Copernicus got away with a heretical idea and not put in mortal danger by the super-conservative Church. The problem—his Theory did not make predictions of planetary locations in the sky any more accurate than the old Earth-centered Universe.
The Moment actually began with Johannes Kepler, a German mathematician with an astronomical bent who had one thing others did not have—a massive amount of truly accurate measured sky positions of planetary positions among the stars. The Danish astronomer Tycho Brahe, now relocated to Prague in today’s Czech Republic, had the most precisely engineered pre-telescopic era tools. His positional measures were accurate to often the limit of vision in naked eye astronomy, not in degrees but in fractions of them, called minutes of arc, 60 of them in one degree. In general, 2 minutes of arc (written as 2’) is the normal resolution of human eyesight, the closest two stars could be seen as two stars and not a merged object. In some cases, Tycho got even better resolutions than that.
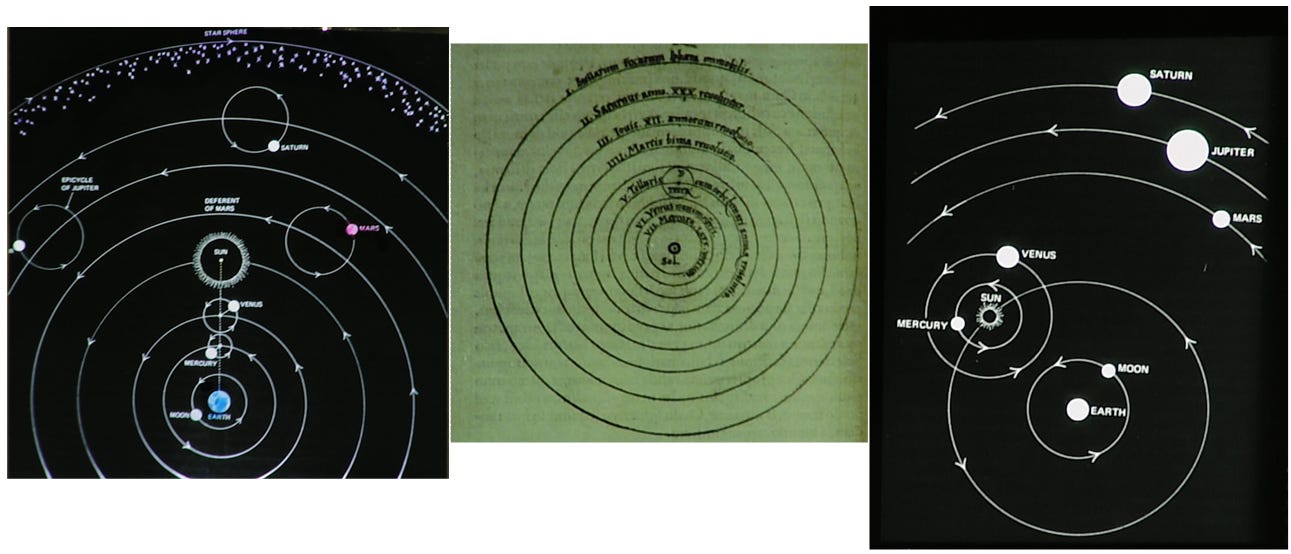
Tycho did not believe in the Copernican Theory but he also knew that the Earth-centered system wasn’t working well either for getting the exact future positions of the planetes. Tycho had his own hypothesis that he wanted to prove was the truth, a hybrid with the Earth still in the center but with some planets orbiting it, some the Sun, and some orbiting around both. He invited Kepler, well reputed in his mathematical abilities and planetary interests, to come to Prague and help him prove his hypothesis correct.
But it wasn’t until after Tycho died, and Kepler got the full repository of data away from Kepler’s family, that Kepler earnestly began the work. And that is where the mathematical headaches began. No matter how much Kepler tried he couldn’t get ALL the Tychonic observations to come out exactly where theory said they should be. Most did, but a few did not. Some might have just put the differences down to mistaken observational errors and junked the ‘bad’ observations, but Kepler didn’t buy that. They were all accurate or they all weren’t.
The one idea that seemed to work was radical. The pathways of the planets in the universe were very slight ellipses, not perfect circles. With the exception of Mars, the various ‘orbits’ were close enough circles to work out. (Apparently, not enough Mercury observations were made to detect the elliptical nature of its orbit, as considerable as Mars). Furthermore, the Sun wasn’t in the exact center of the ellipse either. It was slightly offset. The math of ellipses was well known. The use of them made those errant observations work out. The universe wasn’t perfect.
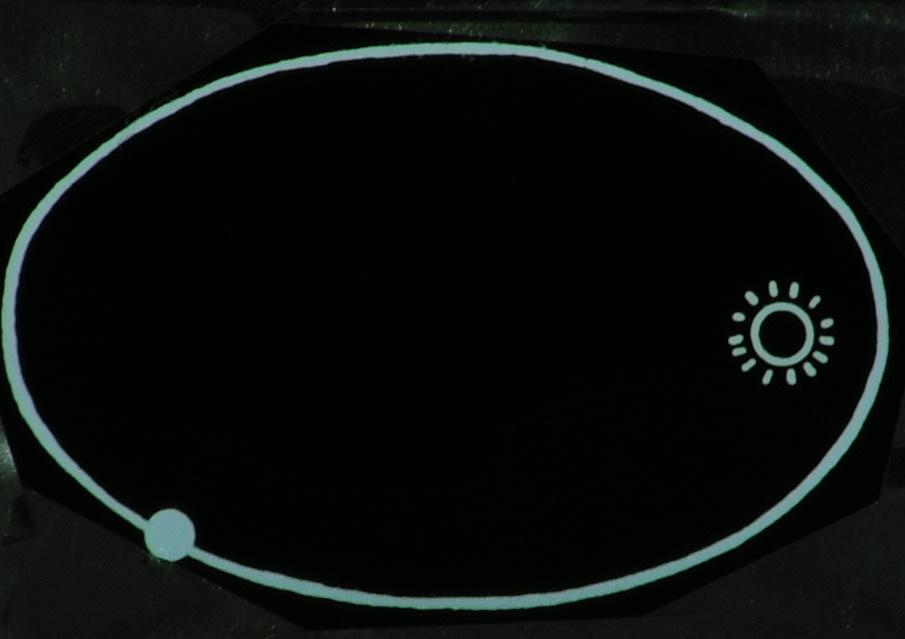
Over years Kepler developed two other Laws of Planetary Motion besides the First Law — elliptical orbit shapes described above. He came perilously close to discovering the mathematical laws of Gravity that Isaac Newton would derive in another century. And all of these came about because of precise observations and the will to not take the easy way out of rejecting those that ‘didn’t fit right.’
Kepler’s Third Law
Kepler made an amazing discovery, that the orbital periods of each world around the Sun, was positively proportional to its average distance. But it wasn’t a linear proportion…..unless you squared the orbital period and cubed the average distance, and scaled them to Earth’s parameters being equal to 1. Sidereal orbital periods were determined by measuring the time for a planet to completely orbit our sky and then subtracting the Earth’s orbital motion and how it affects our view of the planet as they BOTH orbit the Sun. One Earth—Sun average distance (the astronomical unit, or AU) and one (sidereal) year, measured against star positions. Kepler didn’t know the actual distance of the Earth to the Sun, that would not be determined for more than another century, so he couldn’t find actual distances to the planets. But Kepler was the first person ever to know the exact proportions and scale of the Solar System.
The simple form of the Law in mathematical terms is "P^2 = k*A^3”; period P in Earth years squared equals a constant k times the average distance A, cubed, in AU. If you use any other units, k does not equal 1 but is still a determinable constant.

It takes far too long to replicate from observation Kepler’s work using the planets. But he could have —if he had had a telescope — a proof of Kepler’s Third Law by observing moons around the planets, back then the only planet known with moons was Jupiter. This is something WE can do today, and with other planets’ moons as well. The units and the constant k will be different but the proportionality would still be still the same.
What we need is to observe the four bright moons of Jupiter discovered by Galileo, during the same years Kepler worked on the problem. The two scientists actually corresponded but it is uncertain whether Kepler ever got a telescope to see for himself.
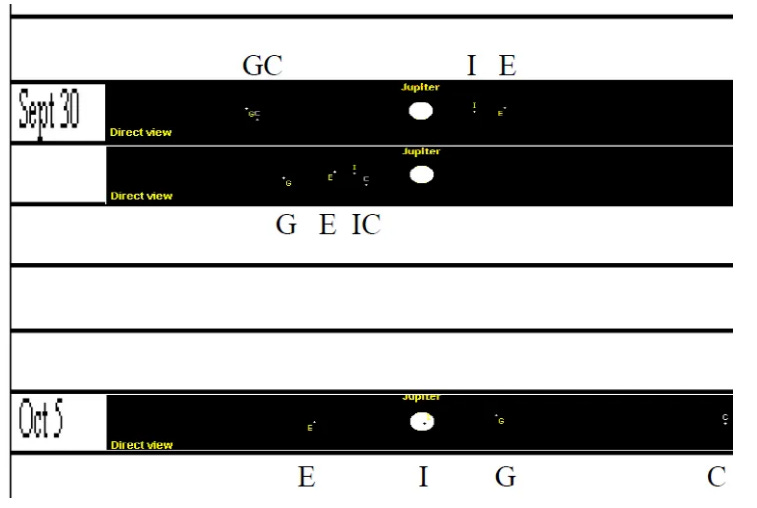
The simple thing to do here is to observe the four Jovian moons over a period of a month. With Jupiter reaching prime observing because of its January 10th opposition position, 180-degrees from the Sun, rising as the latter sets and being up all night, and closest to the Earth at this time, this is the perfect time to try this experiment. These can be done in binoculars, a small telescope such as the refractors often sold in department stores or camera shops, or a more expensive larger scope but this last is not necessary. With a good telephoto lens and a steady tripod, one can photograph them with a camera (see the Cover Photo). One can also use a number of computer programs to recreate what you would see at any future time period if you had (but in reality, don’t) a telescope.
One such can be found at the magazine Sky and Telescope’s website, at https://skyandtelescope.org/wp-content/plugins/observing-tools/jupiter_moons/jupiter.html
Another one is at https://theskylive.com/galilean-moons .
Both save you two problems that make it more challenging: (1) You don’t get cloudy nights so it isn’t quite as interesting as real observations. (2) The Moons are identified by the first letters of their full names, whereas in the real observations you have to figure that out while measuring the real moon’s orbital periods (which range from around 2 days to just over two weeks). Obviously our units of P will be days, not years.
The above would help determine P, what about A? Here we use the diameter of Jupiter as our A = 1. How many Jupiter diameters (as measured with the zero point being the center of Jupiter’s disk) is each moon on each date? You can draw the curves between the images of each moon on each date and get a twisty spaghetti diagram but that will help clarify which ‘dot’ is which moon as the Moon’s orbit Jupiter from side to side, equal max distances, which you need to determine A.
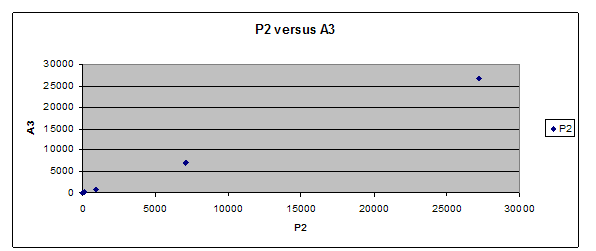
Then graph the results and show that Kepler’s Third Law (sometimes called the Law of Harmonics or the Harmonics Law) works for other systems, not just Sun and planets. It is a linearly proportioned relationship, even here.
In theory, you COULD use just the outer moons and, if sharp-eyed, see those two with the naked eye, blocking out the bright image of Jupiter with a roof-edge, for example, but it is extremely difficult. You could also do these observations with Saturn’s moons, but that would need a larger telescope since only one of Saturn’s moons is as bright as a Jovian moon. If you are doing this exercise without real observing, both of the above websites have Saturnian versions you can use, substituting Saturn’s ball diameter for Jupiter’s.
Look up at the night sky. You’ll see hundreds of points of light. How do we tell one from another? How do we get any information about these points of light, as they really are?
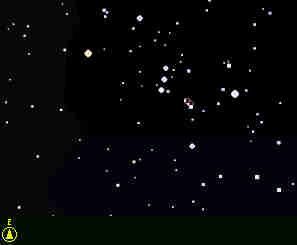
It is an understated fact of astronomy; when we look at a star (and especially with our eyes alone), we see just three pieces of information: its brightness, its color (sometimes), and its location. Everything we know about the universe comes from these three bits of information. All we add to that are technologies, and observations over time.
And that really doesn’t change with modern technologies and space observatories. They all measure these three quantities of light, just better than the eye does alone. That is the basis for determining the properties of stars, and all other objects in the sky that we can detect.
Let’s take a brief look at these three items. They will become most important when we dive into Big Data.
Brightness
In earlier eras, the brightness of a star was considered a constant. There are only a few stars that actually vary in brightness such that they should have been noticed millennia ago. And a few were. But these were inconvenient facts and often quietly ignored.
Brightness is measured in magnitudes. This was a system created by the ancient Greek observer Hipparchus. It is a bit confusing to the beginning astronomer today. The brightest stars were considered ‘first magnitude’. Each magnitude fainter level is actually a factor of ~2.5 times in luminosity, due to how well the retina of the human eye responds to the stimulation of photon s of light from the stars. Five magnitudes difference in brightness is a factor of exactly 100 times. There are actually very few first magnitude stars, some of the brightest are actually of zeroth magnitude, and the brightest are recorded with negative values! Thus the confusion—the brighter the star, the smaller the numerical value of magnitude! The fainter, the larger the number. Faintest being magnitude 6, for the naked eye. It may appear as if brighter stars are larger, and they are often charted this way symbolically, but visual star size is caused by optics in the eye, not in reality.
What is more interesting is measuring the brightness over time. We then find that the constant stars…aren‘t. The way the stars vary turn out to be related to either physical changes inside the star or because some other star (or planet or dust clouds or other objects) eclipse all or part of the star we see. Furthermore, the brightness we SEE with our eyes is a bit of an aggregate. Our eyes see all visible colors of the spectrum at once, from red to blue. Astronomers use a value called the V magnitude that closely matches this.
Some things star brightness doesn’t tell us. They don’t tell us how big the star is, not directly, nor how far they are. At one time it was believed that all stars were all the same and that star brightness was a measure of how far away they were. That is only (somewhat) true for stars that are truly identical, of the same type. But in general a bright star isn’t necessarily a close one to us.
Colors
Which brings us to the color parameter. Our eyes look at the stars and most of them appear just…white. White color means all colors are merged together and none predominate. But the brighter stars to the naked eye (magnitudes +1 to -1, mostly—there are more for the sharper eyed) do show some color. This is because the strength (number of photons) of each color frequency range are now strong enough to trigger a reaction in the retina’s cells. But it also is because the light coming from each star is not even in all colors. This is due to the temperature of the stars. All light wavelengths are not produced equally. For cooler stars, you have the peak color intensity near the red wavelengths. For very hot stars (relatively speaking!) you have the peak near blue. Stars like the Sun peak in yellow. Thus the other colors are produced in the star’s light to lesser amounts,. You can have peaks not even in the visible light part of the spectrum we can see! But the eye merges them all but allows the most intense color to dominate the merged light rays. So some of the stars appear red, or blue, or some other color, to the unaided eye. More of them have this peak visible when you observe the light in a concentrated form, in a telescope.
So the color of the star isn’t just prettiness. It gives us a measure of the temperature of a star.
However, color is somewhat subjective. One man’s red is another man’s orange. So scientifically, star colors are measured by observing the stellar brightness in small ranges of color. A blue band common is labeled the B magnitude, The difference between them (B - V) is a measure of the blue or redness of the star. And there are many other ‘colors’ measure this way, into even the ultraviolet and infrared we can’t see with our own eyes. Usually this is done with photocells, not eyes.
What happens if we don’t look at a star’s combined light? What if we send the light through a prism or a diffraction grating? The light is spread out and we can usually see the range in intensities of the colors, from zero when it reaches the wavelengths our eyes can not react to, the above mentioned ultraviolet or infrared edges near violet and red, and see to some degree where the peak intensity is, in one color. That spreading gives us something else to observe and measure, the spectrum of the star. It is more than just intensity of colors; there are colors missing, or colors more intense and narrow than the rest of the spectrum. These are signatures of gases in the star’s atmosphere or nearby to it, of elements and molecules inside the star, or in its immediate neighborhood, and a better way to estimate the temperature of the star by which elements are visible and which are not.
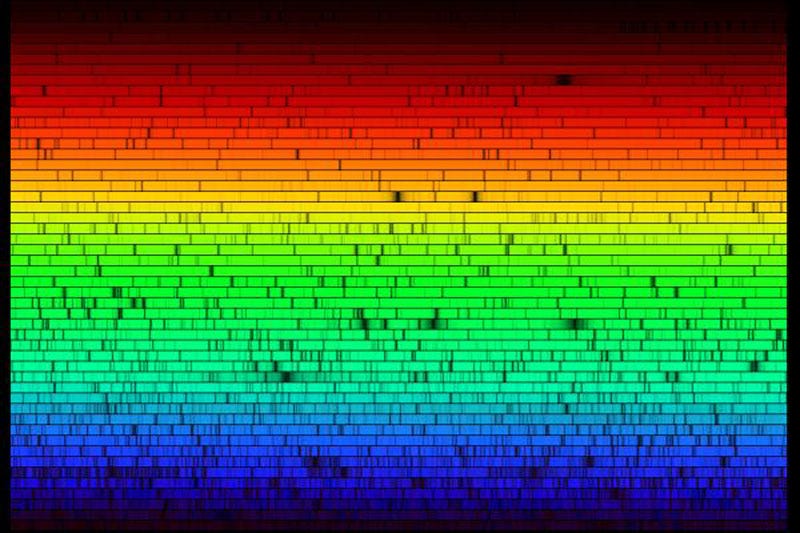
These spectra are coded into alphabetically labels, O (blue hottest stars), B, A, F, G, K, M (reddest, coolest), and more that are newer than this hodgepodge of the alphabet. We can refine those color bands as magnitudes and subtract them from each other to get more precise color measures. U-B for very blue stars, using ultraviolet light that sensors can see but we can’t, for example
Location 1
Finally, there are all sorts of location nomenclatures. The earliest were the constellations. The bright star at the nose of a bear. This other star is the shoulder of a giant. Unfortunately, one man’s bear IS another culture’s giant. Constellations are sky patterns of stars but they are not real nor identical across cultures. It was only in the late 1800s, early 1900s that the constellations were standardized, but as areas, not as stick figure or dot-to-dot patterns. They are based on primarily ancient Greek myths for much of the sky, and modern creations (modern being 1700s and later) based on newer stories and technologies (the Telescope, the Southern Cross).
Many naked eye stars have individual names — Polaris — but that only works so far. Nowadays we have more convoluted star labels, often involving various and multiple systems besides regular names—Alpha Orionis, 59 Ursa Majoris, AD Leonis, and a host of those that use coordinates scrunched together as names!
Speaking of coordinates, for the greater universe, two location systems predominate. One is the Equatorial system, or the right ascension-declination system. A celestial analog of the Earth’s latitude and longitude system of coordinates. Every star is uniquely at a location with these two coordinates; right ascension is in units of time, from an arbitrary point in the sky, a measure of how long the Earth had to turn to have that star or object in the same general direction as the imaginary point. Declination was celestial latitude, nothing more. But we can measure very very precisely this pair of numbers, mostly by using degrees and smaller units within degrees—minutes and seconds of arc. In many modern uses these are decimalized.
The other system is similar but uses different starting points and forward directions. This is the galactic coordinate system. The starting point is a feature in the Milky Way standing in place of the Galactic Center; we measure north and southwards from the visible central plane of the Milky Way for Galactic Latitude (b). It is at a very inclined angle to the equatorial system. Galactic longitude (l) is measured from 0 to 360 degrees eastward.
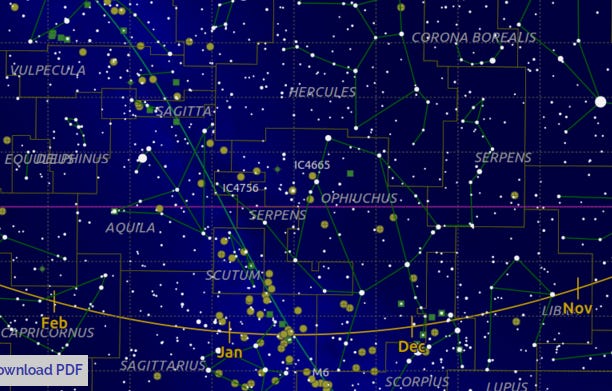
And thus the locations of many are now in the form of 023456.88 +103592.999 . Prosaic, but accurate.
But like stellar brightness, if we measure the positions of the stars over time we find that there are motions detectable. The stars move. We now know that stars move for several reasons. They have their own stellar motions caused by their scattering from their formation spots over time, or other stars’ gravitational influences. They get carried along with the galaxy’s rotation. The galaxy itself moves in relation to other galaxies and along with a general expansion motion in the universe. They motions are detected by changes in positions (proper motion) across the sky, and radial velocity, motions towards or away from us, usually detected by shifting of those spectral dark or bright lines mentioned in the previous section. The addition of the two is its total motion. Ultimately these get converted into speeds. But we can’t do much with that until we get into the three dimensions.
Location 2
All these mentioned above are two dimensional, as if measuring on the inside of that old universe-as-a-sphere around us. The third dimension, distance, isn’t obvious. The earliest method (and to a degree still the main method today) to determine distance was parallax, the apparent shift of a star’s position due to our observing the star from opposite sides of our orbit. Those shifts are very small, the largest belonging to the nearest star, named Alpha Centauri, and it is only about the size of dime seen from 10 miles away. High school geometry translates these tiny angles to one of two distance measures. One is light years, which is not a unit of time but based on the distance light travels in one year. The other is the parsec, an artificial, Earth-biased method of saying how far a star would be if based on an angle of parallax of 1 arc-second being located at 3.26 light years.
Astronomically this method has limits. Telescopes on Earth have limits to how small they can see and measure. But probes like Gaia can see much tinier shifts and can catalog much more stars at greater distances.
So we get to learn more information about those points of light by using technologies and observing over time, far more than we can get from just looking up at the stars with just our eyes, on a single night.
As we progress through these datasets remember that these are all based on those three visible parameters of star light, just more precisely and more in-depth. And from that we learn more about the stars, our galaxy, and our universe.
- - - - - - - - -
If you are interested in this Exploration, you will need to subscribe as a PAID, or more nicely, a PREMIUM subscriber. Because of the holidays, I am extending the December Discounted rate until Tuesday January 6th. It is $30/year, or $5/month until then, and $40/$7.50 in value after that evening, US Central Time. Get in while it is less expensive!
I want to thank those persons who have signed up as Paid Subscribers to join me!
In the next issue of both The Galactic Times and The Classroom Astronomer, I will start talking about some of the objects I will looking at to test the datasets. Then we will begin the Exploration.
Dr. Larry Krumenaker, Publisher
The Classroom Astronomer Newsletter is a reader-supported publication. To receive new posts, subscribe and get the issue in your email inbox, rather than waiting a few more days for it to be posted on the website. To participate in the Exploration of the Universe with Big Data project, become a paid, Premium subscriber.
Cover Photo — Domes Destroyed
Welcome to The Galactic Times Inbox Magazine Issue #103!
This Just In - Observatories Destroyed or Damaged
Sky-Lites — Jupiter at Opposition, the Moon is the Full Show the First Week of January
First Post of Exploration of the Universe With Big Data —The Basics of Astronomical Data
In The Classroom Astronomer Newsletter #51
This newsletter is (c) 2026 Hermograph Press LLC, Opelika, AL. All rights reserved. No part of this may be reproduced without permission in any other medium, such as newspaper columns, webpages, blogs, etc. Please contact the undersigned for permissions, etc., and please do not feed the hungry lawyers…….
No posts
Comments
Nothing yet. Say the first thing.
Sign in to join the conversation.