
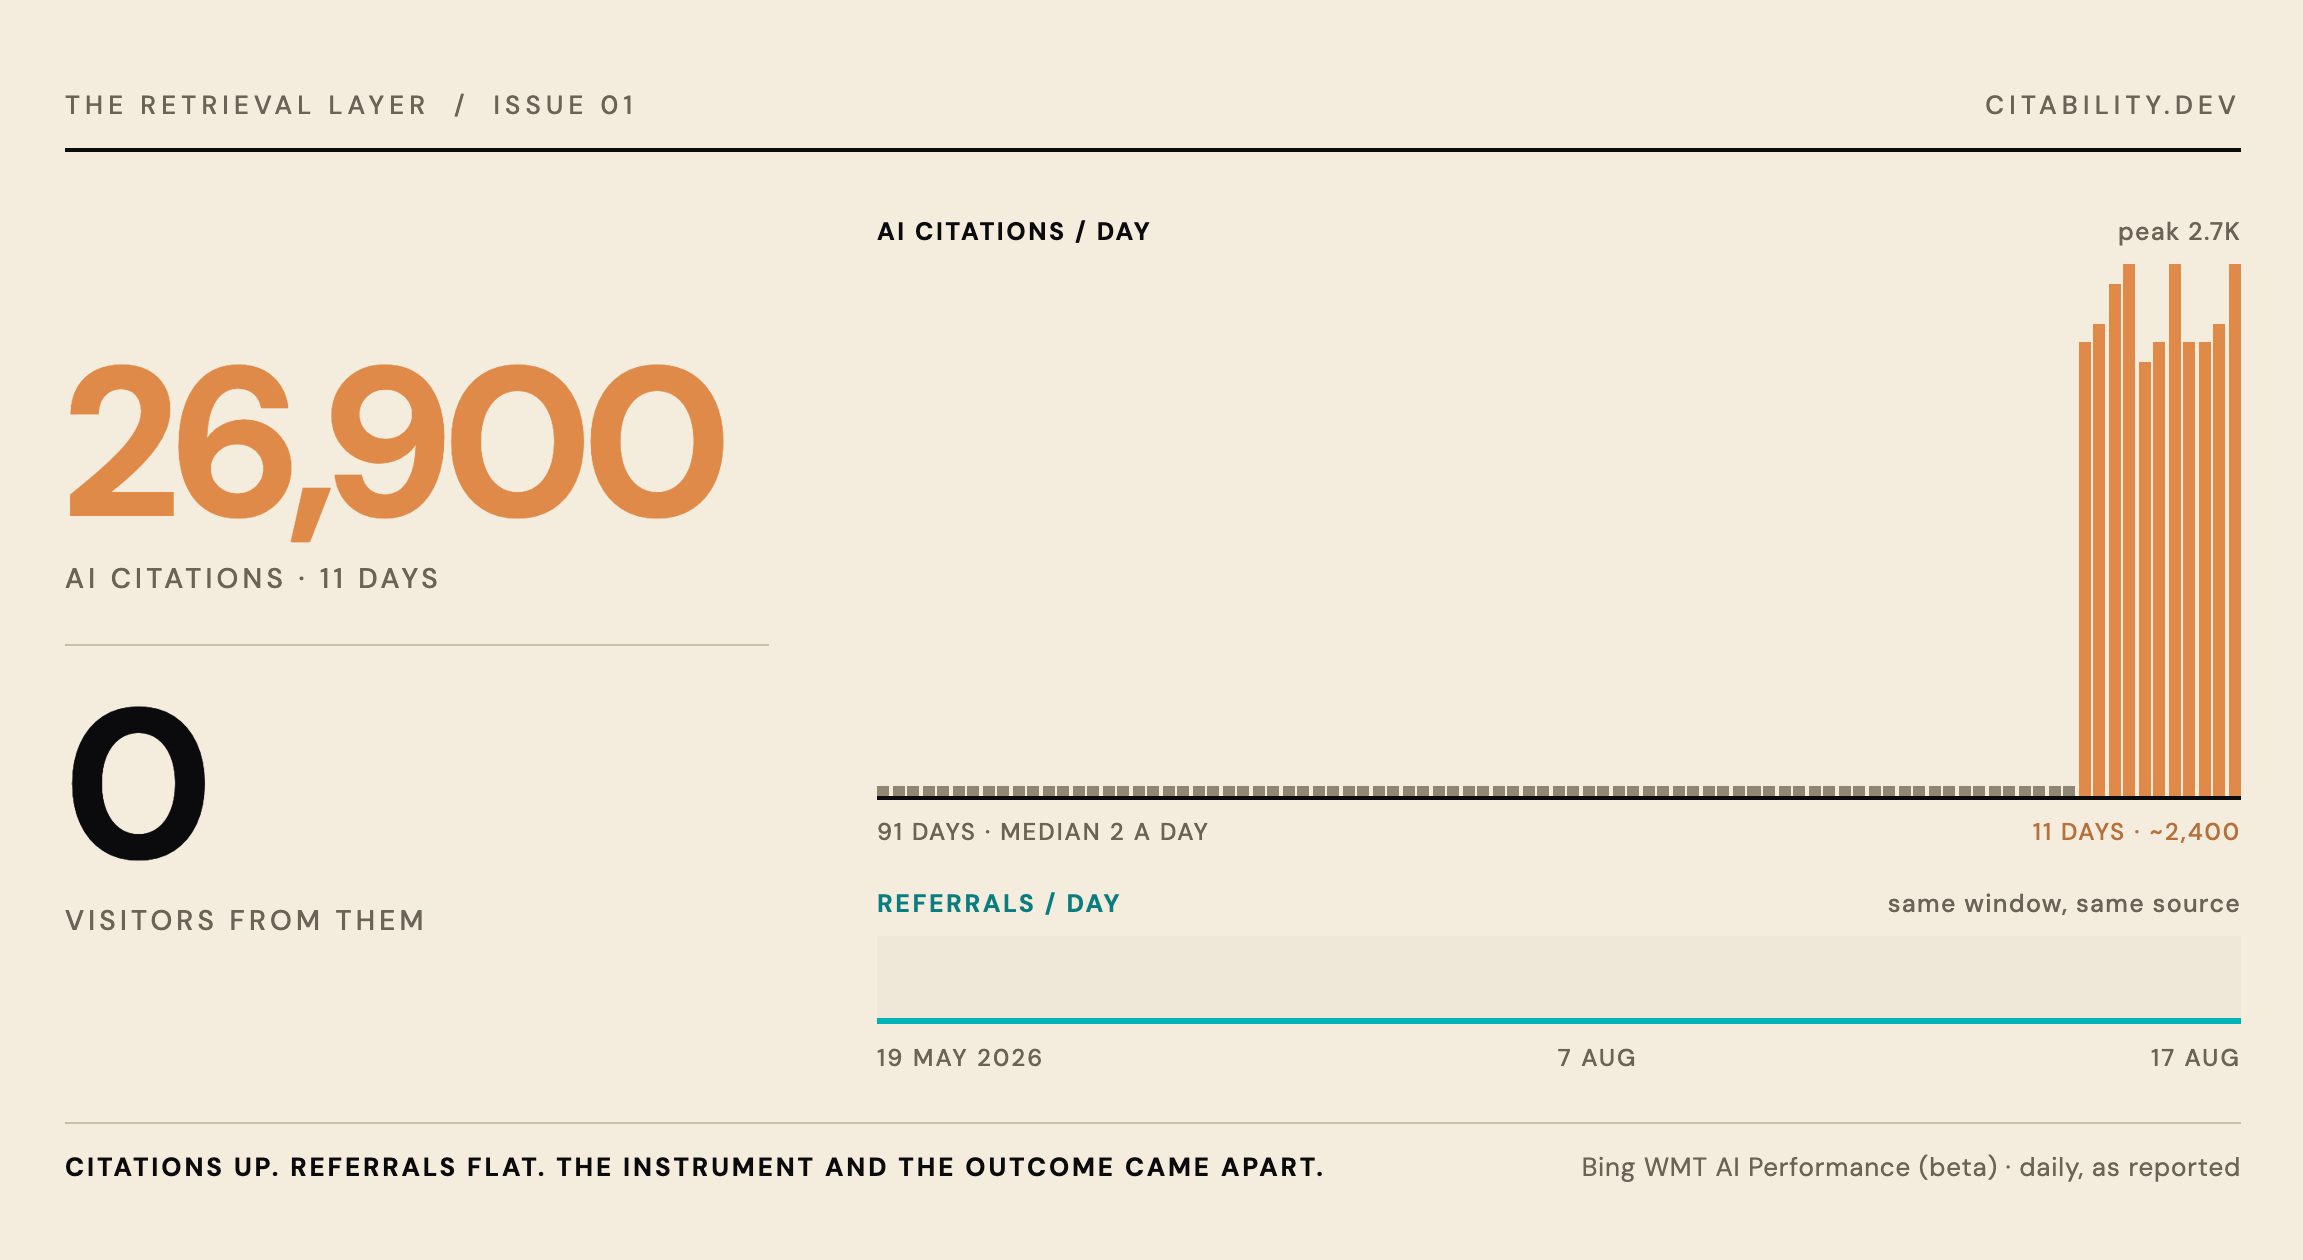
On 6 August 2026, Bing Webmaster Tools reported that citability.dev, a site I operate, had been cited zero times that day by AI systems.
On 7 August it reported 2,300.
The day after that, 2,400. Then 2,600. Then 2,700. For eleven consecutive days the number sat between 2.2K and 2.7K a day and did not move again. The eleven-day total is roughly 26,900 citations.
In the same eleven days, the number of people who arrived at the site from any of those citations was zero.
This issue is about what happened in between those two facts, because working it out changed how I read every AI-visibility dashboard on the market, including the one I sell.
Here is the daily series, read from the chart table in Bing Webmaster Tools AI Performance (beta) on 19 August. Bing prints large numbers in thousands, so where the chart says “2.3K” I have written 2.3K rather than converting it. The conversion would be a guess dressed as precision.
May 19 - Jul 25   0 to 26 a day, median around 2
Jul 26 - Aug 06   0, 0, 0, 0, 0, 0, 0, 0, 0, 0, 6, 0
Aug 07            2.3K
Aug 08            2.4K
Aug 09            2.6K
Aug 10            2.7K
Aug 11            2.2K
Aug 12            2.3K
Aug 13            2.7K
Aug 14            2.3K
Aug 15            2.3K
Aug 16            2.4K
Aug 17            2.7K
Ninety-one days of near-silence, then twelve days of literal zero, then a wall.
The instrument, in its own words, describes what it counts as coming from “Microsoft Copilots and Partners”. So the claim on the label is: Copilot and its partner surfaces cited pages on this domain about 2,400 times a day, every day, for eleven days.
Every AI-visibility product on the market sells a citation count as a visibility metric. Some of them charge four figures a year for it. I build one, which is the reason I am the wrong person to take this number at face value and the right person to check it.
If a citation count can travel from 2 a day to 2,400 a day overnight, hold perfectly flat for eleven days, and deliver not one human being to the site, then the number is not measuring what the category sells it as measuring. That is a load-bearing problem for anyone who is about to buy one of these dashboards, and a worse one for anyone who is about to put the number in a slide for their executive team.
I believed I had earned it.
In late July I had shipped a set of changes to the site aimed squarely at machine retrieval: structured data, an entity map, cleaner canonical pages for the terms the product is about. The plateau begins nine days after that work landed. The story wrote itself. I did the work, the machines noticed, the citations followed.
I want to be exact about this because it is the part of the piece that matters most: I had a hypothesis that flattered me, and I had a chart that appeared to confirm it. That is the precise condition under which people stop checking.
Zero referrals.
Across 26,900 citations, in eleven days, not one visit arrived at the site attributable to them. Not a trickle. Not a rounding error. Zero.
A citation is supposed to be a mention of your page inside an AI answer. Some fraction of the humans reading that answer click through. The fraction is small and getting smaller, and reasonable people argue about whether it is 1% or a tenth of that. Nobody argues that it is zero across twenty-six thousand impressions.
So either the citations were not being shown to humans, or they were not happening in the way the label implies.
I wrote these down before I went looking for which one was true, and I am publishing all four, ranked on the evidence rather than on which one is best for me.
The flattering one. My late-July work made the site retrievable and Copilot started citing it.
If this were true, the data would show weekday and weekend variation, because human demand has weekly seasonality. It would show a ramp rather than a step, because retrieval systems do not re-index the whole web at midnight. It would show some referrals. It would show query diversity. It would show the citations classified under something adjacent to SEO or AI tooling.
Observed instead: perfectly flat, no weekend dip, an overnight step, zero referrals, and the classification and concentration figures below.
This hypothesis is contradicted on five independent predictions. It is the one I started with, and the evidence killed it.
Bing turned on, widened, or re-baselined this report, and the plateau is an artifact of the instrument rather than of the world.
This predicts a step function, a hard start date, no change in referrals because nothing about actual retrieval changed, and possibly retroactive revision of closed time windows.
All of it is observed, including the revision. I read the three-month window total twice. On 19 August the query export summed to 26,283. On 20 August the headline tile for the same window, still ending on the same day, read 27.3K. The end date did not move and the total went up about 4%.
I am labelling that revision inferred, not verified. Two reads differing by 4% is consistent with a revision policy, and the page itself carries the notice “Results may be refined as additional data is processed”. Consistent with is not the same as proof of.
Something automated queries a fixed set of prompts on a schedule, and this site gets cited in the responses. An evaluation harness, a monitoring tool, a competitor’s tracker, a crawler.
This predicts flat volume, no seasonality, extreme query concentration, template permutations, and zero referrals.
Here is the concentration. Three queries account for 8,391 plus 6,259 plus 3,348 citations, which is 17,998, or 68.5% of the total. All three are permutations of one template. The exported list reads like a program iterating a phrase:
platforms comprehensive citation rate analytics
evaluate citation rate tracking measurement tools
best tools for monitoring citation rate
top citation rate reporting tools
Plus four German-language variants of a single query, plus one query that names five competing products in a row.
And here is the classification, assigned by Bing’s own labeller. 22,067 citations, 84.0%, fall under “Research Tools & Databases”. 3,874, or 14.7%, under “Technology”. Under “Search Engines & SEO”, the category a human researching AI visibility would plausibly land in: 80 citations. Three-tenths of one percent.
Whatever is generating this volume is not shopping for an SEO tool.
A reporting change made an already-running automated process visible for the first time.
This predicts everything H2 and H3 predict, and it additionally explains the detail neither of them explains alone: the twelve days of zero.
A scheduled process running before 7 August should have left a low but non-zero baseline. It left nothing. Zero, then a wall, is the signature of measurement starting, not of a process starting.
Ranking on current evidence: H4 first, then H2 and H3 roughly level, then H1 a long way back. This ranking is provisional and I expect it to change.
Across the three-month window, the average number of distinct pages cited per day is 2. On 17 August alone it is 8.
If the plateau were one rigid automated template hitting one canonical page, the cited-page count should be as flat as the citation count. It is not. Something in the mix varies day to day while the total does not.
I have no story for that. I am leaving it in the issue rather than out of it, because an anomaly that survives your explanation is more informative than one that fits it.
This is the part I want to hold myself to in public, because pre-registration is the only thing separating an investigation from a rationalisation. Both tests are specified now. The results go in the next issue whichever way they land.
Test 1: does the plateau end?
Re-read the daily chart once the reporting lag has cleared 18 August onward. The decision rule is fixed in advance:
Plateau continues flat: consistent with H3, or with an ongoing reporting regime
Plateau stops as abruptly as it started: a bounded process or a bounded reporting window, and H4 strengthens sharply
Plateau decays gradually: the first evidence in this whole investigation that is compatible with H1
Test 2: do the citations reproduce?
Fifteen prompts, taken verbatim from the top queries in the export, run against Copilot. Each one in a fresh conversation, no follow-ups, no rephrasing to force a hit. Every prompt gets logged, including the ones that miss, because a test that only records its hits is not a test.
If the site is cited on those prompts: the citations are real retrieval events, whoever or whatever is issuing the queries
If the site is not cited: the reported citations do not reproduce, and the instrument is measuring something other than what its label says
Test 2 is the decisive one, because it is the only test that goes around the instrument instead of asking the instrument about itself.
Stopping rule. If the two tests disagree, the next issue publishes the disagreement and does not resolve it. A forced conclusion would be a worse piece than an honest hung jury.
The number is real as a reported number. Bing Webmaster Tools AI Performance (beta) genuinely reports roughly 26,900 citations for this domain across those eleven days, and I have no reason to think the report is broken.
The number is not evidence of audience demand. A flat plateau starting from zero overnight, with no weekly seasonality, 68.5% of its volume from three permutations of one phrase, 84% of it classified as research-database traffic, and zero referrals across the whole window, is not the shape human interest makes.
The instrument and the outcome have come apart. That is the finding.
I should also note what the instrument says about itself, because it is on the same page as the number and almost nobody quotes it:
The data shown below represents a sample of overall activity. Results may be refined as additional data is processed.
A sample. Not a census. The 26 rows I exported are 26 rows, not 26 queries in existence.
Whether any human being saw a single one of those citations. Whether the same pattern appears on other people’s properties or is specific to mine. Whether the count means anything at all to anybody. Whether the upward revision reflects a policy or a coincidence of two reads. And I still cannot explain the cited-pages figure.
I am also not naming an actor. Nothing in this evidence identifies who or what changed. “A reporting change or a scheduled process” is exactly as far as the data reaches, and going further would be the same overclaim I am writing this issue to avoid.
If you are reporting an AI citation count upward, to a client or a board or yourself, pair it with a referral count from the same window and the same source. Two numbers, one line. If the citations move and the referrals do not, you are reporting on your instrument rather than on your audience, and you should say so in the same breath rather than let the larger number stand alone.
That check costs about ten minutes. It is the cheapest cross-check available on the entire AI-visibility surface, and it is the one that took my own flattering hypothesis apart in a single afternoon.
Next issue: the two tests, and whichever way they fall.
The Retrieval Layer is field notes from building for the web that AI reads. The site under investigation here is citability.dev, which I operate. The instrument is Bing Webmaster Tools AI Performance (beta), whose stated citation sources are “Microsoft Copilots and Partners”. Daily series read 19 August 2026; headline tiles and disclosures read 20 August 2026.
No posts
Comments
Nothing yet. Say the first thing.
Sign in to join the conversation.