
In Part 1 of this article, I reviewed four AI patent-infringement tools using a portfolio where, for some patents, the set of possibly infringing products wasn’t obvious at the initial detection stage. For these patents, the tools did not converge on a consistent set of potentially infringing companies or products, and in some instances even consolidating the analysis to companies alone (merging products) failed to produce agreement across no more than two tools.
This is significant because when AI tools are applied to patents where product information is sparse or ambiguous, they may fail to produce a clear set of targets for further investigation. Moreover, reliance on a single tool increases the risk that potentially valuable leads will be missed.
While using multiple tools can reduce the likelihood of missed leads, it raises two important questions: why do these tools fail to converge, and how many tools are enough? In this article, I examine some of the underlying reasons why AI patent infringement tools produce divergent results.
There are two sources of uncertainty here, one related to the underlying nature of the LLMs doing the work, the other due to the way the vendor tees up the problem. In terms of the vendor approach, the specific methodology they use to both identify the set of possible infringers for inspection, and how they queue the problem up in terms parameters like initial claim construction will impact the results.
From a more formal perspective, the output of a given tool can be viewed as a probability conditioned on two factors: the vendor’s methodology and system design, and the underlying model used:

In this formulation, the answer is probabilistic and depends on θᵢ, which represents the vendor’s methodology and system design, and Mⱼ, the model being used. If multiple models are employed, the vendor may implicitly average across them, but to understand the source of divergence it is useful to consider a single model at a time.
First, consider the vendor’s methodology and system design. As Vadim Kositsky, CTO of PioneerIP, describes it, in identifying the set of companies to be examined, each tool can be thought of as a flashlight in a dark room: where the beam is pointed, along with its shape and intensity, determines which products are even considered for infringement analysis. Some tools also incorporate factors such as company size, which can lead to smaller product lines being excluded from consideration.
Claim construction and iterative analysis also contribute to θᵢ, which effectively encompasses the full set of parameters a vendor uses to structure prompts and LLM workflows. As Paul Lee, CEO and Co-Founder at Patlytics, notes, the effectiveness of document extraction, search, and validation all materially influence the final result.
Turning to the role of the model Mⱼ, there is some disagreement. Tom Hochstatter, Co-Founder and President of Techson, suggests that “different versions [models] will net wildly divergent results,” while Alex Stroe, Co-founder of Patent Watch, views the choice of model as secondary, noting that although it can change the shape of the output on the same task, system design remains the dominant factor.
Before examining how different models, or even repeated runs of the same model, can produce varying answers, it is worth considering the practical implications for portfolio screening, “heatmap” generation, and detailed infringement analysis.
The current set of tools I’ve been using — and there are more out there — are highly effective at surfacing candidate leads for human review. However, in cases where the signals are weaker, either due to limited evidence or a loose correspondence to claim elements, the tools begin to diverge in their outputs.
This is where human judgment becomes essential. Analysts can use initial results to identify relevant market segments and may need to conduct external searches to surface companies whose products warrant closer scrutiny. Most tools allow users to specify target companies, enabling the analyst to iteratively guide the analysis once a broader set of candidates has been identified.
Does this mean a single tool can be relied upon for comprehensive infringement detection? Possibly, but in practice, using multiple tools functions as a form of ensemble analysis, reducing the likelihood that relevant targets are overlooked. The tradeoff becomes one of resource allocation: the cost of using multiple tools versus the cost of additional human effort required to iterate through results from a single system.
As these tools evolve, features such as the ability to filter by company characteristics (e.g. size or location of market) or to quantify uncertainty in the results would significantly improve their utility. In particular, explicit indicators of confidence or variability would help analysts better interpret and prioritize outputs. Some tools give the user the ability to change the claim construction being used in the infringement detection, allowing for the creation of alternate broader or “adversarial” language which is more likely to match the product literature.
To better understand model-level variability, I conducted a controlled experiment to compare how different LLMs perform on a simplified infringement detection task, and to assess whether repeated runs of the same model produce consistent results.
The experiment used a simplified prompt consisting of a single-sentence “claim”: a system that dynamically prioritizes and routes incoming communications based on contextual data and user-specific rules. I then provided short, one-sentence descriptions of several company-product combinations (A1, A2, B1, B2, C1, D1, E1, and F1) and asked the model, without access to external materials, to rank the products most likely to satisfy the claim and assign a score between 0 and 1. The output, as shown below, indicates the strength of the match for each company-product for each independent query or run through the LLM.
Although framed as a mock patent problem, the structure of the task is generalizable to any scenario where there is no single definitive answer.
The results were quite interesting. Across models, there was strong agreement on the top tier of products (A2, A1, B2), moderate agreement on a middle tier (C1, D1, F1), and weak agreement on the lowest-ranked candidates (B1, E1). Notably, this pattern closely mirrors the behavior observed in the portfolio analysis discussed in Part 1.
In addition, some models, such as Claude Opus, produced identical results across repeated runs in this experiment, while others such as GPT-4o exhibited some variability between runs.
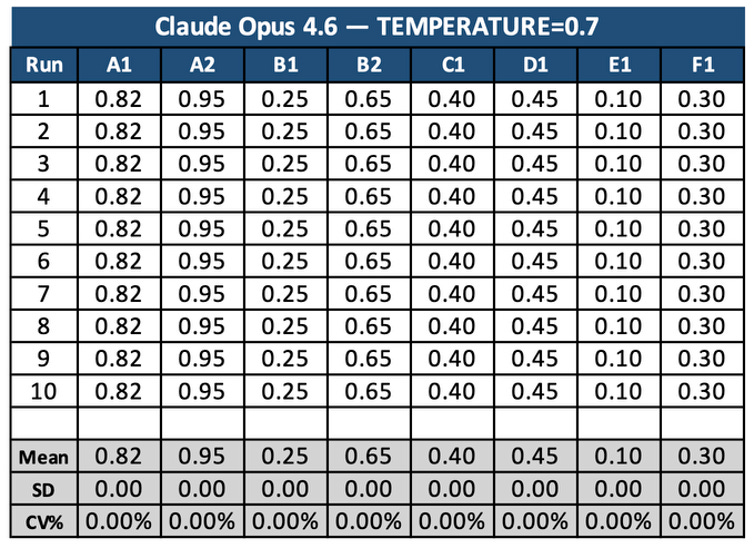
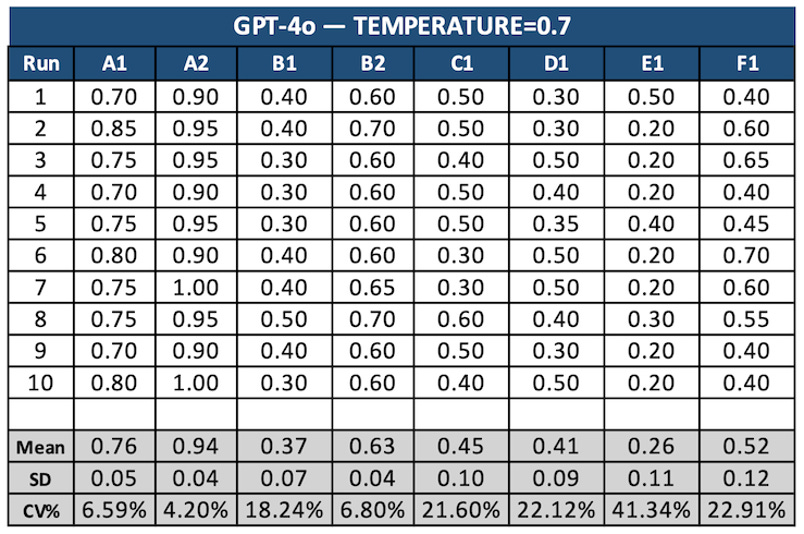
I was curious how “temperature,” the parameter used by LLMs to allow a range of answers, actually works and what it would do in this experiment. Temperature does not change the model’s knowledge or the input; instead, it adjusts how the model samples from its internal probability distribution over possible next tokens. In effect, it can lead the model to explore alternative phrasing or reasoning paths by flattening or sharpening that distribution.
Turning the temperature down toward zero makes the model more deterministic, as it will tend to select the highest-probability tokens at each step. In practice, this leads to more repeatable outputs, although not perfectly so due to system-level factors and the sensitivity of long sequences. Increasing the temperature introduces more variability by giving lower-probability tokens a greater chance of being selected, which can result in more diverse, but sometimes less consistent, answers.
In this experiment, some models, such as Anthropic’s Opus, appeared relatively insensitive to temperature changes: the rankings did not change, and the answers did not vary from run to run. By contrast, GPT-4o showed meaningful temperature sensitivity. At higher temperature, the scores varied across runs, and that variability was large enough to change the relative ranking of some products as compared to the lower temperature. Lowering the temperature reduced the coefficient of variation and produced more stable results. The experiment showed that temperature can affect not only the score assigned to each candidate, but also the ordering of candidates where the scores are close.
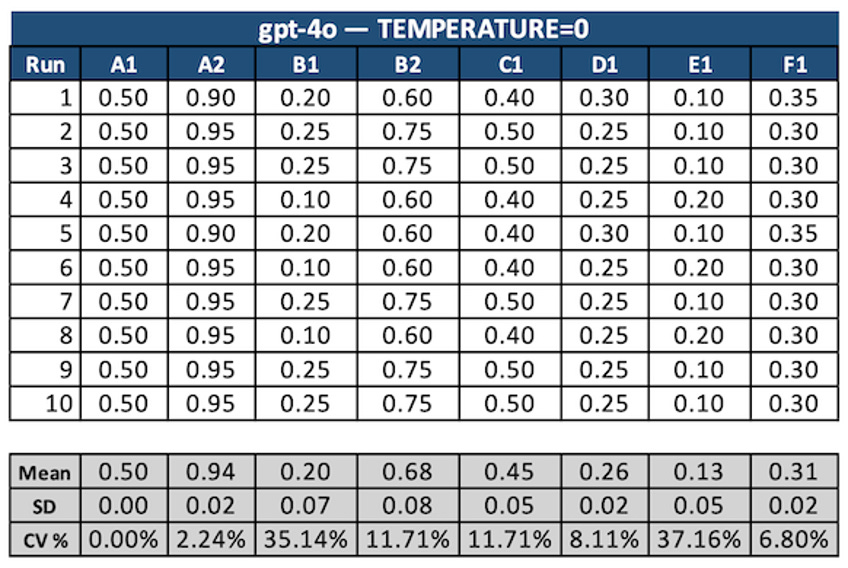
This distinction is important because it highlights that variability in LLM outputs is not limited to superficial differences in wording or minor score fluctuations. In cases where candidates are closely ranked, relatively small changes in token selection, such as those driven by temperature, can propagate through the scoring process and lead to different final rankings. In other words, what appears to be a marginal difference at the probabilistic level can translate into a meaningful difference in analytical outcome.
This behavior mirrors what was observed across vendors in Part 1. When signals are strong, the tools tend to converge. But as the signal weakens and the distinctions between candidates become less clear, variability, whether driven by differences in vendor methodology, underlying models, or even sampling parameters such as temperature, increase.
How should practitioners interpret the outputs of one or more AI infringement detection tools? There is no single answer, but several consistent patterns emerge.
When multiple tools converge on strong signals, those targets are clearly worth further investigation. Intermediate signals are more challenging, particularly when tools disagree, and require additional filtering, supporting evidence, and analyst judgment. Weak signals tend to produce the greatest divergence across tools, often reflecting either limited observable evidence or a marginal relationship to the claim, and may be lower priority for further review.
The experiments described above add an important layer to this interpretation. Variability is not confined to differences across vendors; it can also arise within a single model depending on how outputs are sampled. In the case of GPT-4o, changes in temperature produced enough variation to alter the relative ranking of candidates. This demonstrates that when candidates are closely matched, even small shifts in the underlying probability distribution can lead to different analytical outcomes.
Taken together, these results suggest that the variability observed across tools reflects differences in how each system represents and evaluates the problem, as well as the underlying model(s) used. Variations in data, methodology, model behavior, and sampling can all influence the outcome, and as signals weaken and ambiguity increases, these differences manifest as divergence in results.
For practitioners, the implication is clear: disagreement across tools should not be dismissed outright, nor should it be taken as definitive evidence against a particular target. Instead, it should be interpreted as an indicator of uncertainty—one that can guide where additional investigation, external validation, or expert judgment is most needed.
In this sense, using multiple tools functions as a form of ensemble analysis, helping to surface a broader set of potential leads while also revealing where the underlying uncertainty lies. Understanding and leveraging that uncertainty may ultimately be as important as the identification of any single “best” answer.
No posts
Comments
Nothing yet. Say the first thing.
Sign in to join the conversation.