
I have no doubt that everyone had their trust in public health experts put to the test at some point during the pandemic. Most of us complied with the guidelines – staying put at home, keeping our distance from others, wearing masks and getting vaccinated. But there were moments of doubt. Why were stores allowed to open in some municipalities but not others? Why were bars and restaurants allowed to reopen before schools? What was the Ontario government thinking when it closed outdoor playgrounds? We complied, but we also grew weary and grumbled.
With the passage of a bit more time, we can ask whether this experience had a lasting effect on public trust in government, particularly in government advice in the area of public health.
As we’ve documented before, the immediate impact of the pandemic was to boost public trust in political institutions. Trust ebbed as the pandemic receded, but partly because other concerns – notably the rising cost of living – came to the fore. Trust revived again with the switch of prime ministers in the spring of 2025. You can read all about these ups and downs here.
These trends relate to government in general, and not specifically to government advice on health and medical issues. Fortunately, we have a specific question about that, which we borrowed from an earlier (pre-pandemic) global study from the Wellcome Trust. And, reassuringly (but perhaps surprisingly?), the results show that public trust survived intact.
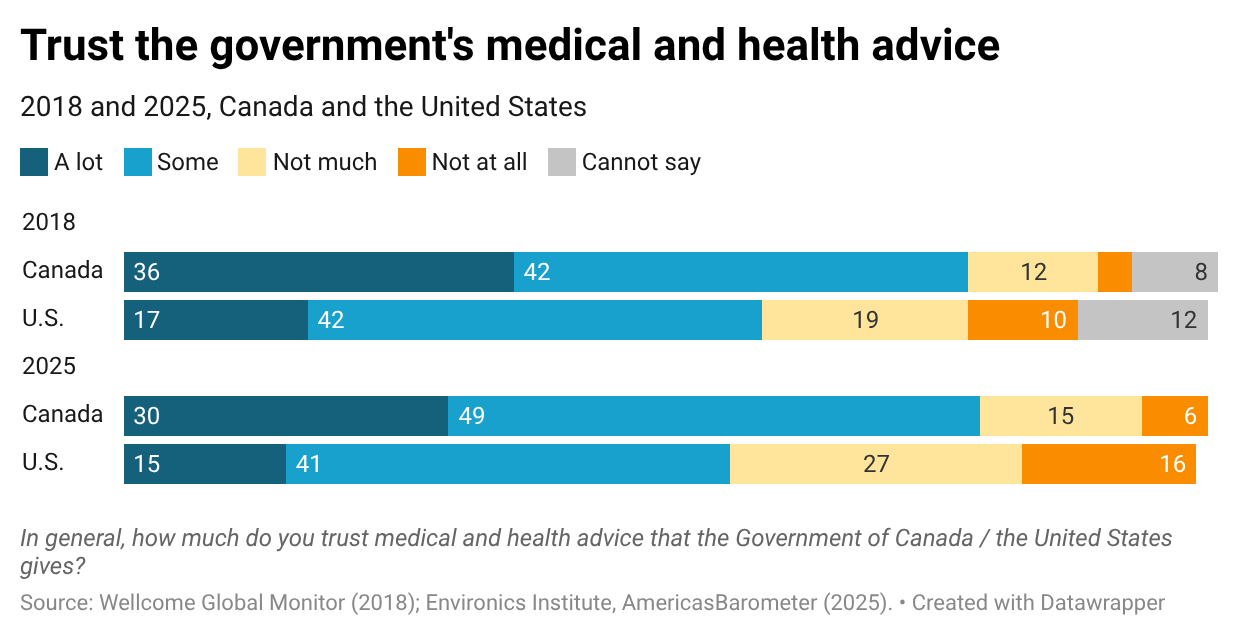
The proportion of Canadians who have a lot or some trust in the “medical and health advice that the Government of Canada gives” is the same today (79%) as it was prior to the pandemic in 2018 (78%).1
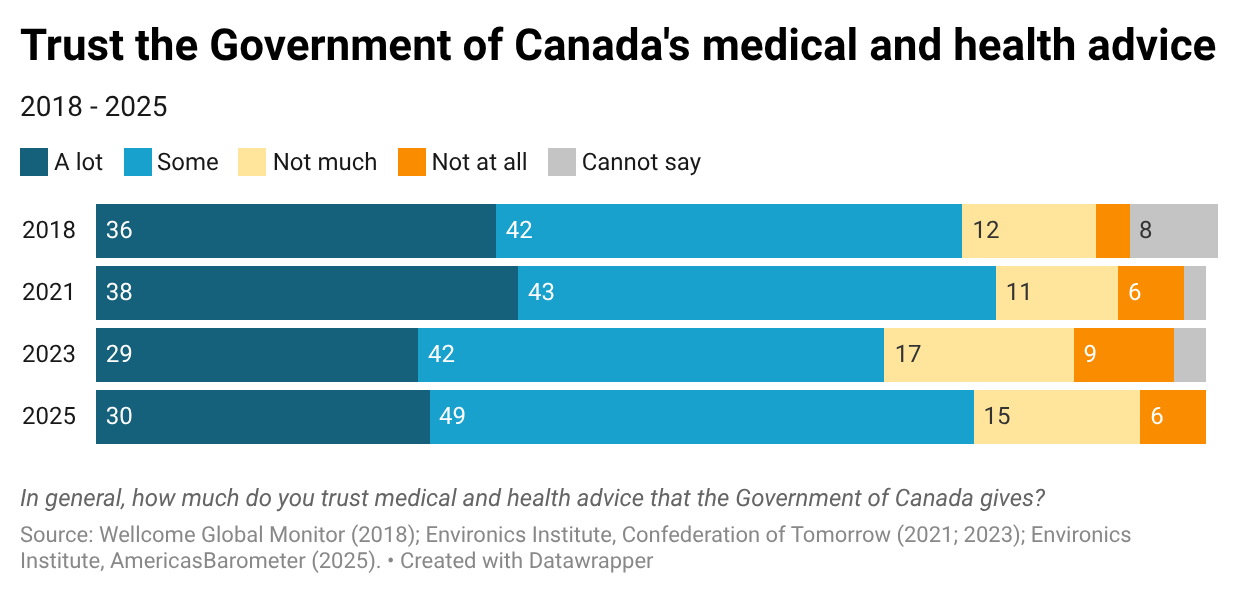
If we look in more detail, it’s possible to make the case that trust softened a little. The proportion with a lot of trust in government medical and health advice fell from 38 percent in 2021 (when the government was busy procuring vaccines) to 30 percent in 2025. The proportion with not much or no trust at all has edged upward, from 15 percent in 2018 to 21 percent today.2 But these are minor changes in the context of the major jolt that the pandemic delivered.
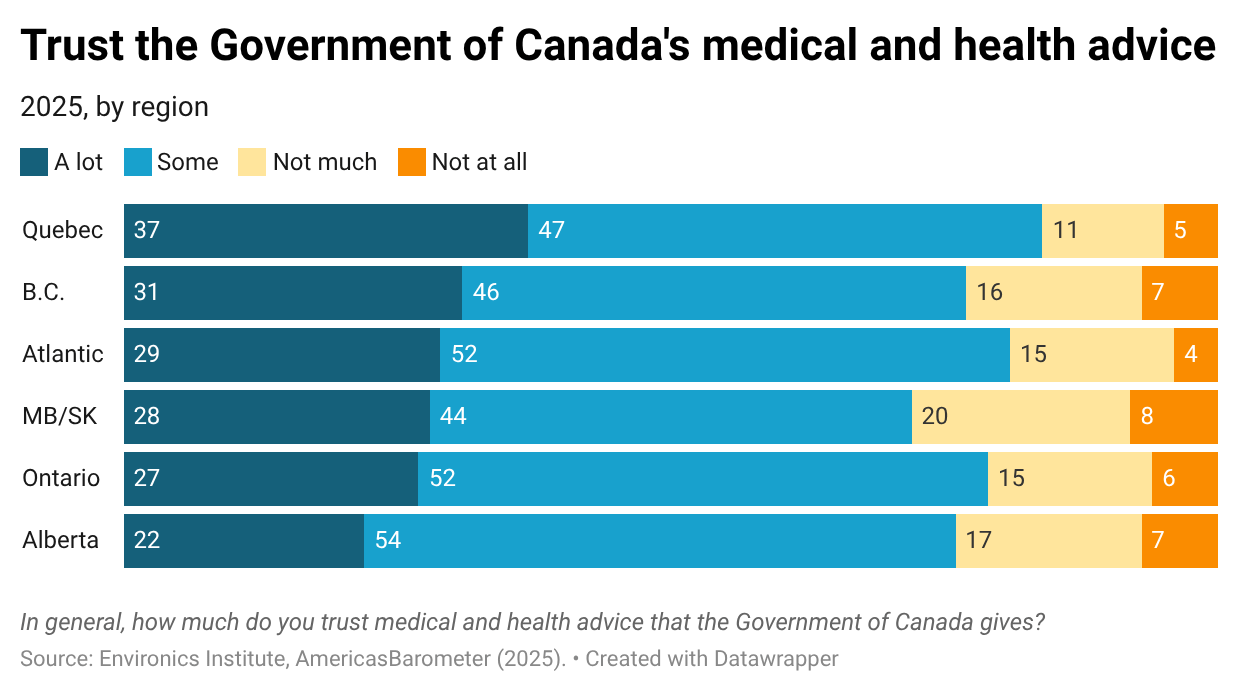
Currently, about three in four Canadians from every major demographic group (e.g., region, age, gender, income bracket, level of education) have a lot or some trust in the medical and health advice that the Government of Canada gives. The proportion with only a lot of trust varies as one might expect. Regionally, it’s highest in Quebec (37%) and lowest in Alberta (22%). Otherwise, it’s a bit higher among those with a university education or with higher household incomes.
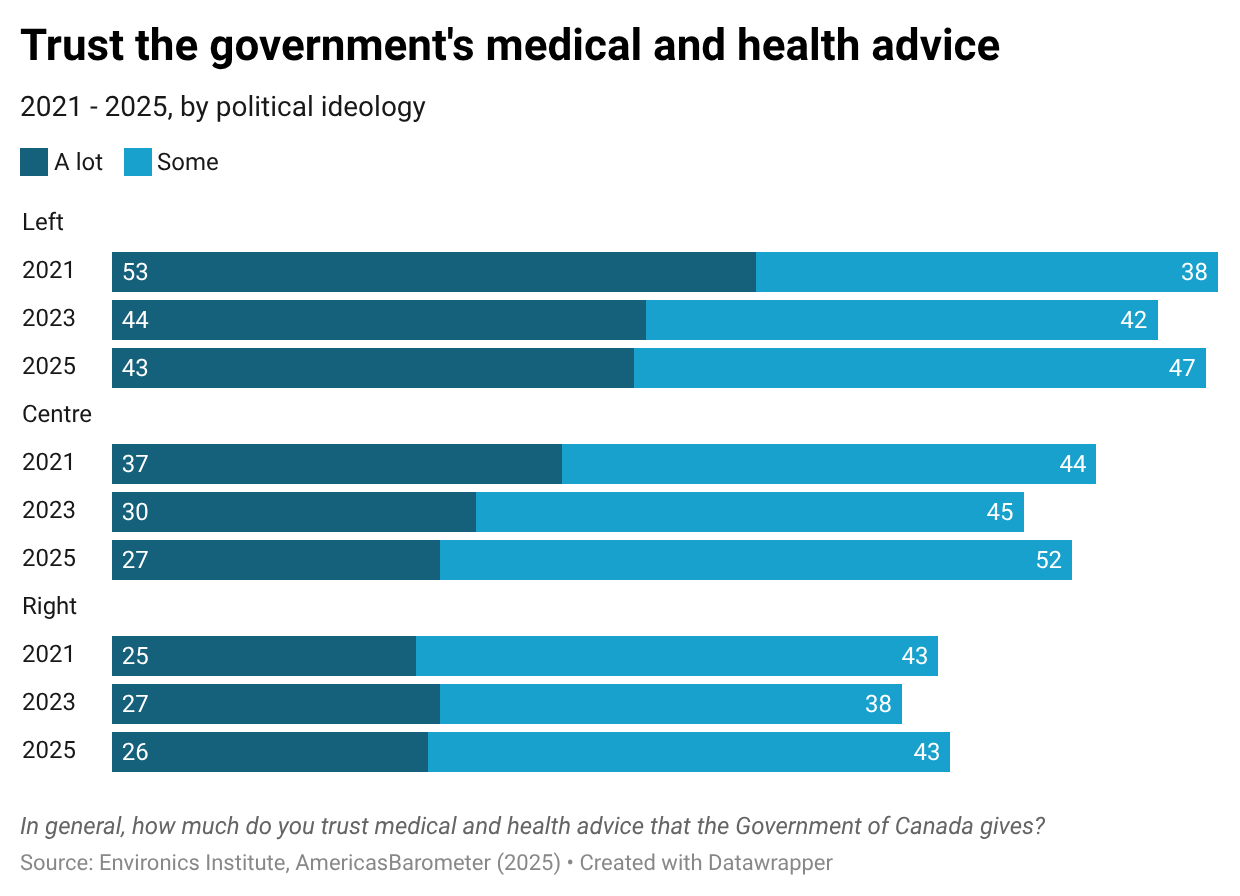
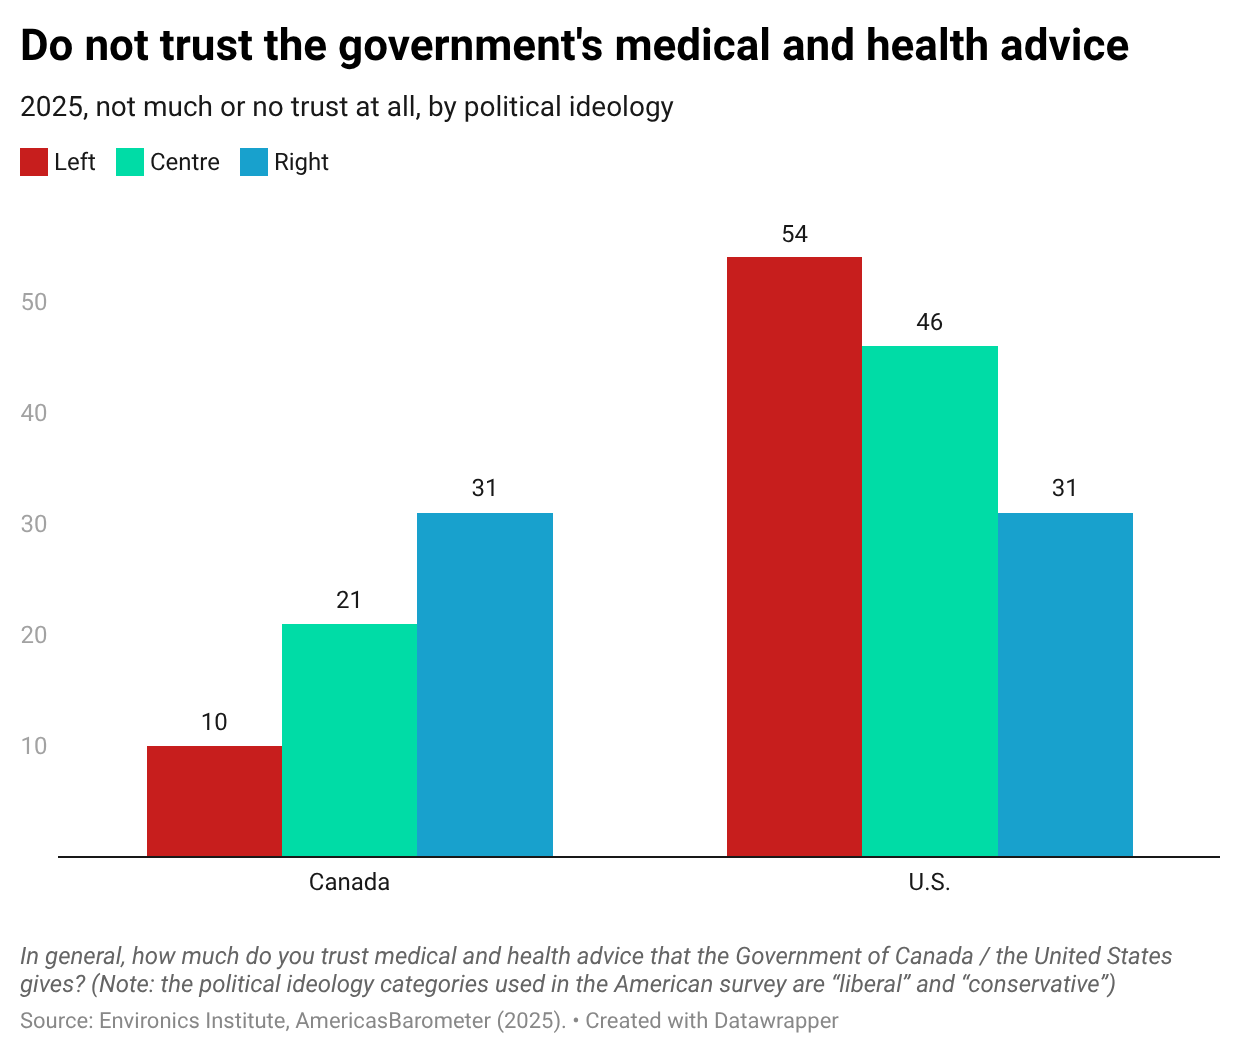
There are even more important differences based on political ideology. Canadians who place themselves on the left of the political spectrum (43%) are more likely to say they have a lot of trust in the medical and health advice that the Government of Canada gives than are those in the centre (27%) or on the right (26%). That said, a majority of all three groups have either a lot or some trust (90% of those on the left, 79% of those in the centre, and 69% of those on the right). Just over one in ten (13%) of those on the right have no trust at all in the government’s health advice.
We don’t have the breakdown by political ideology from before the pandemic. When we look only at the proportions with a lot of trust, there has been a decline since 2021 among those on the left and in the centre, but not among those on the right (likely because the 2021 figures for left-leaning and centrist Canadians were boosted by the government’s response to the pandemic at the time). When we combine those with a lot and some trust, however, there has been little change over time for any of the three groups.
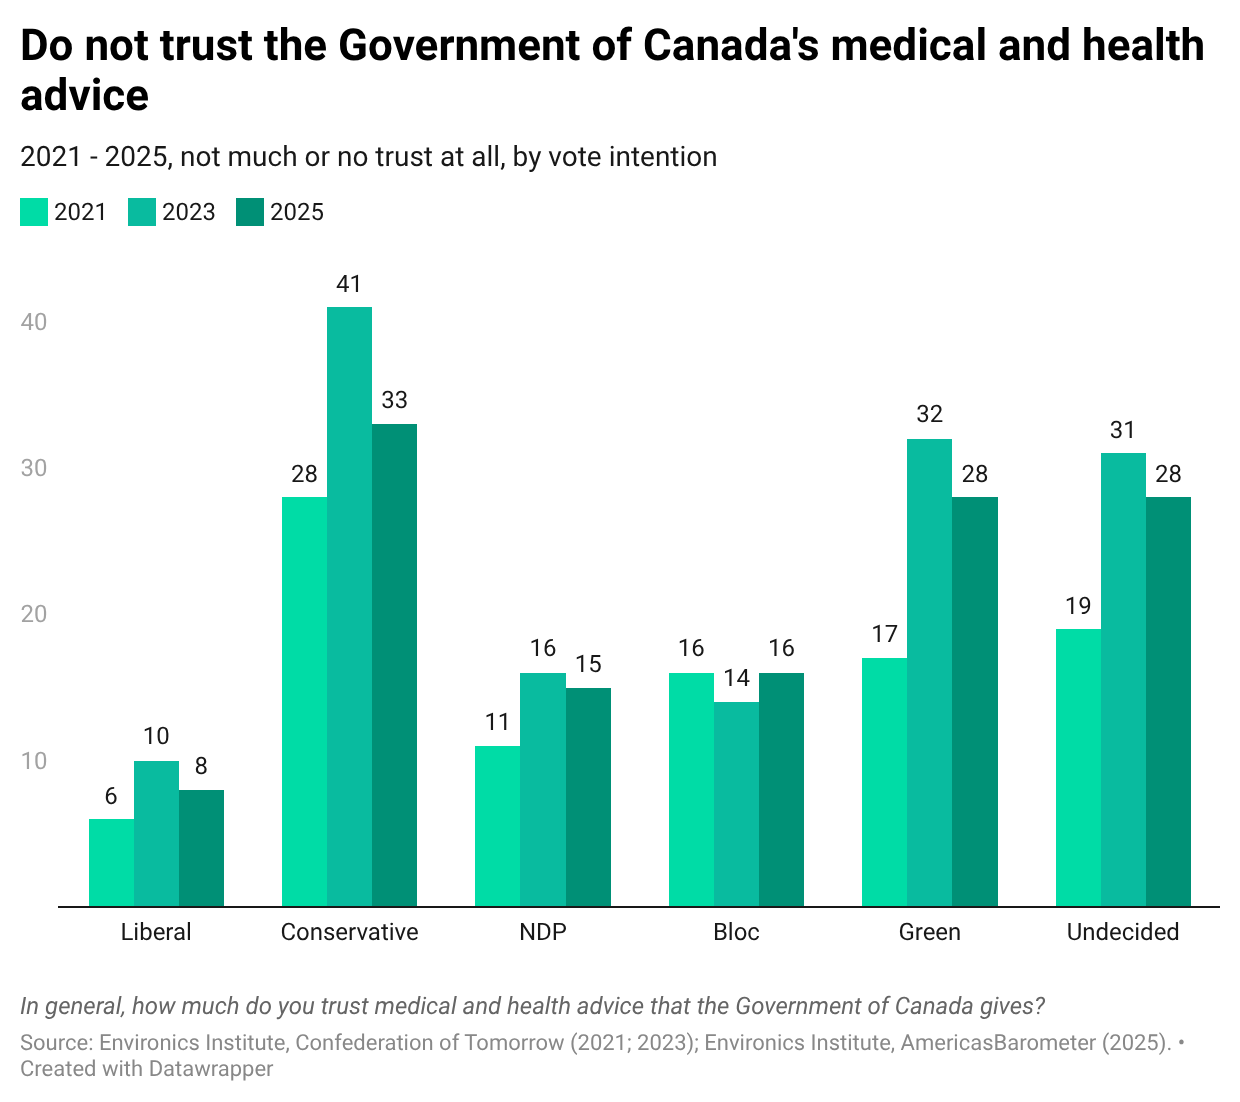
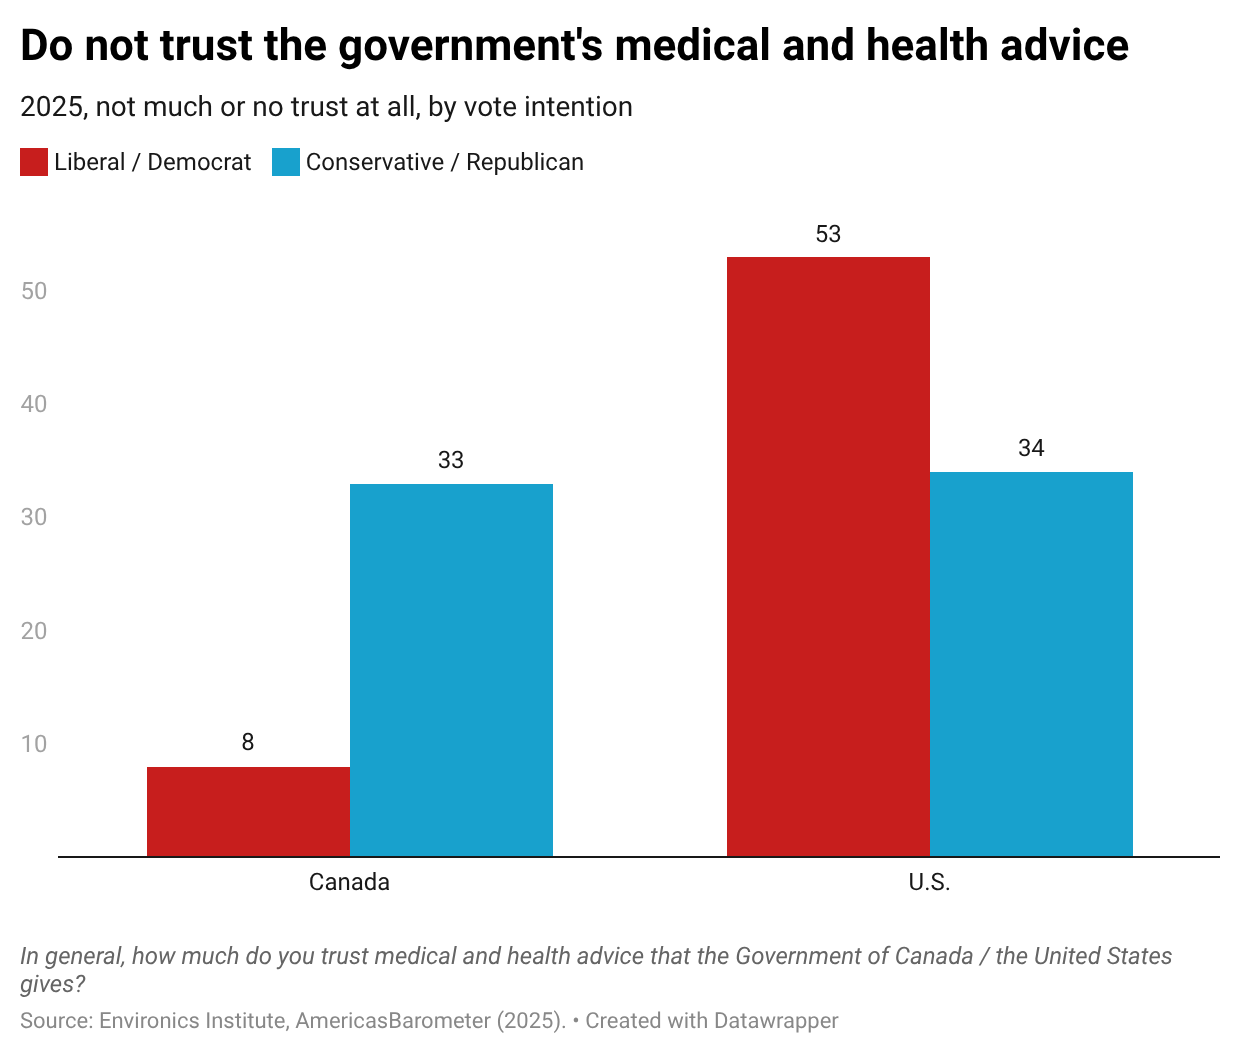
The pattern based on vote intention is somewhat similar: the proportion with a lot of trust in the Government of Canada’s medical and health advice is higher among supporters of Liberal Party (44%) than the Conservative Party (15%), but at least two-thirds of the supporters of all parties currently say they have a lot or some trust. One in three (33%) Conservative Party supporters currently have not much or no trust at all, but this is down eight points since 2023. It’s worth noting that that, while the level of trust among Conservative Party supporters is lower than that among supporters of the Liberal Party, the NDP or the Bloc Québécois, it’s not much lower than that among Green Party supporters or undecided voters.3
The proportions with a lot of trust have ebbed downward since 2021 among all groups of partisans, but not the proportions with a lot or some trust.4 5
How does the level of trust in government health advice in Canada compare to that in the United States? Perhaps not surprisingly, trust is higher in Canada: 57 percent of Americans currently have a lot or some trust in the medical and health advice that their government gives – 12 percentage points lower than the proportion in Canada. Canadians are twice as likely as Americans to have a lot of trust (30%, compared to 15%). Americans (43%) are twice as likely as Canadians (21%) to say they have not much or no trust at all.
The results from 2025 are quite similar to those from the Wellcome Trust’s earlier study from 2018.
What’s different in the United States, however, isn’t just the overall level of trust, but also how this varies by political ideology. In the U.S., it is the left – and not the right – that is more skeptical of government advice.
Similarly, Democrats are much more likely Republicans to say they have not much or no trust at all. This is hardly a surprise, given the personalities and pronouncements of the people who are currently running the U.S. government – and the U.S. Department of Health and Human Services specifically.
Part of what this comparison serves to highlight, then, is how much context matters in these comparative exercises. I think it’s fair to say that the assumption underpinning the survey question is that governments in general aim to protect public health as best they can, based on the evidence they have at hand. In asking citizens (in Canada and in other countries around the world) whether they trust their government’s advice, the goal is to assess and compare the extent to which these genuine efforts in the public interest are taken at face value or treated with suspicion.
But this assumption currently doesn’t hold in the United States. The contrasting survey results between Canada and the U.S. therefore don’t so much illustrate a difference between citizens in the two countries, as between their governments.
The best illustration of the importance of this context is the comparison of the views of Conservative Party supporters in Canada to those of Republican Party supporters in the U.S. The numbers are virtually identical, with 15 and 20 percent, respectively, having a lot of trust in their national government’s health and medical advice; and 33 and 34 percent, respectively, having not much or no trust at all. But Conservative Party supporters are reacting to a federal health department led by Majorie Michel (a Liberal government minister), while Republican Party supporters are reacting to one led by Robert F. Kennedy Jr. (a member of Donald Trump’s cabinet). Given this striking difference in context, it would be quite misleading to suggest that the two groups of partisans actually share a similar mindset on questions of public health.
This post features data from the AmericasBarometer 2025 Canadian and American surveys. Additional results from this survey are posted on our website.
The AmericasBarometer is a regular comparative survey of democratic values and behaviours that covers countries in North, Central and South America, as well as a significant number of countries in the Caribbean (the 2025-26 study will cover 20 countries). The project is led by the LAPOP Lab at Vanderbilt University’s Center for Global Democracy (CGD). The Canadian and American surveys were conducted by the Environics Institute for Survey Research, in partnership with CGD’s LAPOP Lab at Vanderbilt University and with the support of the Max Bell Foundation. The author is solely responsible for any errors in presentation or interpretation.
The Canadian survey was conducted online with a sample of 3,550 Canadians (aged 18 and over) between July 30 and August 7, 2025. The results are weighted by region, age, gender, education and language so as to be fully representative of the Canadian population. The U.S. survey was conducted online with 1,600 Americans (18 years of age and older) between October 3 and 16, 2025. The results are weighted by region, age, gender, education and ethnicity so as to be fully representative of the American population.
What is the Environics Institute for Survey Research? Find out by clicking here.
Follow us on other platforms:
Bluesky: @parkinac.bsky.social
Twitter: @Environics_Inst or @parkinac
Instagram and Threads: environics.institute
Photo credit: Frank Meriño
The 2018 survey was administered by telephone; the other surveys reported here were conducted online.
This is partly because there are fewer people in the 2025 survey who don’t take a position on the question either way. This is a feature of the way the AmericasBarometer presents questions on screen. Questions initially appear without a “decline to answer” option. This option only appears if a respondent tries to move on to the next question without answering. The effect of this technique is to prompt more answers and fewer declines.
In 2025, the subsample of People’s Party supporters is too small to report. It was also small in 2021 and 2023, but large enough to allow us to observe that, not surprisingly, this group was different from all others – as a majority of them had not much or not trust at all in the medical and health advice that the Government of Canada gives. For more analysis on this point, see: Who voted for the People’s Party of Canada?
Unfortunately, we don’t have results by political ideology or vote intention in the 2018 survey, so this comparison only starts in 2021.
When tracking the views of party supporters over time, it’s important to remember that they aren’t always completely comparable. Party support varies, meaning that some voters shift from group to group. Changes in survey results among one party’s supporters over time don’t necessarily signal a change of opinion; it could mean that that group of supporters added or lost people with particular opinions. In the period covered by these surveys, the most important shifts are more voters supporting the Liberal Party, and fewer supporting the NDP, in 2025.
Comments
Nothing yet. Say the first thing.
Sign in to join the conversation.