
The chart system shown in the screenshots is a multi-factor macro-liquidity forecasting and regime-detection framework designed primarily to model and anticipate:
Bitcoin cyclical peaks and bottoms
Equity liquidity sensitivity
Credit/liquidity stress transitions
Treasury refinancing pressure
QE / stealth QE transmission effects
Macro risk-on / risk-off transitions
The underlying script integrates liquidity, volatility, debt rollover requirements, credit impulse data, and macro risk metrics into a blended probabilistic forecasting system.


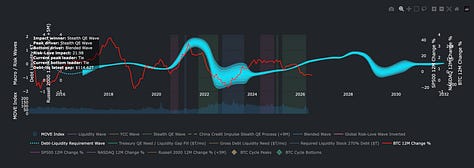
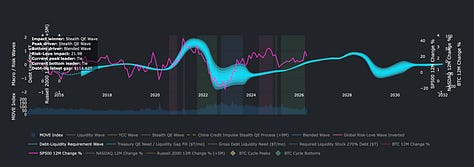


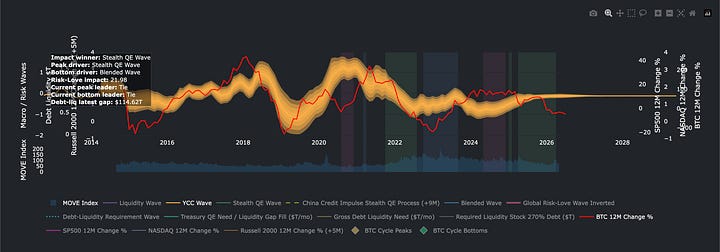

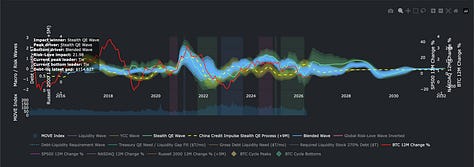
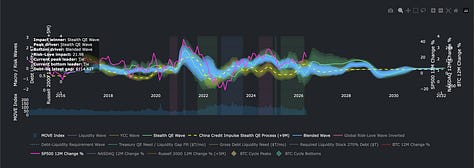
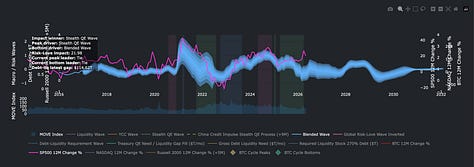
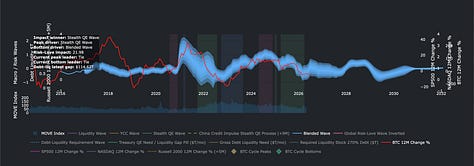
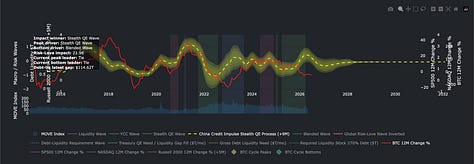
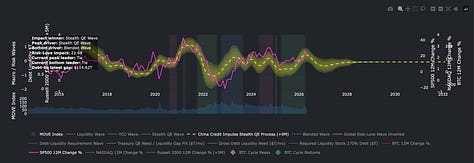
The framework attempts to answer:
“Where is systemic liquidity flowing, how strong is it, and which assets are likely to respond next?”
The model is effectively treating:
liquidity as the primary fuel source,
volatility as a suppressor/amplifier,
debt refinancing as future liquidity demand,
and Bitcoin/equities as downstream liquidity expressions.
The system combines:
Global liquidity
Stealth QE
Yield Curve Control pressure
China Credit Impulse
Treasury debt rollover requirements
MOVE volatility conditions
Global risk appetite
into dynamic wave structures.
Derived from:
Global liquidity
Shadow monetary base
Smoothed yearly liquidity impulse
MOVE-index-adjusted liquidity acceleration
The script:
Calculates YoY liquidity growth
Applies volatility dampening via MOVE Index
Uses EMA smoothing layers
Converts into normalized z-score wave structures
This is the system’s:
primary macro liquidity pulse,
central bank balance sheet expansion effect,
broad global monetary expansion signal.
The Liquidity Wave tends to:
lead BTC major rallies,
align with broad risk-on conditions,
deteriorate before liquidity contractions.
The forecast region into:
2027–2031
shows:
flattening,
reduced acceleration,
lower liquidity expansion velocity,
slower cyclical growth conditions.
That implies:
weaker speculative liquidity,
slower BTC upside velocity,
potentially longer consolidation structures.
Built from:
Treasury issuance effects,
stealth liquidity injection,
QE-like Treasury refinancing mechanics,
debt rollover liquidity gaps.
The model assumes:
Debt refinancing pressure eventually forces liquidity creation.
This becomes a synthetic QE pressure wave.
This wave is effectively:
Treasury QE necessity,
hidden balance sheet expansion,
refinancing stress response.
The system projects it dynamically into the future.
This wave:
aligned extremely well with the 2020–2021 BTC expansion,
anticipated several liquidity accelerations,
remained elevated during Treasury-heavy refinancing periods.
The system is projecting:
continued Treasury liquidity requirements,
periodic liquidity injections,
but with declining effectiveness after ~2028.
That implies:
liquidity may continue being injected,
but diminishing marginal asset impact may occur.
This resembles late-cycle debt saturation behavior.
Derived from:
China-Bloomberg-Credit-Impulse-Index
shifted forward by +9 months
The script intentionally:
shifts China credit conditions forward,
because Chinese credit expansion historically impacts global liquidity later.
This acts as:
global manufacturing/liquidity forward impulse,
emerging-market credit expansion signal,
global cyclical reflation indicator.
The chart suggests:
China impulse often precedes BTC acceleration,
aligns strongly with cyclical bottoms,
influences reflation trades globally.
The forward curve shows:
weakening impulse strength,
flattening credit expansion,
less aggressive future reflation.
That implies:
weaker commodity reflation,
lower global manufacturing acceleration,
slower speculative expansion cycles.
The most important system component.
This dynamically combines:
Liquidity Wave
Stealth QE
YCC Wave
Debt-Liquidity Wave
China Credit Impulse
Risk-Love influence
using:
dominance weighting,
rolling momentum influence,
volatility-adjusted weighting.
The weighting changes dynamically depending on:
which liquidity source dominates at the time.
This is the:
master macro liquidity composite,
system-wide probabilistic cycle indicator,
highest-confidence liquidity forecast engine.
The Blended Wave:
closely tracked BTC macro cycles,
aligned with major cycle peaks/bottoms,
anticipated broad liquidity transitions.
It appears strongest during:
synchronized liquidity expansion environments.
The blended projection suggests:
post-2026 liquidity deceleration,
weakening cyclical upside,
liquidity normalization into 2028–2030,
potential transition into slower macro growth regime.
The wave flattening implies:
reduced excess liquidity,
weaker speculative excess,
more range-bound macro behavior.
Built from:
Global-RiskLove-Composite
MOVE Index suppression adjustments
Then inverted.
This measures:
macro risk appetite deterioration,
stress-sensitive positioning,
crowd risk aversion.
It:
often peaks near BTC tops,
weakens during liquidity contractions,
helps identify risk-off transitions.
The system suggests:
elevated but unstable risk appetite,
increasing fragility,
potential volatility-sensitive environment ahead.
This is one of the most advanced parts of the system.
The script:
models Treasury rollover obligations,
projects refinancing requirements,
estimates required liquidity stock,
compares required liquidity vs existing liquidity.
The model assumes:
Debt requires liquidity expansion to remain serviceable.
Treasury Bills
Notes
Bonds
rollover cycles
interest burden growth
Fed liquidity capacity
This wave measures:
future liquidity necessity,
systemic refinancing pressure,
probability of forced QE/Treasury support.
The charts suggest:
structurally rising liquidity requirements,
ongoing refinancing dependency,
continued pressure toward stealth QE.
This is effectively a:
debt sustainability stress indicator.
Represents:
Yield Curve Control pressure,
bond market stress,
suppression requirements on long-term rates.
It reflects:
interest-rate suppression necessity,
sovereign debt stress,
policy intervention pressure.
YCC conditions:
aligned with macro stress periods,
often preceded liquidity injections.
The system implies:
ongoing structural rate suppression pressure,
but weakening cyclical influence relative to prior years.
The framework is heavily BTC-centric.
The script:
computes rolling correlations,
directional hit rates,
turning-point hit rates,
lead/lag structures.
It attempts to identify:
which wave currently dominates BTC.
The top-left diagnostics panel:
“Impact winner”
“Peak driver”
“Bottom driver”
shows:
which liquidity engine currently has strongest predictive influence.
In the screenshots:
Stealth QE Wave dominates.
This implies:
BTC is currently more responsive to Treasury/liquidity-gap mechanics
than traditional liquidity expansion.
The system overlays:
SP500 12m change
NASDAQ 12m change
Russell 2000 12m change
to compare:
liquidity transmission into equities.
Tracks:
blended liquidity conditions relatively closely,
especially during low-volatility expansion regimes.
Appears:
more sensitive to liquidity acceleration,
stronger during QE expansion phases,
more correlated with speculative liquidity.
The Russell shift (+5 months) suggests:
small caps lag liquidity conditions,
delayed transmission into domestic risk assets.
This is consistent with:
liquidity first reaching large-cap/speculative assets,
then filtering into broader domestic equity markets later.
The MOVE Index is critical.
The script uses it as:
volatility suppression coefficient,
liquidity effectiveness dampener.
High MOVE:
reduces liquidity effectiveness,
suppresses macro wave expansion.
Low MOVE:
amplifies liquidity impact,
enhances speculative responsiveness.
This is important because:
liquidity alone does not move markets equally under all volatility regimes.
The system projects:
debt rollover needs,
Treasury issuance structures,
refinancing composition,
future liquidity gaps,
QE necessity.
The model assumes:
debt compounds,
refinancing creates liquidity dependency,
Treasury issuance structure changes future macro liquidity sensitivity.
This creates:
projected future liquidity waves into the 2030s.
The chart system overall suggests:
massive synchronized liquidity expansion,
strong QE + stealth QE alignment,
powerful BTC/equity reflation.
liquidity contraction,
rising volatility,
risk-off macro regime,
BTC collapse alignment.
stealth QE and Treasury liquidity increasingly dominant,
liquidity support returns,
speculative assets stabilize/recover.
The system projects:
slowing liquidity acceleration,
structurally persistent refinancing pressure,
continued need for stealth liquidity support,
but declining marginal speculative effect.
That implies:
slower BTC cycle velocity,
more muted equity upside,
liquidity dependency without explosive expansion.
The architecture is attempting to build:
a macro-liquidity operating system,
a dynamic market regime engine,
a liquidity-to-asset transmission framework,
a probabilistic cycle forecaster.
It combines:
monetary expansion,
debt mechanics,
volatility,
credit expansion,
Treasury refinancing,
and risk appetite
into a unified macro wave framework.
The system is effectively treating:
Bitcoin and equities as downstream reflections of global liquidity physics.
Script open-sourced here.
No posts
Comments
Nothing yet. Say the first thing.
Sign in to join the conversation.