
I love rocks.
To understand the upstream business, you have to hold three questions in your head at once. Where do oil and gas actually come from? How do companies find it? And once they’ve found it, what do they actually have?
Glossary of terms, and five big takeaways for the climate-focused folks at the end.
A Brief Geologic Survey
Hydrocarbons are dead things. Dead things that have carbon-to-hydrogen bonds.
More specifically, they are mostly the remains of marine algae and plankton (for oil) and terrestrial plants (for most gas) that got buried in fine-grained sediments before they could fully decompose. Over millions of years, more sediment piles on top, the stuff gets pushed deeper, and temperature and pressure rise. Somewhere between roughly 60 and 150°C, you’re in what petroleum geologists call the “oil window”. The organic material (now called kerogen) cracks into liquid hydrocarbons. Hotter than that, you’re in the gas window, and you mostly get methane. Hotter still and you’ve cooked everything to graphite.
That’s the source rock. But source rock alone doesn’t make a producing field. You need four things to line up:
A source rock that actually generated hydrocarbons.
A reservoir rock something porous and permeable enough to hold the hydrocarbons and let them flow. Sandstones and carbonates are the classics.
A seal an impermeable layer (often shale or salt), sits on top of the reservoir, so the hydrocarbons don’t just keep migrating upward.
A trap a geometric configuration that concentrates the migrating hydrocarbons into one place. Usually, an anticline (a dome-shaped fold), a fault block, or a stratigraphic feature like an ancient reef or sand pinchout.
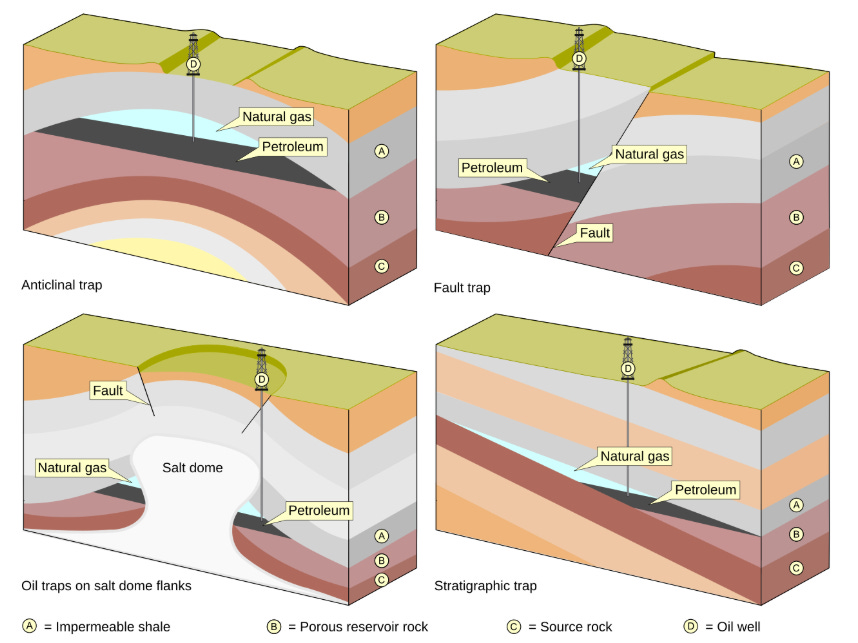
Miss any one of those and you have a dry hole. This is called the petroleum system, and the entire upstream industry is essentially a wager on whether all four elements line up underground in a place you can drill, at a depth you can afford, in a country that will let you sell what comes out.
Shale is the exception that broke the framework, but I’ll save that for the next post.
The History of Exploration
For most of human history, we found oil when it was literally coming out of the ground.
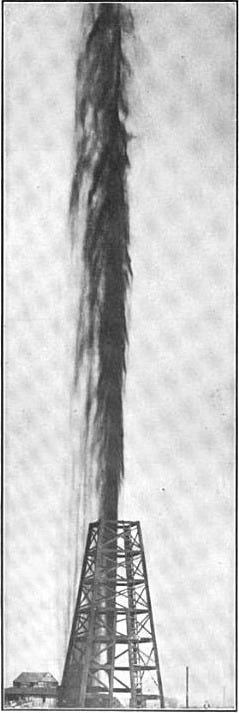
The earliest oil booms (Baku in the 1840s, Pennsylvania starting in 1859 with Edwin Drake’s well at Titusville, Texas in 1901 when Spindletop blew in near Beaumont) were almost entirely driven by seeps. These are places where oil migrated all the way to the surface and pooled or trickled out of the ground. People had been collecting it for millennia for waterproofing and medicine. Drilling near a seep was sometimes called “creekology” because wildcatters would follow oily creeks upstream and drill where the slick was thickest. You’ll hear and see the name wildcatter come up often. This is a person or group who goes into areas with limited data on prospective oil reservoirs and drills exploratory wells. They have an immense risk appetite, which is both beneficial with a well hits, and capital destructive when it doesn’t. Creekology worked often enough to fund the next round of drilling, which is a time-honored tradition in wildcatting.
The first real piece of subsurface theory was the anticline theory, formalized in the late 1800s. The idea was that oil and gas are buoyant, they migrate upward, and they get trapped under the crests of dome-shaped folds. So map the surface geology, find the anticlines, drill the crests.
In the 1920s, geophysics arrived. Eötvös torsion balances, and later gravimeters, let you measure tiny variations in the Earth’s gravitational field, which correlate with subsurface density changes (salt domes, for instance, are less dense than surrounding sediments and show up clearly). The first oil field discovered by geophysical means in the United States was the Nash salt dome in Brazoria County, Texas, in 1924, located using a torsion balance. Magnetic surveys did something similar for magnetic basement rocks. These were wide-area screening tools, they could tell you “something interesting is down there” but not much about what.
Then we got seismic.
The Acoustic Gift
A seismic survey is, at its core, a sonogram for the Earth. You generate an acoustic pulse at the surface (historically dynamite, now usually a vibrator truck onshore or an air gun array offshore). The sound waves travel down into the ground, hit boundaries between rock layers, and reflect back up. You record the reflections with arrays of geophones (onshore) or hydrophones (offshore). The time it takes for the echo to come back tells you how deep the boundary is. The strength and character of the echo tells you something about the rocks on either side.
The reason this works is acoustic impedance, a property that depends on rock density and the speed of sound through that rock. Wherever impedance changes sharply (sand sitting on shale, shale sitting on salt, shale sitting on a gas-filled sandstone), you get a reflection. Hydrocarbons, especially gas, change impedance enough that you can sometimes see them directly on a seismic image as a “bright spot.”
The technique grew out of WWI artillery-locating work. J.C. Karcher and colleagues recorded the first reflection seismograph experiment near Oklahoma City in June 1921, and Karcher’s reflection method led to a commercial discovery in the Seminole oil field of Oklahoma in December 1928.
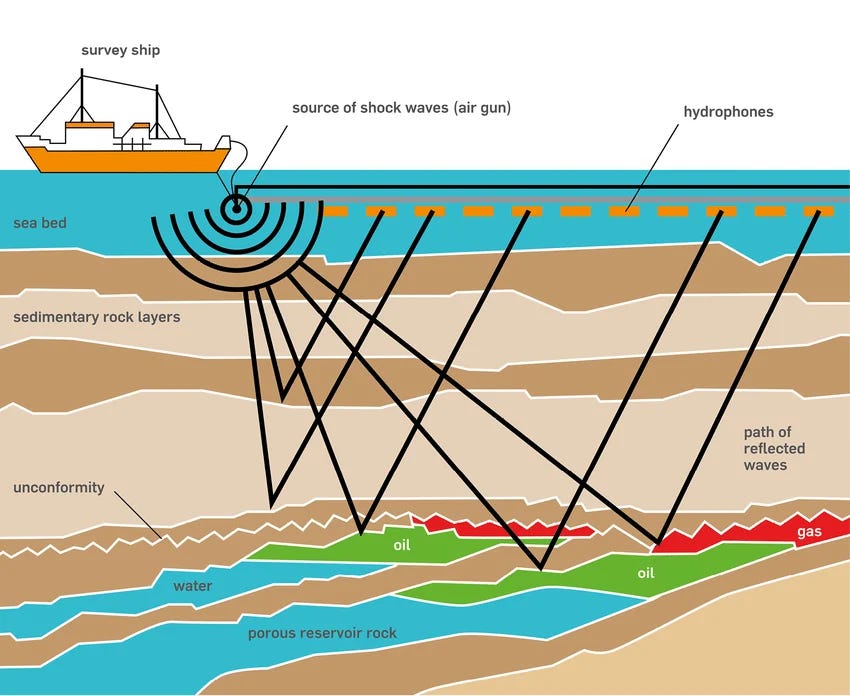
2D seismic shoots a single line and gives you a vertical slice through the earth. Imagine a CT scan that’s only one slice thick. Useful for regional reconnaissance, useless for capital deployment on an individual well with confidence. This was the workhorse from roughly the 1930s through the 1970s.
3D seismic shoots a dense grid of lines and processes them into a true volume. You can take any slice you want, in any direction, after the fact. The first 3D test was at Bell Lake field in New Mexico in 1972; the first commercial 3D datasets came in the late 1970s, and the technique became dominant through the 1980s and 1990s. 3D seismic is probably the single largest reason exploration success rates went up.
4D seismic is 3D shot repeatedly over time. By comparing surveys taken five years apart, you can watch the reservoir drain. You see where the oil is being replaced by water or where pressure is dropping. It’s more of a production tool than exploration tool, but demonstrates the incredible technological advancements that the oil and gas industry deploy, regularly.
Layered on top of all of that is processing, which is where most of the modern progress actually lives. Pre-stack depth migration, full waveform inversion, and increasingly machine learning models trained on millions of well-and-seismic pairs let geophysicists extract signal that simply wasn’t visible twenty years ago. The data acquired in the 1990s is routinely reprocessed today and yields new prospects, which is why “old basin, new look” is a common pitch in exploration meetings.
Modern exploration has evolved from “drill where the geologist’s gut says (although this still happens). It’s now a highly sophisticated stack of probabilistic models: petroleum systems modeling, seismic interpretation, well log analysis, basin analogs. These, in concert, produce a chance-of-success estimate (often called Pg, geologic probability) and a range of possible outcomes if it works. You drill when the expected value pencils out. You also drill a lot of dry holes anyway, because the models are wrong.
It’s important to note that this technological advancement is something you’ll read about over and over again in this series. The oil and gas industry is one of, if not the, best example of technology innovation in practice. The value of oil and gas as a global commodity drives innovation at a scope and scale not seen in other industries.
Industry Diversification
Exploration is a stack of specialized roles distributed across a few different kinds of companies, and the climate-relevant story is largely about who’s holding which part of the stack.
Four buckets of company operate upstream:
National oil companies (NOCs) Saudi Aramco, ADNOC, QatarEnergy, Petrobras, CNPC, Sinopec, Pemex, Rosneft, Equinor (technically a hybrid). State-owned or majority-state-controlled. They produce roughly 55% of global oil and gas and control well over half of reserves. NOCs explore in their home countries with privileged access. Outside the US, privately owned rights to the subsurface are rare, and countries are not interested in giving up those rights to anyone.
International oil companies (IOCs), aka the supermajors. ExxonMobil, Shell, Chevron, BP, TotalEnergies, Eni, ConocoPhillips. Publicly traded, integrated companies operating in dozens of countries. Not the biggest players by production, they’re a minority of the global pie, but the biggest exporters of capital and technology, and the most exposed to the public market. They are what most people picture when they think of “the oil industry.”
Independents EOG Resources, Devon, Diamondback, Occidental Petroleum, Continental Resources, Hess (now part of Chevron), Pioneer (now part of Exxon), Murphy, Apache. Focused narrowly on exploration and production. They don’t have refineries, gas stations or chemical plants. Most are US-focused. Most are now shale-focused, which is a meaningfully different business than conventional exploration in ways I’ll cover in the next post. The independent space has consolidated dramatically over the last three years; ExxonMobil’s ~$60B Pioneer acquisition and Chevron’s $53B Hess deal are the headlines, but there have been dozens of smaller mergers.
Oilfield services SLB (formerly Schlumberger), Halliburton, Baker Hughes, Weatherford. They don’t own the oil. They own the technology and the people who acquire seismic, drill the wells, and frack the rock. There’s also a tier of seismic specialists, CGG, TGS, PGS, Shearwater, who acquire and process the actual data. When a super major “explores” a frontier basin, what’s really happening is that they are likely paying SLB or CGG to do the survey, hiring an experienced rig contractor like Transocean or Valaris to drill the well, and using its own geoscientists to interpret the result. The technical capability is mostly distributed across the service ecosystem, which is a big part of why frontier exploration is feasible at all and why no operator is fully self-contained.
Supermajors vs independents, in practice
Something I hope you take home from this series is the differentiation within the oil and gas industry. One of the most stark is the super majors vs independents.
Supermajors fund long-cycle, capital-intensive, frontier exploration. Deepwater Brazil. The Guyana-Suriname basin. The eastern Mediterranean. Mozambique LNG. They have the balance sheets to drill $80M wildcats and absorb dry holes, the engineering depth to design floating production systems, and the political access to negotiate production sharing agreements with sovereign governments. They also have planning horizons that extend decades. A Guyana FPSO (Floating Production, Storage and Offloading Vessel) Offshore ordered today is producing oil in 2030 and amortizing through 2050.
Independents mostly don’t do this. The post-2010 independent business model is dominated by US shale, where exploration in the traditional sense barely exists. EOG and Diamondback, by and large, aren’t searching for new petroleum systems; they’re delineating well-understood reservoirs and competing on execution, completion design, and breakeven cost. The cycle time is months, not decades. The capital intensity per barrel is lower. That dichotomy has softened in recent years, though, especially post-Pioneer and post-Hess, the US supermajors now run shale portfolios larger than most independents, and the line between integrated major and pure-play E&P is less clean than it was a decade ago.
The two approaches scale differently, fail differently, and have very different climate implications. A supermajor’s exploration decisions get locked in for decades and are hard to reverse. Once you’ve sanctioned an FPSO, you’re producing for thirty years, almost regardless of what happens to oil prices. An independent’s decisions get made and remade every quarter.
The Cost of Exploration
The exploration cost stack is multivariate, unsurprisingly.
Acquiring the data A modern 3D seismic survey runs anywhere from $30,000 to $100,000 per square kilometer onshore, more offshore. Marine seismic vessels run upwards of $200,000 per day. A regional 2D campaign for a frontier basin might cost a few million; a 3D survey covering a single offshore prospect can run $50–100M before a single well is drilled.
Acquiring the acreage Governments lease exploration rights, and in attractive basins, the upfront signing bonuses are enormous. Brazil’s pre-salt Buzios field auctioned for an R$68 billion (~$17B) signing bonus in 2019. Mexico, Guyana, the US Gulf of Mexico, and Canada all run lease auctions where attractive blocks routinely fetch tens of millions to hundreds of millions of dollars. A company can spend $500M on an acreage position before knowing whether any oil exists.
Drilling An onshore conventional vertical well in Texas might cost $1–3M. A horizontal shale well in the Permian, fully completed, runs $7–10M. An offshore well in shallow water might be $20–40M. A deepwater exploration well in the Gulf of Mexico, Brazil pre-salt, or West Africa costs $30–150M, with rig day rates of $300,000–500,000 driving most of the variance. Drillship contracts sign for hundreds of millions of dollars over multi-year terms.
Dry holes The bain of every geologist. Even with modern probabilistic models, frontier exploration success rates run roughly 20–30%, and commercial success rates for true frontier basin tests can drop into single digits. That means most exploration capital, by definition, produces nothing. A supermajor running a $1B annual exploration budget across, say, fifteen wells is implicitly assuming most of those will be dry. The discoveries that do work have to pay for the dry holes plus everyone’s salaries plus the cost of capital, which is why successful exploration prospects have to be very, very large to be worth pursuing. It’s not that different from a venture capital model.
The aggregate numbers: total upstream capex globally was around $580B in 2024, well above the 2015–2019 average. Pure exploration capex, the early-stage stuff, before any field is sanctioned, is a smaller subset, roughly $26B over a recent 12-month period per Rystad, with Equinor, Shell, and BP among the biggest spenders. Saudi Aramco’s 2024 capex was roughly $50B alone; Petrobras has committed $102B over 2024–2028, most of it upstream. ExxonMobil’s annual capex runs $27–29B in 2025.
The climate-relevant takeaway is that exploration spending is the leading indicator of upstream supply ten to twenty years out. The European supermajors are pulling back. BP cut annual capex to $13–15B through 2027, $1–3B below 2024, while TotalEnergies announced a $7.5B savings program for 2026–2030, and combined capex across the six largest majors in 2025 remains below 2019 pre-pandemic levels. That constrains the supply side of the 2035–2045 oil market. When NOCs and select US-listed peers pick up the slack, which they are, production gets reallocated toward operators with different incentives, different transparency, and different climate exposure. Whether that net move is positive or negative for emissions is genuinely contested.
Reserves vs Resources
You will often read headlines like “the world has 1.57 trillion barrels of proved reserves.”
What does that mean? Well, it’s a heavily filtered subset. The full hierarchy looks like this, drawing from the SPE’s Petroleum Resources Management System (PRMS), which is the global standard:
Prospective resources undiscovered. The geologist thinks oil is probably there based on the petroleum system, but no one has drilled a well to confirm it. Risked by Pg.
Contingent resources discovered, but not yet commercial. You drilled, you found hydrocarbons, but something is in the way of producing them: maybe the price is too low, maybe there’s no pipeline, maybe the technology isn’t ready, maybe the government won’t issue a permit.
Reserves: discovered commercial, and recoverable with current technology under current economic conditions. This is the only category that goes on the balance sheet.
Reserves themselves get sliced three ways based on confidence:
1P (proved): at least 90% probability of recovering this much or more.
2P (proved + probable): at least 50% probability. The industry’s “best estimate.”
3P (proved + probable + possible): at least 10% probability. The optimistic case.
US-listed companies report 1P reserves to the SEC under specific rules (the SEC requires the unweighted arithmetic average of first-day-of-the-month prices over the prior 12 months, among other things). European and most international companies report 2P. This means a direct comparison of “reserves” between Exxon (1P) and Shell (2P) is not actually apples to apples, which is the kind of thing that matters when you’re trying to understand industry trajectories.
A few implications.
First, “reserves” are an economic concept. When prices crash, reserves shrink even though the rocks haven’t moved. When prices rise, reserves grow. The 2014–2016 oil price collapse vaporized hundreds of millions of barrels of reserves on company balance sheets without removing a single molecule from the ground. Same in reverse during 2022 and with the US-Israeli war in Iran.
Second, the gap between reserves and resources is enormous. Total recoverable resources (including contingent and prospective) are several times larger than booked reserves. The “carbon budget vs. fossil fuel reserves” math that gets cited in climate writing usually uses reserves, which is the conservative number. Resources are larger. Resources in place (without recovery factor applied) are larger still.
Third, the bottleneck for climate-relevant supply restrictions is rarely the resource. It’s the capital. A reserve doesn’t become production until someone writes a multi-billion-dollar check to develop it, and those checks get written based on expected long-run prices, regulatory environment, and access.
Climate implications
Pulling it all together, the five things from this post most likely to matter for climate work:
Reserves are an economic concept, not a geological one. They expand and contract with price, technology, and policy. The “X gigatons of locked-in carbon in proved reserves” framing common in climate writing treats a snapshot as a fixed quantity when it is not.
Resources are far larger than reserves. Carbon budget math anchored on proved reserves uses the conservative number. Promote even a modest fraction of contingent or prospective resources into reserves, through higher prices, technology, or policy, and the math changes.
Capital is the binding constraint, not geology. Hydrocarbons don’t become emissions until someone writes a development check. That’s why disclosure regimes, investor pressure, and bank lending policies have more leverage on the long-run supply trajectory than drilling bans on already-discovered acreage.
Cutting Western supermajor exploration doesn’t necessarily cut emissions. It reallocates production toward NOCs and US-listed independents with different transparency, different methane intensity, and different responsiveness to climate pressure. The net climate effect depends on who picks up the slack and how cleanly they produce.
Long-cycle and short-cycle operators respond to different levers. A sanctioned FPSO produces for thirty years almost regardless of price. A Permian shale program responds to the strip in real time. Climate strategy that treats “the oil industry” as one homogeneous actor will be ineffective on at least one of them.
What’s next
Next post moves from finding the stuff to actually getting it out of the ground. Conventional vs unconventional. Vertical, deviated, and horizontal wells. Hydraulic fracturing. Decline curves and why every shale well is dying the day it’s drilled, the red queen syndrome. The shale revolution and what made it possible. Some offshore, because deepwater is its own technical universe and worth a section.
Glossary
The shorthand of the oil and gas industry is dense. Definitions for the terms used above:
Acronyms
10-K — Annual report filed by US public companies with the SEC. Contains audited financials, reserves disclosures, and business risk factors.
1P / 2P / 3P — Reserve confidence categories. Proved (≥90% probability of recovery), Proved + Probable (≥50%), Proved + Probable + Possible (≥10%).
boe / Mboe/d — Barrels of oil equivalent. A unit that aggregates oil and gas into a single number based on energy content. Mboe/d means million barrels of oil equivalent per day.
E&P — Exploration and Production. The upstream segment of the oil and gas industry.
ESG — Environmental, Social, Governance. A framework investors use to evaluate non-financial risks.
FPSO — Floating Production, Storage and Offloading vessel. A converted tanker used to produce, process, and store oil from offshore fields, common in deepwater Brazil and West Africa.
IEA — International Energy Agency. Paris-based intergovernmental body that publishes energy data and outlooks.
IOC — International Oil Company. A privately-owned, publicly-traded oil company operating across multiple countries. The supermajors are IOCs.
LNG — Liquefied Natural Gas. Methane cooled to roughly -162°C until it becomes liquid, allowing it to be shipped on tankers rather than pipelined.
NOC — National Oil Company. A state-owned or state-controlled oil company, e.g. Saudi Aramco, Petrobras, CNPC.
Pg — Geologic probability. The estimated chance that a prospect contains hydrocarbons in commercial quantities.
PRMS — Petroleum Resources Management System. The SPE’s framework for classifying oil and gas resources and reserves; the global standard.
PSA — Production Sharing Agreement. A contract structure (especially in NOC jurisdictions) where the host government retains ownership of the resource and the operator recovers costs plus a share of “profit oil.”
SLB — Schlumberger. The largest oilfield services company globally; rebranded from Schlumberger to SLB in 2022.
SPE — Society of Petroleum Engineers. Industry professional organization; publishes the PRMS.
Terms
Acoustic impedance — A rock property (density times sound velocity) that determines how strongly a seismic wave reflects off a layer boundary. Sharp impedance contrasts produce strong reflections.
Anticline — An upward-arching fold in rock layers. The classical hydrocarbon trap: oil migrates upward and pools at the crest under an impermeable seal.
Bright spot — A high-amplitude reflection on a seismic image, sometimes (not always) indicating gas in a reservoir.
Creekology — Informal 19th-century practice of drilling near oily creeks under the assumption that surface seeps indicated subsurface oil. Often worked.
Dry hole — A well that fails to find commercial hydrocarbons.
Fault block — A section of rock displaced by faulting; can form a trap when a permeable reservoir ends up sealed against an impermeable layer across the fault.
Frontier exploration — Drilling in a basin or play with no previous discoveries. High risk, high potential reward; commercial success rates often in single digits.
Geophone / hydrophone — Sensors that detect seismic waves on land (geophone) or in water (hydrophone).
Kerogen — Organic matter in source rocks that, when heated to the right temperatures over geologic time, breaks down into oil and gas.
Oil window / gas window — Temperature ranges (roughly 60–150°C for oil, hotter for gas) in which buried organic matter generates hydrocarbons.
Petroleum system — The combination of source rock, migration pathway, reservoir rock, seal, and trap that makes a producing oil or gas field possible.
Reserves — Discovered, commercial, recoverable quantities of oil and gas. The only category booked on a balance sheet.
Reservoir rock — A porous, permeable rock (typically sandstone or carbonate) that holds hydrocarbons and lets them flow to a wellbore.
Resources — A broader category encompassing prospective (undiscovered), contingent (discovered but not yet commercial), and reserves. Total resources are several times larger than reserves.
Rig day rate — The daily fee a rig contractor charges an operator for use of a drilling rig. Onshore: tens of thousands of dollars. Deepwater drillships: $300,000–500,000+.
Salt dome — A column of salt that has risen up through overlying rock layers due to its lower density, often creating traps along its flanks. Salt’s impermeability also makes it a common seal.
Seal — An impermeable rock layer (often shale or salt) that prevents hydrocarbons from migrating further up.
Seep — Surface expression of subsurface hydrocarbons; oil or gas leaking from the ground.
Source rock — Organic-rich rock (typically a fine-grained shale or marl) that, when buried and heated, generates hydrocarbons.
Stratigraphic trap — A trap formed by changes in rock type or porosity rather than by structural deformation. Examples include ancient reefs and sand pinchouts.
Strip price — The market’s forward price curve for oil derived from futures contracts. Operators use it to make development decisions.
Trap — The geometric configuration that concentrates migrating hydrocarbons in one place. Types include anticlines, fault blocks, salt domes, and stratigraphic.
Wildcat well — An exploration well drilled in an area without proven production. The original cowboy term; still used.
Comments
Nothing yet. Say the first thing.
Sign in to join the conversation.