
Tabular ML is at a crossroads. For a long time, this subfield was dominated by the combination of clever feature engineering with gradient-boosted decision tree methods, with neural networks persistently struggling (Shwartz-Ziv & Armon, 2022). Now, tabular foundation models like TabPFN (Hollmann et al, ICLR 2023) are gaining widespread use. Encoding tables as text, so as to utilize LLMs, is also showing surprising promise (Song & Bahri, TMLR 2025). So it’s useful to reflect on the question: how is tabular data unique?
Before proceeding, it’s also worthwhile to address the question: what is tabular data? According to most internet sources, tabular data is "data arranged in rows and columns". This structurally-based definition is descriptively accurate; it’s what people actually use. For example, this definition allowed (van Breugel & van der Schaar, ICML 2024) to classify foundation model papers by keyword, showing how tabular foundation models are still underaddressed in the literature (see their figure below).
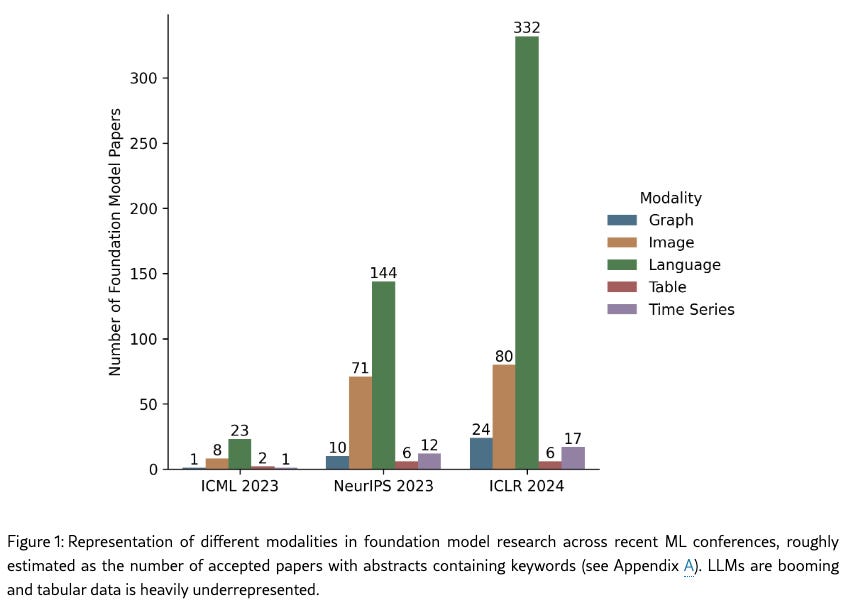
Still, I think this definition is a bit silly because you could arrange ImageNet into rows and columns if you wanted to. So perhaps a better definition would be "any dataset that one would reasonably consider interacting with as a spreadsheet, dataframe, or database table". Another even better definition would be that tabular ML is interested in making predictions on (or in generating) the type of datasets that statisticians would be interested in making inferences on. More generally, I think it’s useful to think about tabular data as data having certain properties amenable to tabular representation. Along these lines, and without further ado, here are 13 stereotypical (but not universal or exclusive) characteristics of tabular data:
Unlike vision and text data, tabular data is not visually inspectable (beyond 2-3 dimensions).
Unlike images (with continuous features) and text (with discrete features), tabular data is often mixed-type.
For images and text, all the features of each live in the same commensurable space. Every pixel in an image is a color; every position in a text sequence contains a token from a shared vocabulary. But in a tabular dataset, one continuous feature might be a length, while another one might be a duration of time; one categorical feature might encode a person’s nationality, while another one might encode that person’s premium account status.
The number of features in a typical tabular dataset will tend to be less than the number of pixels in a typical image datasets, and less than the sequence length of a typical document in a text corpus.
Unlike computer vision data, tabular data tends not to live on a manifold of much lower intrinsic dimensionality than the ambient (nominal) dimensionality.
The combination of (4) and (5) means that data compression is not nearly as relevant. So signal processing transforms and dimensionality reduction methods like PCA rarely automatically extract meaningful latent variables.
Whereas image and text features are meaningfully arranged (spatially and sequentially, respectively). Furthermore, pixels are correlated in color, and image patches and text tokens are correlated in terms of semantic meaning. Meanwhile, tabular features are rarely ordered in any meaningful way.
Tabular categorical features are often imbalanced, and tabular continuous features are often highly-skewed. Text is similarly imbalanced, with word frequencies following Zipf’s Law. But the distribution of RGB values in images tends to be nicely behaved for most types of image data.
Tabular data is not very “forgiving”. A small change in an important continuous feature can be incredibly meaningful. Images are the opposite, where small perturbations are rarely perceptible, and thus not meaningful. Text is somewhere in between: there are interchangeable synonyms, but mispredicting an antonym will completely change the meaning of a sentence.
Missingness is a major problem for tabular data. Not only is missingness common, but sometimes the missing features are the expensive-yet-valuable ones. And sometimes the missingness pattern is not random (i.e. is itself meaningful).
Combining tabular datasets is hard. There are synergies from combining Wikipedia and eHow articles: the sets of facts they contain are quite different, yet there is some factual overlap, and there is lexical, semantic, and syntactical consistency. Similarly, there are clear synergies from combining datasets of Google Streetview images and social media images. And for both text and images, you can simply concatenate the datasets. Combining tabular datasets is hard due to differing sets of features, and there aren’t obvious synergies (especially without encoding the names and representing the meanings of columns and rows).
Image and text data are mostly found, while tabular datasets are mostly constructed. The fact that tabular datasets are constructed to include features which are plausibly related to the prediction task, is part of why they are less compressible: most of the features tend to be useful for ML modeling rather than irrelevant or redundant. On the other hand, the fact that tabular datasets are constructed means that they are the outcome of a process. Changes to the process are possible, so changes to the distribution and even meaning of features are also possible. This is not the case for photos and text, but is common for biological datasets (including biological imaging), where assay changes lead to batch effects.
Tabular datasets often have high irreducible error. For LLMs, even on extremely hard problems like writing IMO math proofs, it is plausible (though a very difficult ongoing research question) to get the LLMs to work perfectly. But for even "simple" tabular classification problems, the different classes overlap so much in distribution that (without adding new features or improving one's measurement process) perfect accuracy is impossible.
Thanks to Eric Kernfeld for reading a draft.
No posts
Comments
Nothing yet. Say the first thing.
Sign in to join the conversation.