
The Census Bureau reports New Home Sales in June were at a seasonally adjusted annual rate (SAAR) of 628 thousand. The previous three months were revised up, combined.
This was above the consensus forecast of 610 thousand SAAR.
Sales of new single-family houses in June 2026 were at a seasonally-adjusted annual rate of 628,000, according to estimates released jointly today by the U.S. Census Bureau and the Department of Housing and Urban Development. This is 1.6 percent above the May 2026 rate of 618,000, and is 5.6 percent below the June 2025 rate of 665,000.
emphasis added
The first graph shows New Home Sales vs. recessions since 1963. The dashed line is the current sales rate.
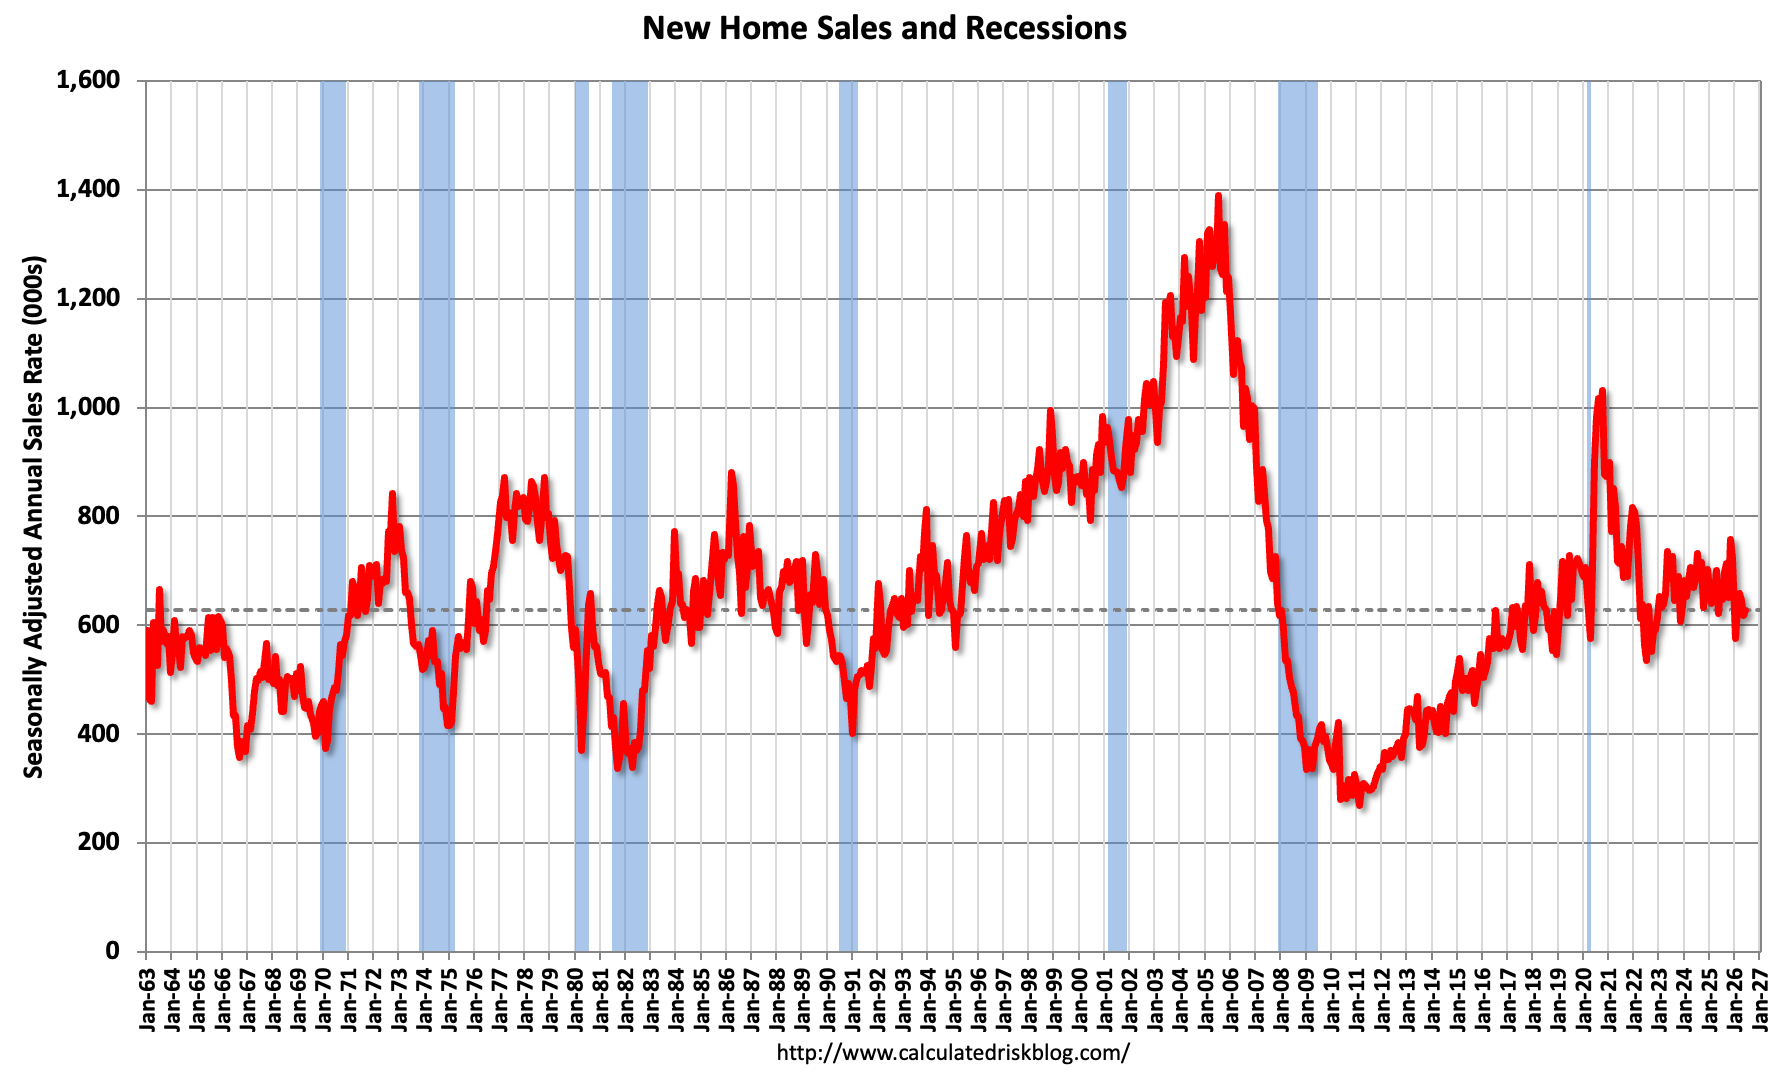
New home sales were below pre-pandemic levels. The second graph shows New Home Months of Supply.
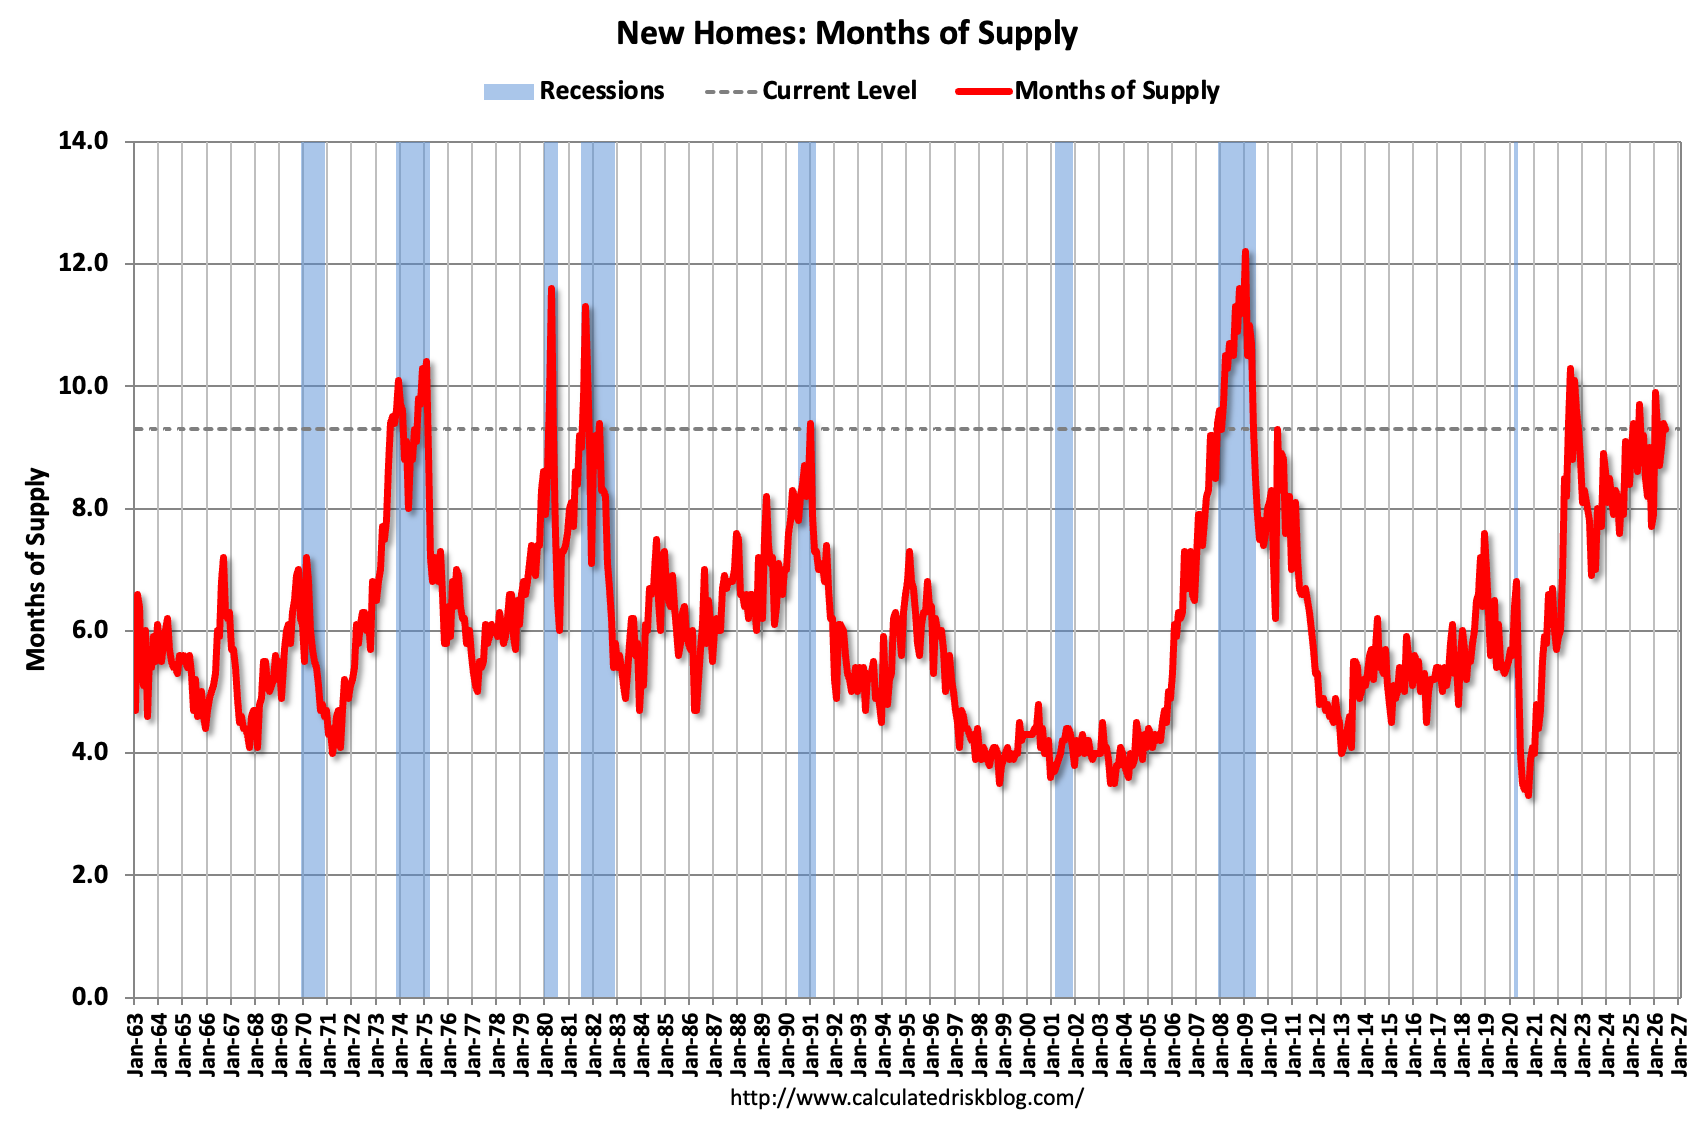
The months of supply decreased in June to 9.3 months from 9.4 months in May. The all-time record high was 12.2 months of supply in January 2009. The all-time record low was 3.3 months in August 2020. This is well above the top of the normal range (about 4 to 6 months of supply is normal).
The seasonally-adjusted estimate of new houses for sale at the end of June 2026 was 485,000. This is 0.2 percent below the May 2026 estimate of 486,000, and is 3.2 percent below the June 2025 estimate of 501,000.
This represents a supply of 9.3 months at the current sales rate. The months’ supply is 1.1 percent below the May 2026 estimate of 9.4 months, and is 3.3 percent above the June 2025 estimate of 9.0 months.
On inventory, according to the Census Bureau:
"A house is considered for sale when a permit to build has been issued in permit-issuing places or work has begun on the footings or foundation in nonpermit areas and a sales contract has not been signed nor a deposit accepted."
Starting in 1973 the Census Bureau broke this down into three categories: Not Started, Under Construction, and Completed. The third graph shows the three categories of inventory starting in 1973.
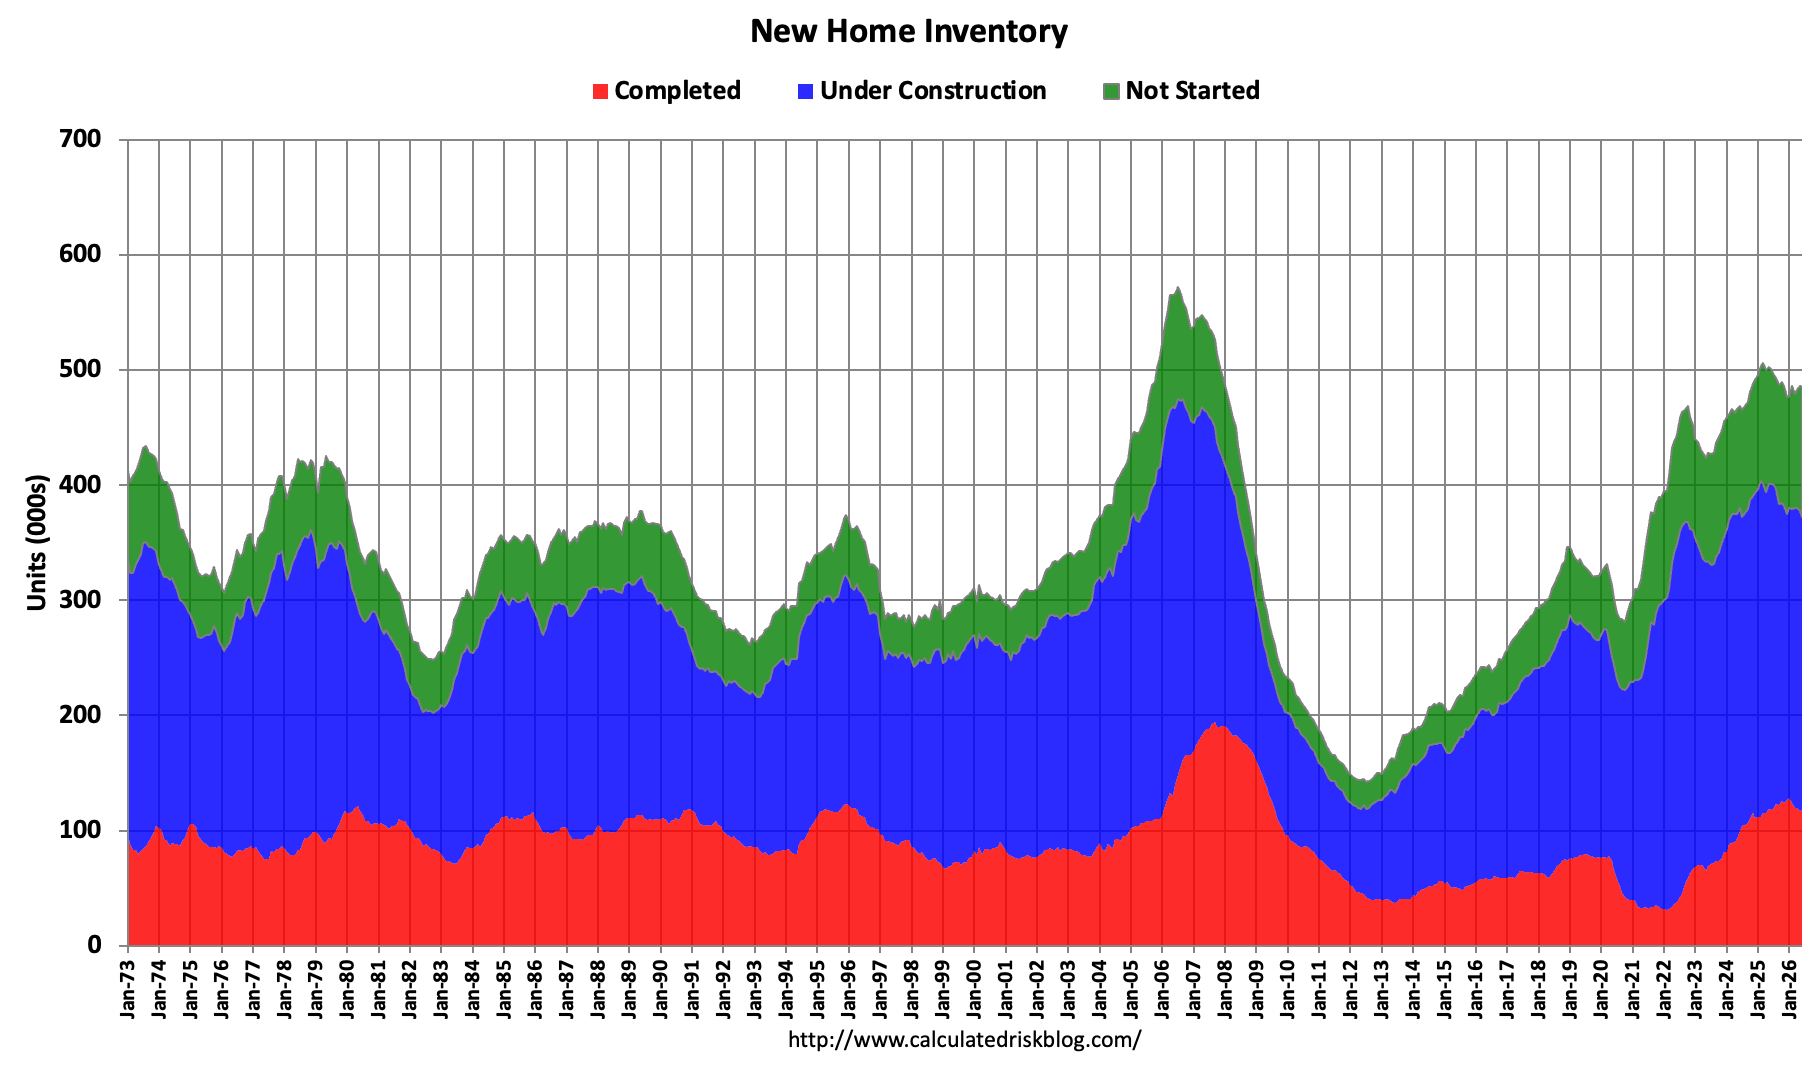
The inventory of completed homes for sale (red) - at 118 thousand - is almost quadruple the record low of 31 thousand in February 2022. This is close to the recent peak of 128 in January 2026, and well above the normal level of completed homes for sale.
The inventory of homes under construction (blue) at 252 thousand is high but is 21% below the cycle peak. The inventory of homes “not started” is at 113 thousand and is at an all-time high.
The fourth graph shows new home sales for each month, Not Seasonally Adjusted (NSA), for a few selected periods. Black is the maximum sales per month during the bubble (2005) and light gray is the minimum sales during the bust (2008 - 2011). The most recent seven years are shown (2019 through 2026).
The following content is for paid subscribers only. Thanks to all paid subscribers!
Comments
Nothing yet. Say the first thing.
Sign in to join the conversation.