
From the NAR: NAR Existing-Home Sales Report Shows 1.7% Decrease in July
Month-Over-Month
1.7% decrease in existing-home sales to a seasonally adjusted annual rate of 4.06 million in July.
1.9% decrease in unsold inventory to 1.54 million units, equal to a 4.6-month supply.
Year-Over-Year
0.7% increase in existing-home sales
2.0% increase in median existing-home sales price to $434,100
emphasis added
This graph shows existing home sales, on a Seasonally Adjusted Annual Rate (SAAR) basis since 1994.
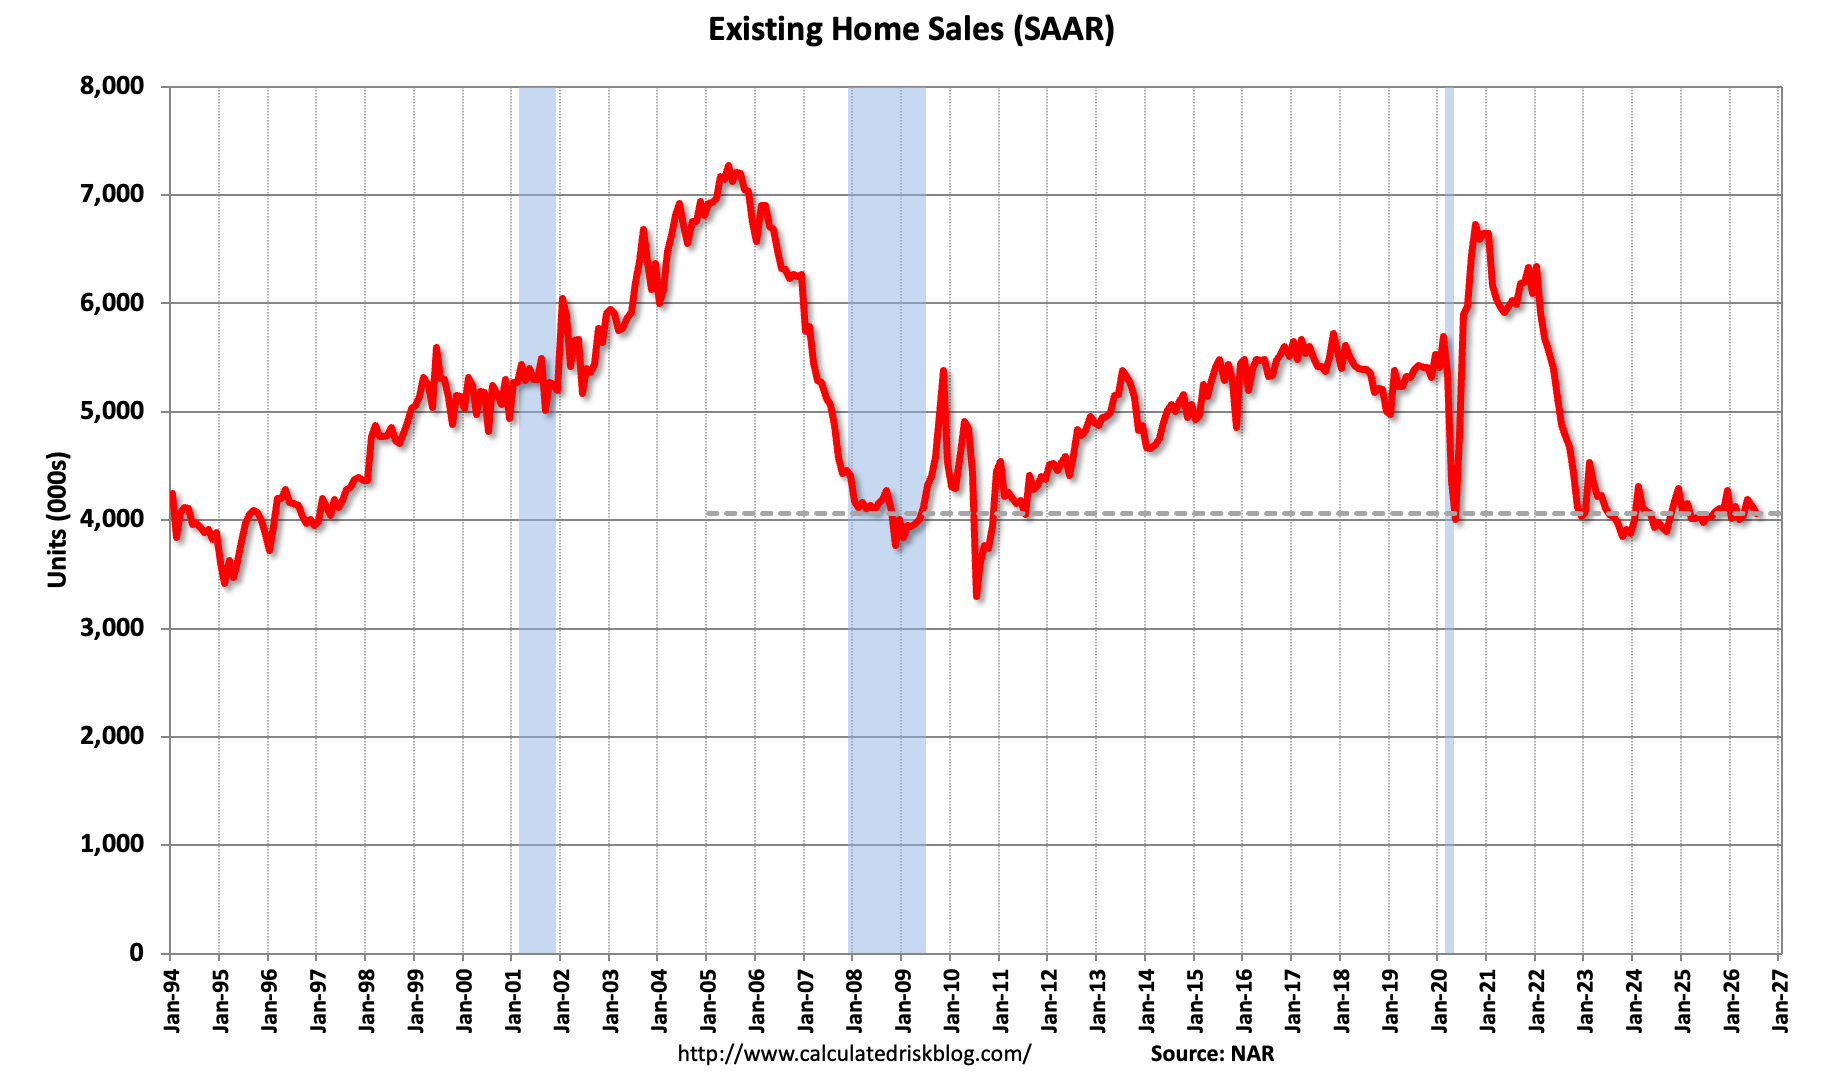
Sales in July (4.06 million SAAR) were down 1.7% from the previous month (June was revised up from 4.09 million SAAR to 4.13 million SAAR) and July sales were up 0.7% compared to the July 2025 sales rate. Sales have been very low for most of the last 4 years.
The second graph shows nationwide inventory for existing homes.
According to the NAR, inventory decreased to 1.54 million in July from an upwardly revised 1.57 million the previous month.
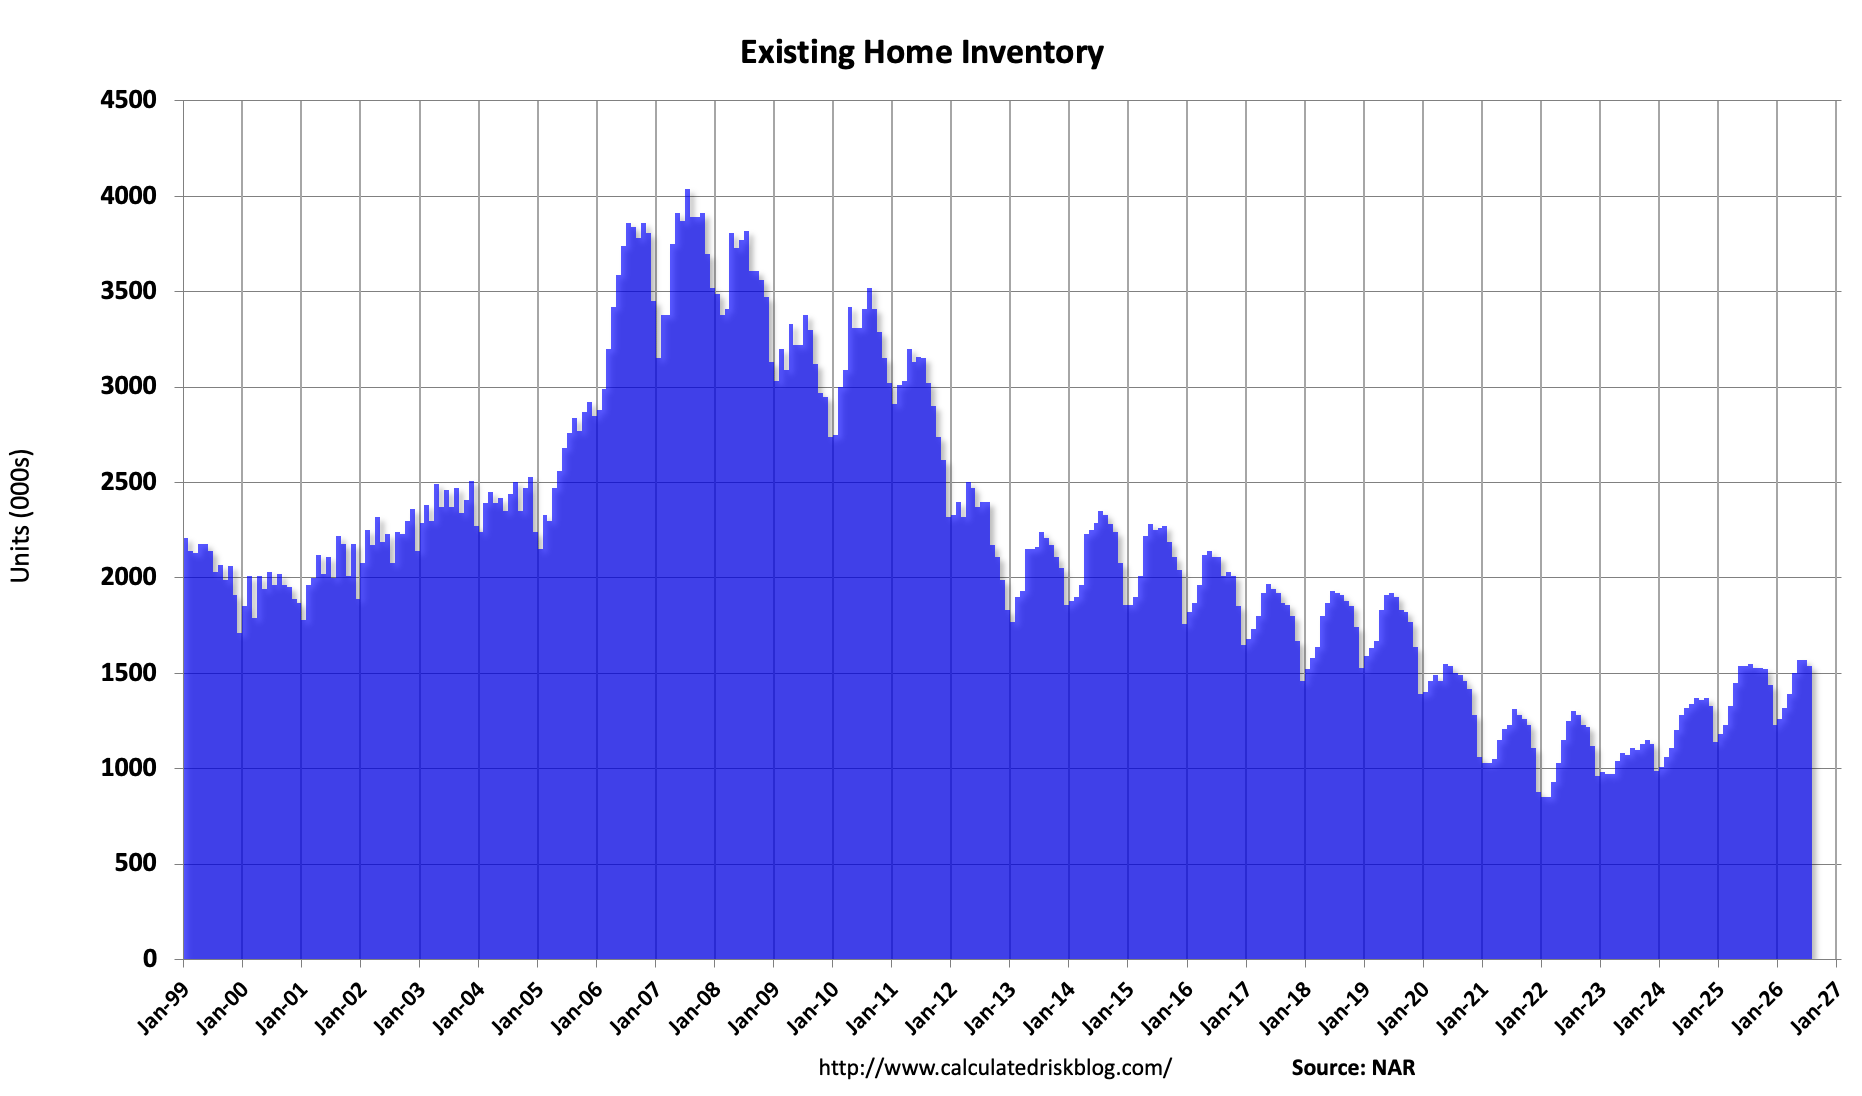
Headline inventory is not seasonally adjusted, and inventory usually decreases to the seasonal lows in December and January, and peaks in mid-to-late summer. The third graph shows the year-over-year (YoY) change in reported existing home inventory and months-of-supply. Since inventory is not seasonally adjusted, it really helps to look at the YoY change. Note: Months-of-supply is based on the seasonally adjusted sales and not seasonally adjusted inventory.
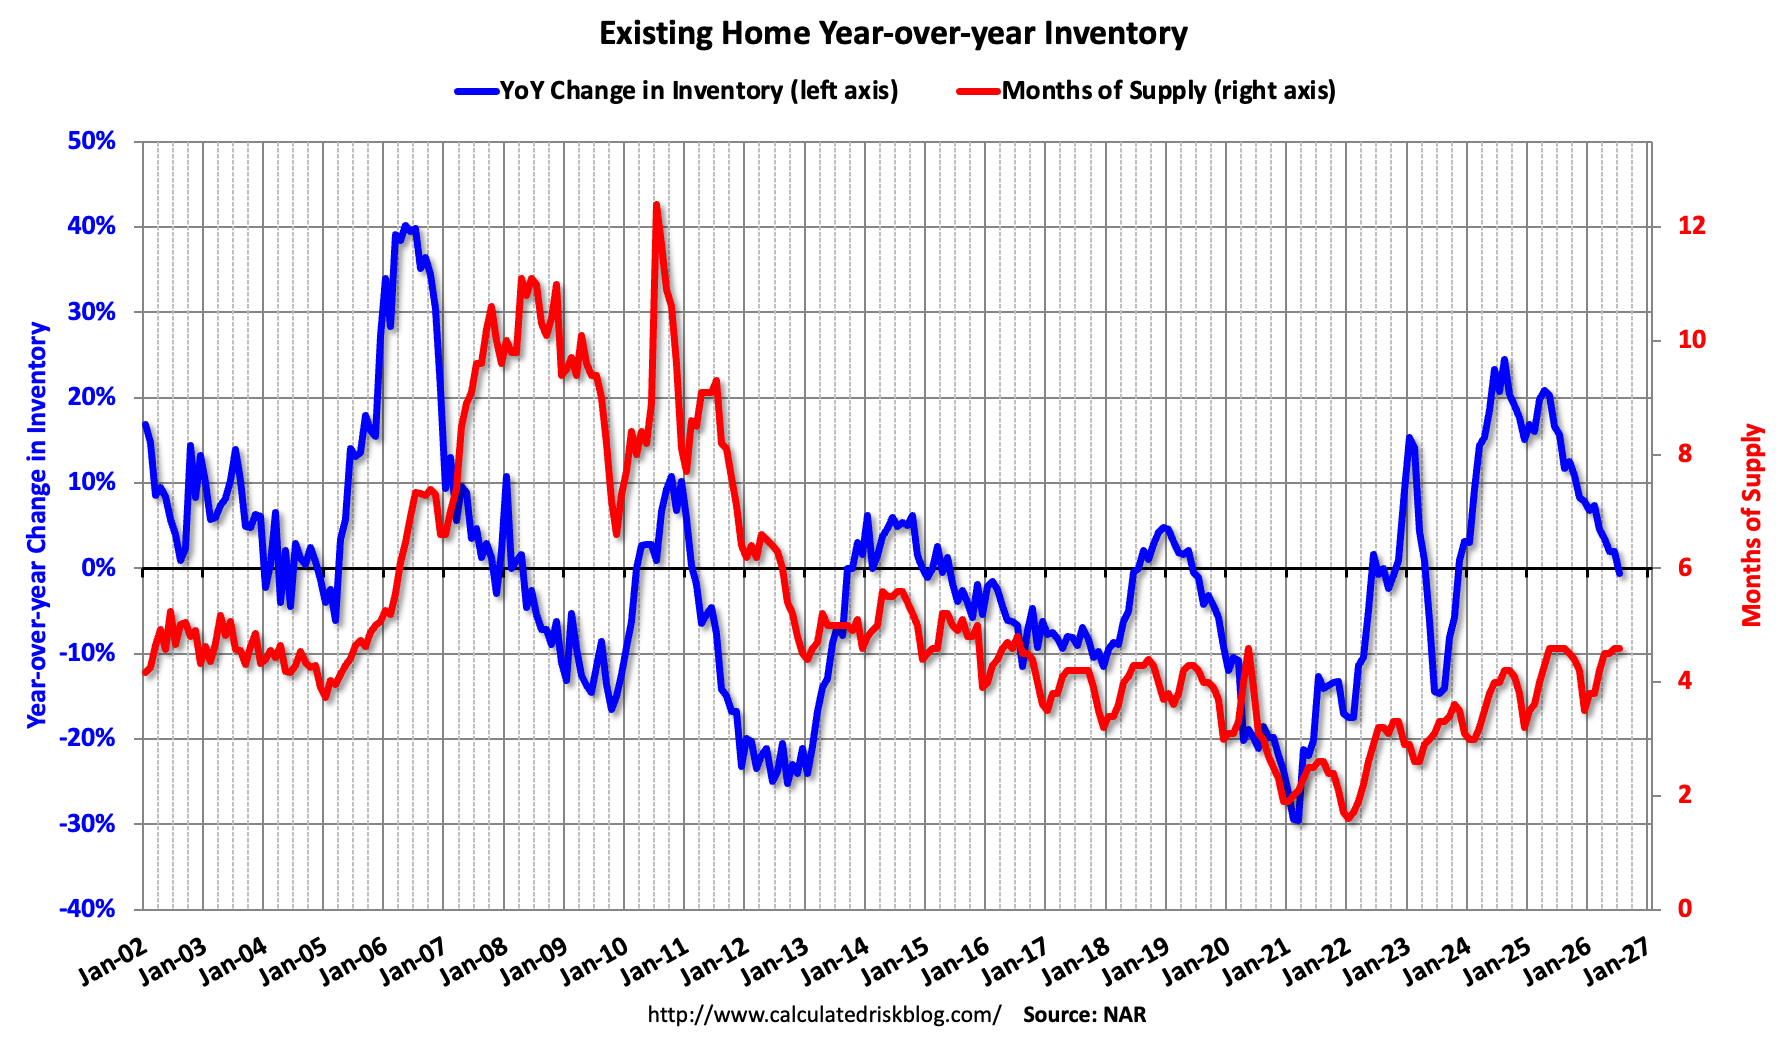
Inventory was down 0.6% year-over-year (blue) in July compared to July 2025. Note that year-over-year inventory has stopped increasing and is now mostly unchanged.
Months of supply (red) was unchanged at 4.6 months in July from 4.6 months the previous month. Looking back to pre-pandemic levels, in June 2019 months-of-supply was at 4.2 months, so there is more supply now, on a months-of-supply basis, than prior to the pandemic! Even though inventory is still down compared to 2019, sales have fallen even more - pushing up months-of-supply.
The fourth graph shows existing home sales by month for 2025 and 2026.
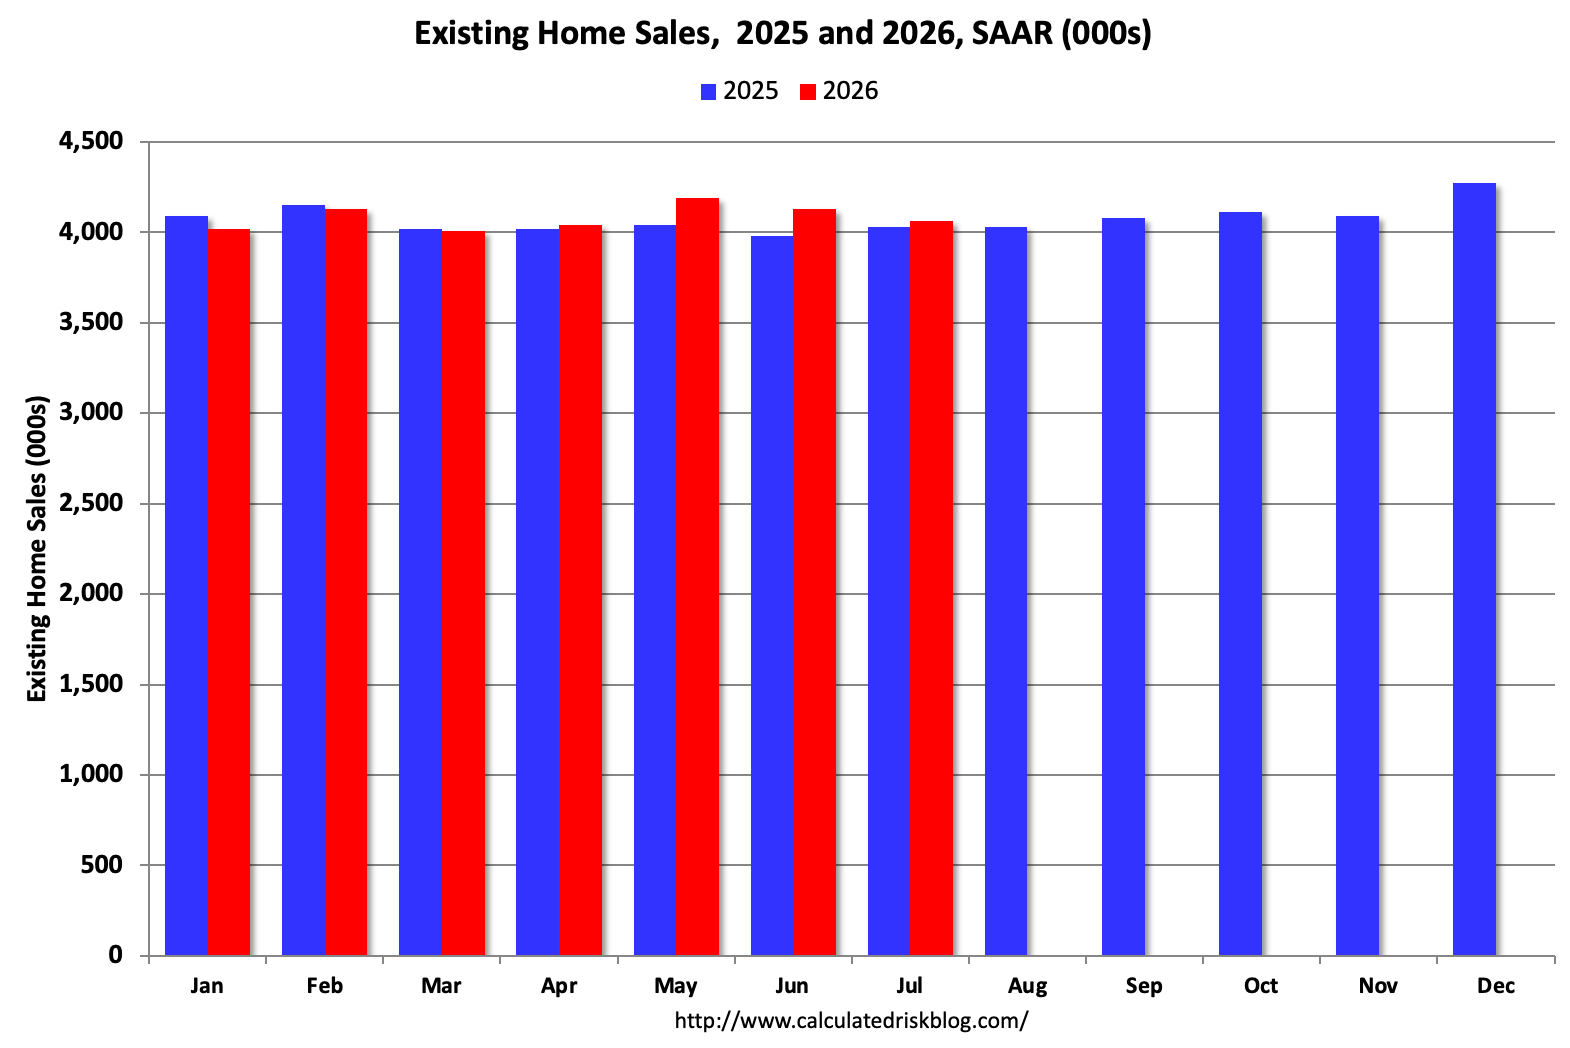
Sales were up year-over-year for the 4th consecutive month in July.
The following content is for paid subscribers only. Thanks to all paid subscribers!
Comments
Nothing yet. Say the first thing.
Sign in to join the conversation.