
Here is the ICE August Mortgage Monitor report (pdf).
Press Release: ICE Mortgage Monitor: Mortgage Holder Equity Climbs to Record $18 Trillion as Annual Home Price Growth Reaches 14-Month High
Intercontinental Exchange, Inc. … today released its August 2026 Mortgage Monitor Report, which found that mortgage holder equity reached $18 trillion for the first time on record while annual home price growth reached a 14-month high in July.
“Mortgage holder equity hitting $18 trillion is a remarkable milestone — one that reflects just how much wealth American homeowners have built,” said Andy Walden, head of mortgage and housing market research at ICE. “The spring market provided a meaningful boost to both prices and equity, and we’re seeing those tailwinds work through the data now. At the same time, rates have trended higher since early in the year, which may soften how much additional acceleration we’re likely to see in the second half.”
Key findings from the August Mortgage Monitor include:
July annual home price growth hits 14-month high
Annual home price growth rose to 1.5% in July, marking its fifth consecutive month of acceleration and its steepest single-month increase since mid-2023. The jump reflects lower rates early in 2026 injecting demand into the market, as weak summer 2025 prices roll out of the comparison window. However, as rates have moved higher, one-month adjusted price gains have softened, suggesting that further acceleration in the second half of the year may be limited.
Equity hits record high; negative equity elevated among recent-vintage borrowers
Mortgage holder equity hit $18 trillion in Q2, a new all-time high, as lower rates earlier in the year supported renewed home price appreciation. Within that total, 47.5 million mortgage holders hold $11.7 trillion in tappable equity, averaging approximately $212,000 per borrower.
Despite the strong overall picture, approximately 813,000 borrowers are underwater — up 44% year-over-year — concentrated among FHA and VA borrowers, those who purchased between 2022 and 2025, and in Texas and Florida where price declines from peak have been most pronounced.
Rate variation among similarly qualified borrowers
Borrowers with nearly identical credit profiles are locking meaningfully different interest rates, averaging a 38-basis-point spread among conforming purchase borrowers in 2026. On a $300,000 mortgage, that difference translates to roughly $76 per month and approximately $5,790 in additional costs over the first five years.
Among FHA and VA borrowers, that spread widens to 47 and 48 basis points respectively, with the widest variation concentrated among borrowers with lower credit scores, smaller loan balances, higher loan-to-value ratios, and those using government-backed loan programs.
Real estate owned (REO) properties are selling at historically wide discounts
Buyers purchasing bank-owned REO properties did so at a 27.5% discount to comparable sales in June — among the largest in over two decades. Notably, the widest discounts relative to their own histories are appearing in markets that typically offer the least: Florida, Texas, California and the Mountain West. However, foreclosure rates and distressed purchase opportunities remain scarce in those areas.
emphasis added
Here is a graph of the national delinquency rate from ICE. Overall delinquencies increased in June seasonally, but remain below the pre-pandemic levels. Source: ICE McDash
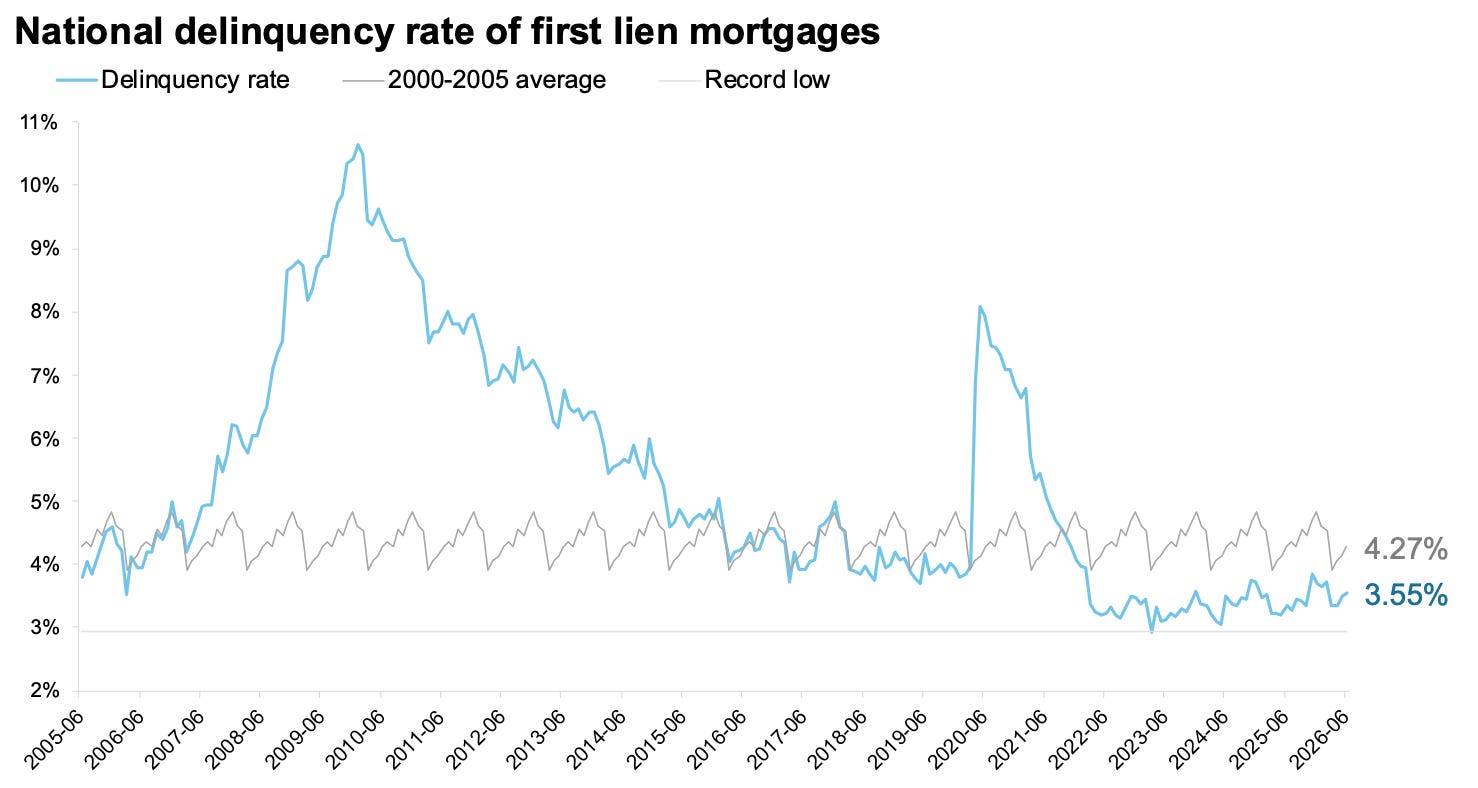
The national delinquency rate rose 5 basis points to 3.55% in June — roughly half the typical seasonal increase — but remains 60 basis points below the pre-pandemic benchmark of 4.16% set in June 2019.
The share of mortgage holders in early-stage delinquency — one or two payments behind — remains 22% below the June 2019 benchmark.
While serious delinquencies dipped seasonally to a six-month low in June, the number of borrowers 90-plus days past due or in active foreclosure is up 189,000 from a year ago, with the share of these borrowers having returned to slightly above pre-pandemic levels.
The bulk of that increase remains concentrated in FHA and VA mortgages.
The share of FHA loans seriously past due, including active foreclosures, stands at 5.7%, up 1.8 percentage points from a year ago, while 2.3% of VA loans are seriously past due, up 0.4 percentage points year over year.
Among portfolio-held and GSE mortgages, the share of borrowers three or more payments past due is flat compared to a
year ago.
Here is the year-over-year in house prices according to the ICE Home Price Index (HPI). The ICE HPI is a repeat sales index. ICE reports the median price change of the repeat sales. The index was up 1.5% year-over-year in mid-July.
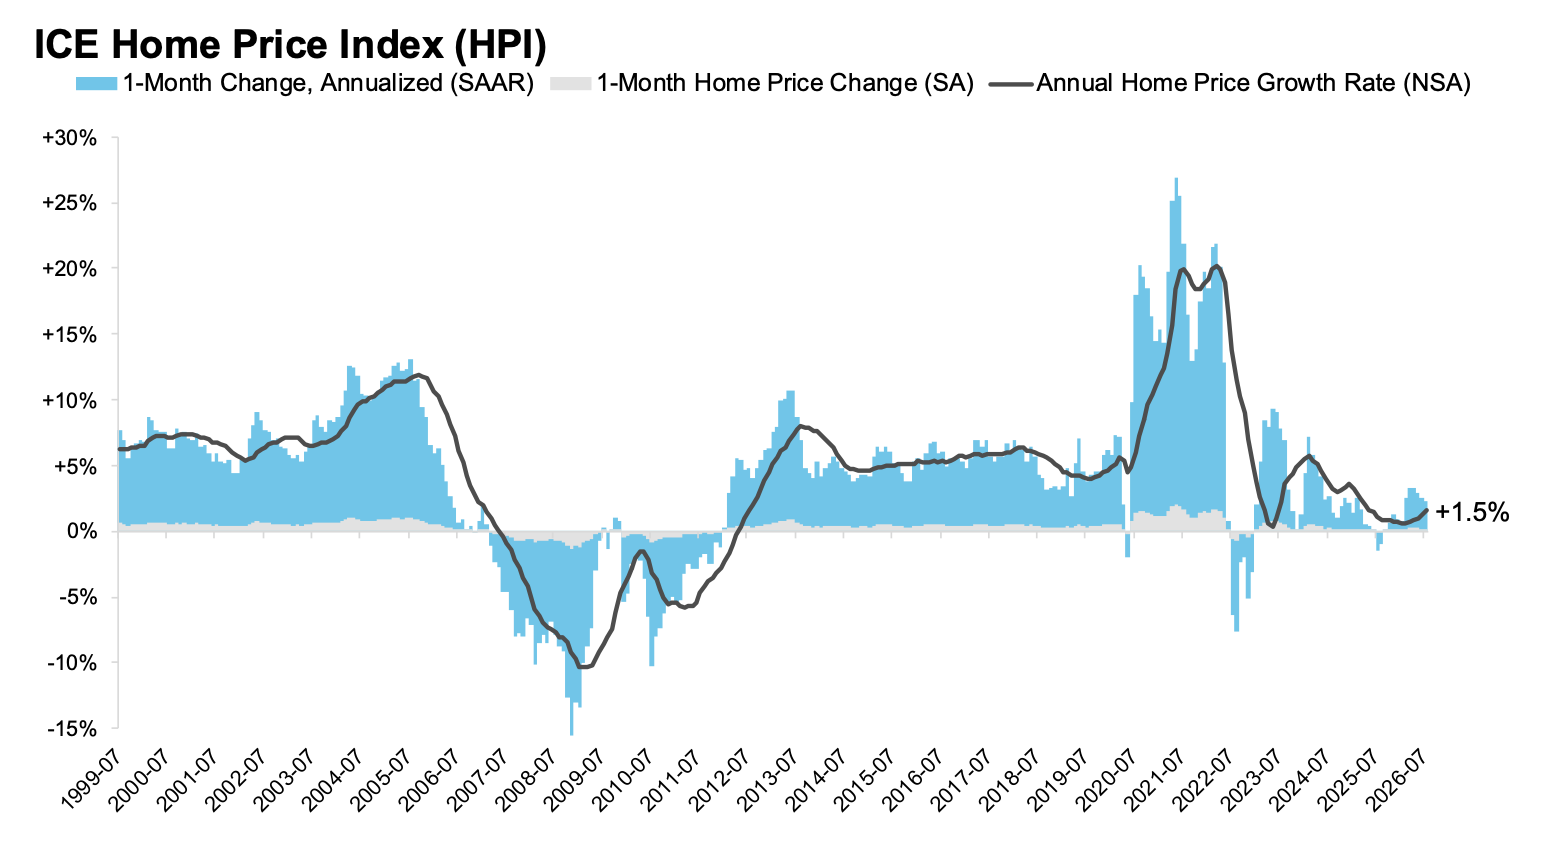
ICE’s July Home Price Index shows annual home price growth accelerating for the fifth consecutive month to 1.5%, marking the largest single-month jump in more than three years and the highest annual growth rate in 14 months.
The July increase was driven by a combination of lower rates in early 2026 pulling demand into the market and a weak summer 2025 rolling out of the 12-month comparison window.
The latest data shows seasonally adjusted monthly price gains beginning to moderate, with prices rising 0.19% in July, down from 0.27% in March and April, as mortgage rates have moved back above 6.5%.
With recent gains still outpacing last summer’s soft market, annual growth is likely to continue accelerating over the next few months — though July’s seasonally adjusted annualized rate of just 2.2% suggests meaningful acceleration is unlikely under current rate, affordability and inventory conditions.
Single-family home prices are up 2.0% year over year while condo prices are down 0.7%, with half of major markets still seeing condo prices below year-ago levels and 97 of the 100 largest markets seeing condos underperform single-family homes.
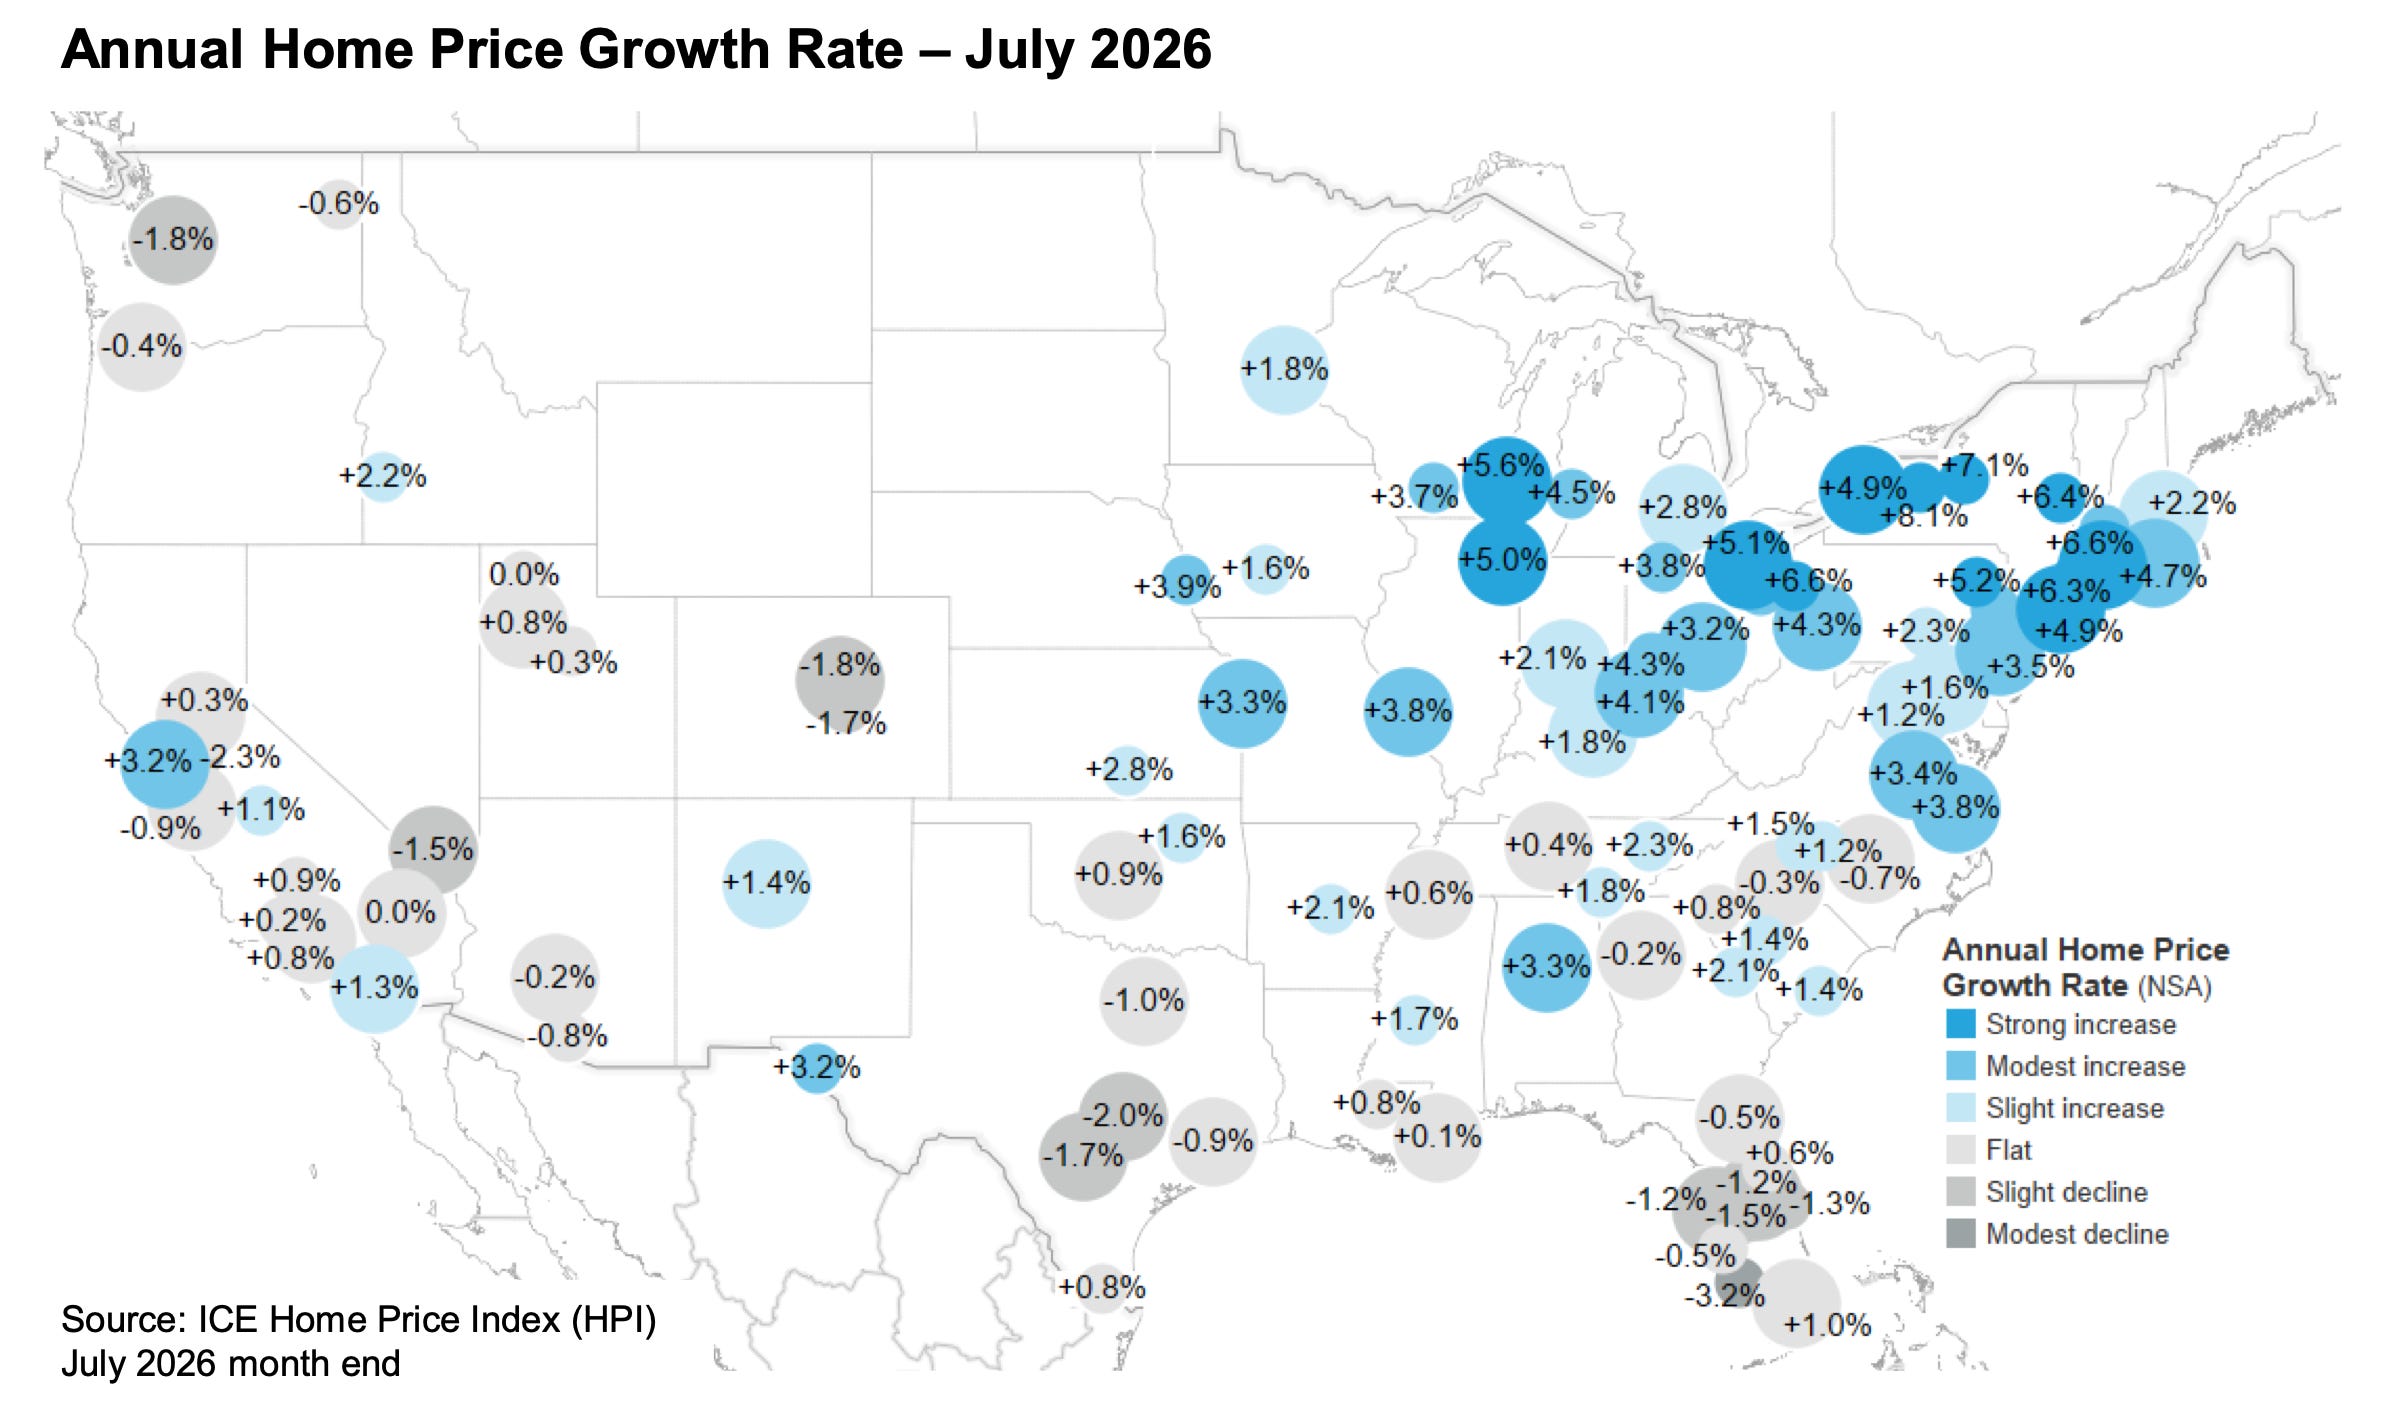
Upstate New York led the country in home price gains in July, with Rochester (8.1%) and Syracuse (7.1%) posting the largest year-over-year gains among major U.S. markets.
Cape Coral, Fla., saw the largest year-over-year decline at 3.2%, followed by Stockton, Calif. (-2.3%) and Austin, Texas (-2.0%).
More than three-quarters of markets saw prices rise from a year ago — the largest share in more than a year — with Rochester’s 8.1% growth rate also marking the strongest reading among major markets in more than a year.
Two-thirds of markets are seeing seasonally adjusted annualized home price growth rates above their trailing 12-month gains, suggesting modest acceleration in annual home price growth may be on the horizon.
The largest gaps between current and trailing growth rates are concentrated in upstate New York and Ohio, suggesting annual price growth may continue to trend higher in those areas.
At the other end of the spectrum, seasonally adjusted gains are running below annual price growth across much of Florida, where many markets continue to see year-over-year declines.
There is much more in the mortgage monitor.
Thanks for reading CalculatedRisk Newsletter! This post is public so feel free to share it.
Comments
Nothing yet. Say the first thing.
Sign in to join the conversation.