

In my last piece, I looked at the economic, demographic, and social conditions that gave rise to the suburban dream in America. For decades after the Second World War, that model of housing growth appeared remarkably stable. Homeownership expanded, subdivisions multiplied, and the detached single-family house became the default aspiration of middle-class life. By most surface-level measures, the system worked.
Americans didn’t suddenly stop wanting space, privacy, or quiet neighborhoods. The Suburban housing model weakened because a system built around one dominant kind of household, one dominant commute pattern, and one dominant economic structure was asked to serve a society that had become much more complex. Between roughly 1980 and 2015, the postwar suburban ideal did not collapse, but the assumptions that had made it feel broadly affordable and stable began to erode.
The economy shifted away from manufacturing and toward services, professional work, and more specialized forms of employment. Women entered the workforce in much larger numbers, making dual-income households increasingly common. Job stability weakened, career paths became less predictable, and wages for many middle-class households no longer rose in step with productivity. At the same time, the built environment remained largely committed to a narrow formula: detached housing, car dependence, and metropolitan growth pushed outward rather than diversified inward. The quietly emerging factors started to change the math on how families made decisions about where they lived.
What followed was the early signs of strain. Housing production slowed relative to population growth. The mix of housing tilted away from smaller, attainable options and toward larger single-family homes, even as household sizes shrank. Commutes grew longer. Congestion worsened. More and more households were effectively trading time, distance, and transportation costs for access to homeownership.
This is what I mean by suburbia breaking at scale. The problem was not simply that suburbs existed but that one dominant model of housing and mobility was expected to serve an increasingly diverse economy and society. For a while, rising incomes, cheap fuel, and expanding credit helped conceal the mismatch. But the mismatch was there.
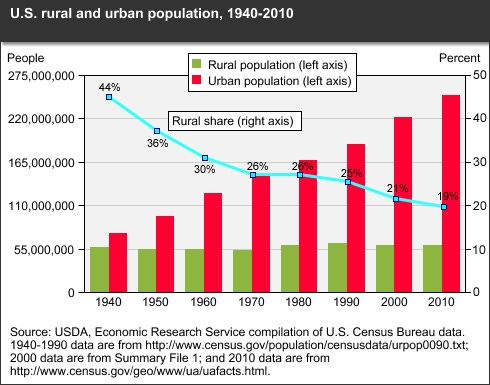
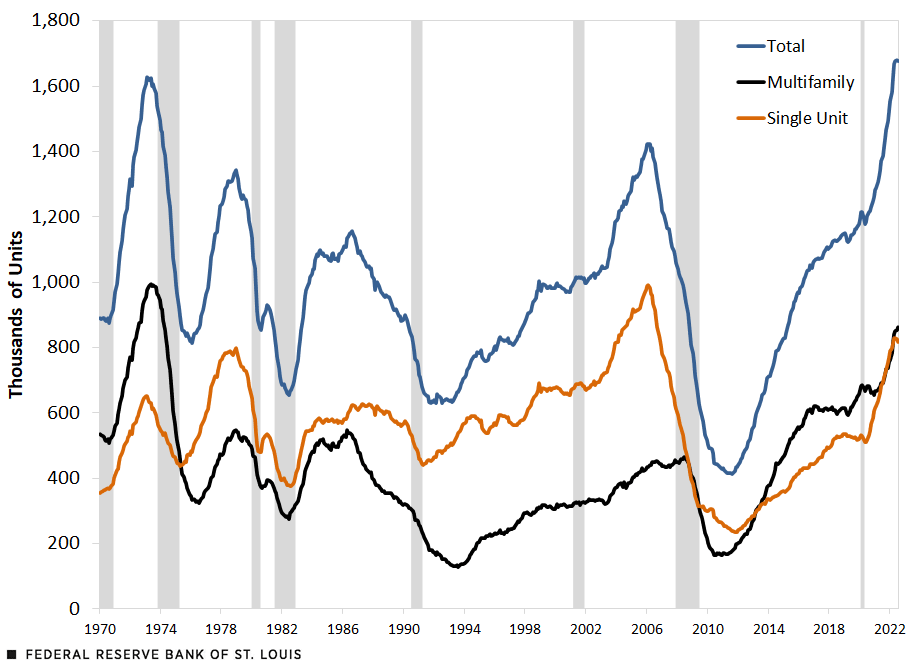
Following World War II, the United States experienced extraordinary population growth. Although that pace began to slow in the 1980s, most new population growth was still absorbed by urban and suburban regions, creating sustained demand for housing. For much of the postwar period, multifamily construction played a major role in meeting that demand. But the composition of housing production changed over time. As the Federal Reserve Bank of St. Louis housing-starts data suggests, economic shocks repeatedly interrupted construction, and the aftermath of the 1970s energy crisis marked an important turning point. Housing starts fell sharply overall, but the more lasting shift was in product mix: single-family homes increasingly became the dominant form of new housing for the next three decades.
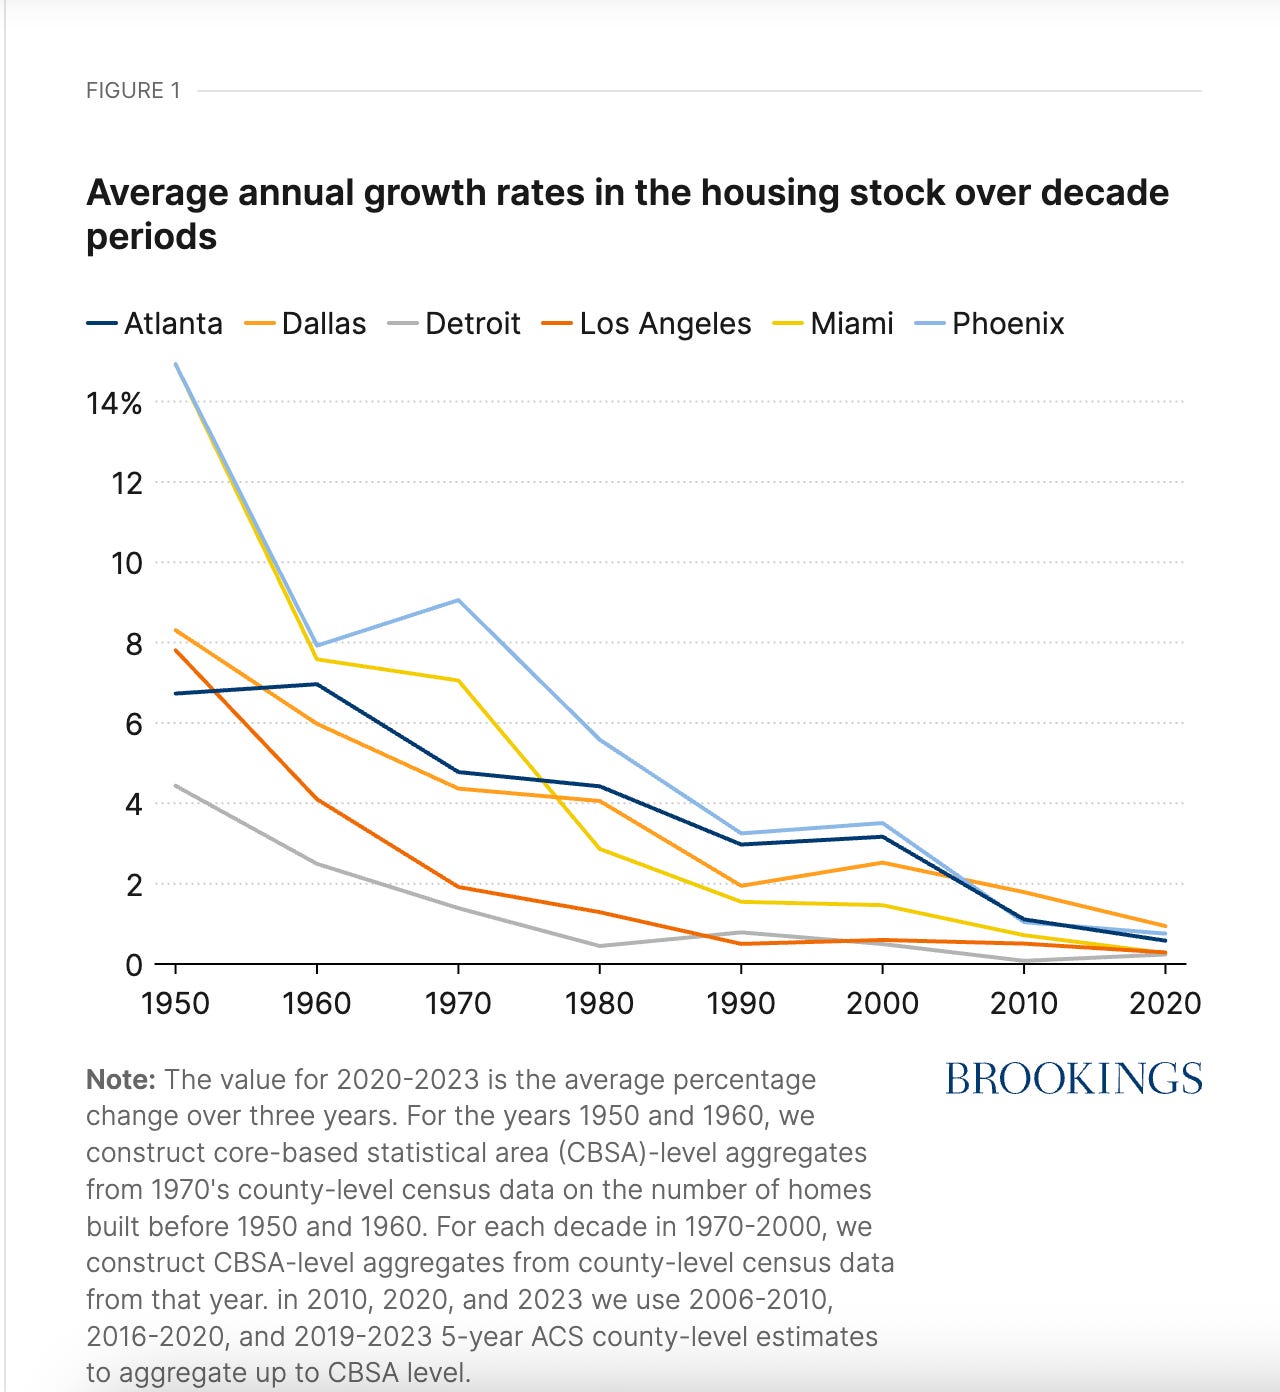
One of the clearest warning signs was that the country stopped building enough housing, and the housing it did build increasingly skewed toward larger products. Nationally, the housing stock had more than doubled from 36 million units in 1950 to more than 86 million by 1980. But the rate of growth slowed considerably after that, falling to around 2% in the 1980s and to just 0.6% in the 2010s. In fast-growing cities, the mismatch became even clearer. In Los Angeles, for example, housing stock grew at a 1.3% rate in the 1980s and then slowed to 0.5% in the 1990s, even as the city added 728,000 residents and grew by 24% between 1980 and 2000. As Brookings researchers argue, this kind of declining supply growth feeds directly into affordability problems. The suburban affordability model could no longer apply to most people when the system was no longer producing enough homes.
At the same time, the composition of new housing changed. Single-family homes increasingly dominated new construction, while multifamily housing became a smaller share of the overall mix for long stretches of time. That shift mattered because multifamily housing has historically served as an important rung on the housing ladder. Smaller apartments, modest rental buildings, and lower-cost ownership options have often provided the entry point for younger households, working families, and new residents.
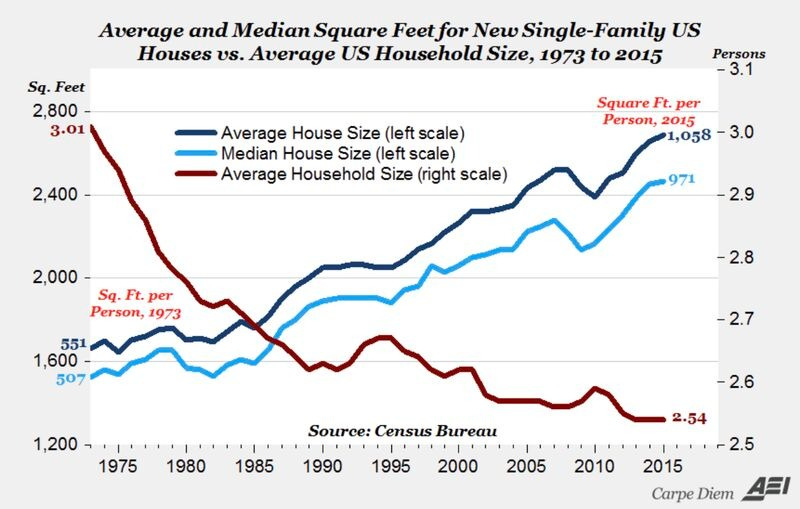
Compounding the slowdown in construction was an overall increase in house sizes. A starter home in the 1960s might have had one bathroom and two or three bedrooms, even when family sizes were much larger than they are today. But beginning in the mid-1980s, median house size per person rose dramatically. Based on analysis from the American Enterprise Institute using Census data, living space per person increased from roughly 500 square feet to more than 1,000 as average household size fell from around 3 people to 2.54.
What makes this especially important is that inflation-adjusted construction costs per square foot did not change nearly as dramatically over the same period. As AEI puts it, “the inflation-adjusted price per square foot for new houses (in 2015 dollars) has been relatively stable since 1973 in a range between about $107 and $128 per square foot at an average of about $116.” In other words, a large part of the affordability problem was not simply that houses became more expensive to build, but that the market increasingly delivered much larger houses as the default product.
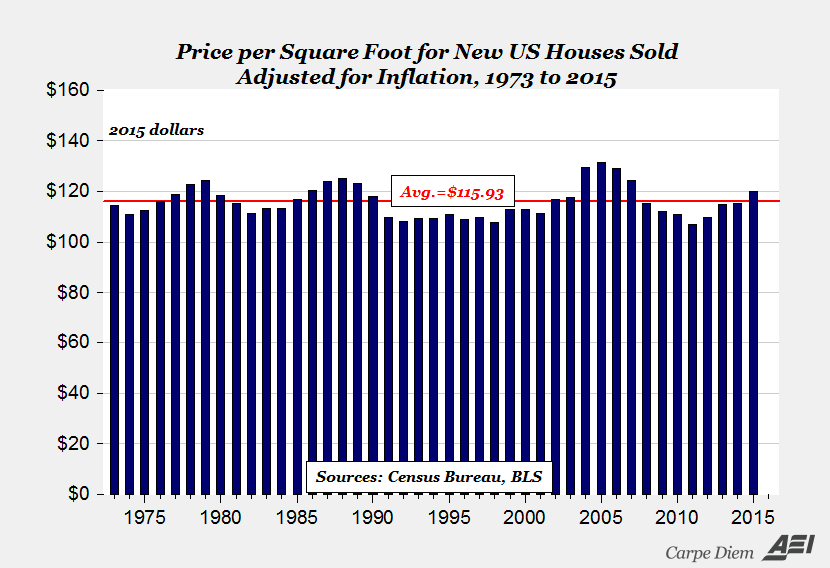
AEI goes further: “when it comes to the new houses that Americans are buying and living in, we see a much brighter picture of life in the US. The new houses that today’s generation of homeowners are buying are larger by 1,000 square feet compared to the average new houses our parents or grandparents might have purchased in the 1970s, and have almost twice the living space per person compared to the new houses built 42 years ago.” That may be true, but it also reveals the problem. Americans did not just stop building enough housing. They also built fewer modest homes, removing an important rung from the housing ladder.
By that logic, when we control for inflation, the floor for buying the average new 1,660 square foot house in 1973 would be far lower than the floor for buying the average 2,467 square foot house in 2015. The country did not just build less. It built bigger. And bigger meant more expensive.
The predictable result of slower construction and larger homes was worsening affordability.
Over time, inflation-adjusted household incomes rose modestly, but housing costs rose much faster. Rents increased substantially. Home prices increased even more. Data from Clever Real Estate shows that nationally, incomes since 1960 rose far more slowly than either rents or home prices, and in many metropolitan areas home values detached sharply from local earnings. This revealed a structural shift in who could realistically enter the market and under what conditions.
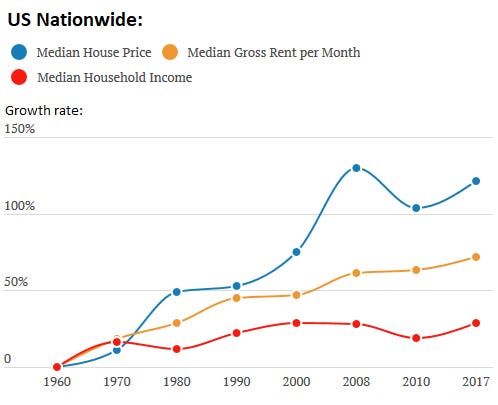
A healthy price-to-income ratio is often understood to be around 2.6, meaning it would take 2.6 years of median household income to purchase the median home. By that standard, many housing markets have not been healthy for a long time. In much of the country, home prices have risen at several times the rate of household income, especially in major metro areas where economic growth has been strong but housing production has not kept pace.
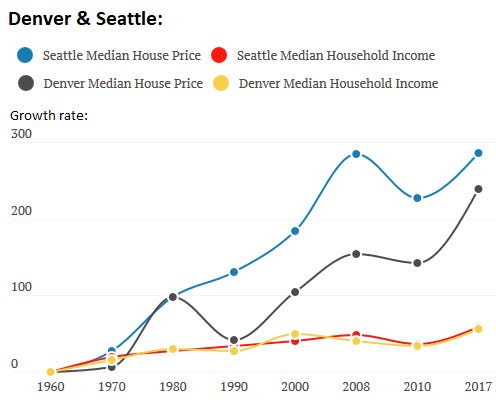
This was especially visible in the West and Northeast, where incomes rose, but house prices rose much faster. Household incomes, adjusted for inflation, rose in near-lockstep 56% since 1960, while house prices in Denver soared 239%, and in Seattle 286%:
In parts of the South, the divergence was less severe for a longer period, which helps explain why the suburban growth model remained more viable there for longer. But nationally, the trend was clear: the broad affordability that had once underwritten the suburban dream was weakening.
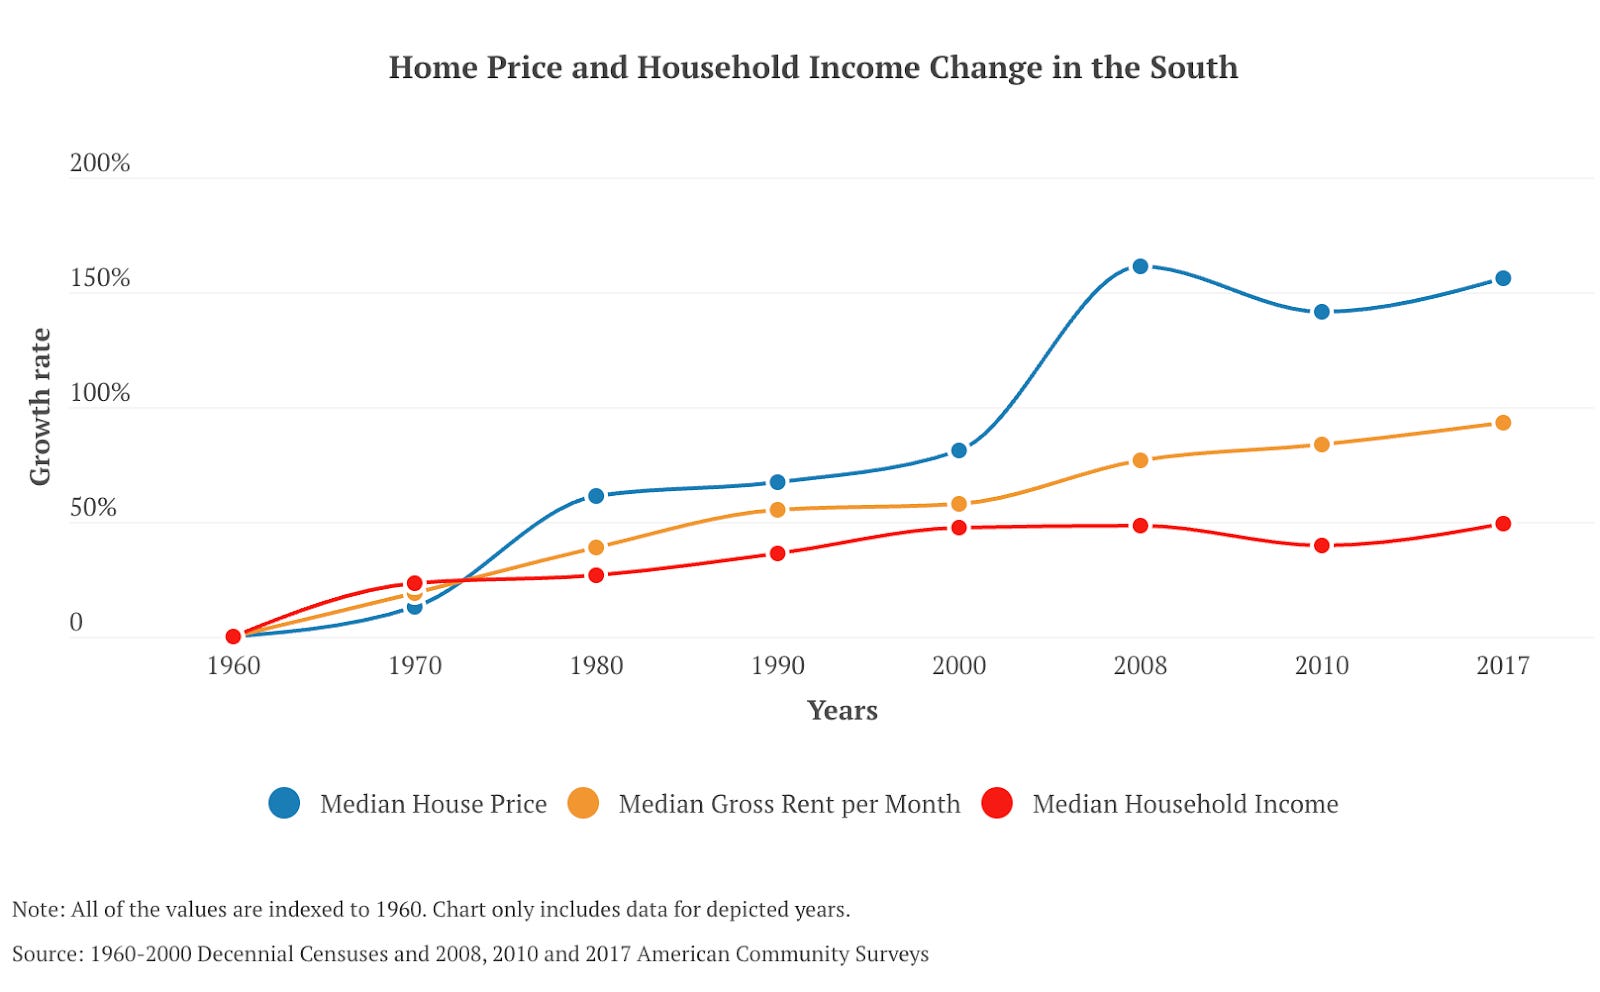
The key point is not simply that housing got expensive but the system that once sold suburban houses as a mass middle-class product became less and less accessible to the middle of the market. That happened through scarcity, through product mix, and through the increasing mismatch between incomes and the cost of entry.
As the cost of housing rose, many households adjusted in the only way available to them: they moved farther out.
In much of the United States, suburban growth meant one dominant housing type, one dominant transportation mode, and one dominant daily rhythm. Detached homes. Cars. Peak-hour commuting. When that model dominates, proximity becomes scarce. If most housing is far from jobs, schools, and daily services, then the limited number of places that are close to everything become especially valuable. Prices rise not because people suddenly develop a taste for density, but because distance becomes expensive.
For a while, this trade looked manageable. Better houses were often farther away, but households could absorb the drive. Fuel was relatively cheap. Credit was available. Dual incomes gave many families more earning power. The suburban bargain remained intact, but it was increasingly financed not only with money, but with time.
Beginning around 1980, average commute times in the United States stopped falling and began to rise. Over the following decades, the total daily commute of American households increased significantly. For households headed by someone who drove to work, commute times rose even more sharply. Research by Haus finds that commuting costs, measured as a share of household income, rose from 7.9% in 1980 to 9.1% in 2018, “a high since records began in 1980.” Haus also notes that “while homeowners and renters have seen similar growth rates in their commutes—at 20.5% and 22.5%, respectively—homeowners, on average, endure a daily commute that is 11.8 minutes longer.”
That is an important clue. Households were not escaping housing costs so much as paying for affordability in another currency: time.
This is a critical point that housing debates often miss. The cost of suburban homeownership is not just the mortgage. It includes car ownership, fuel, maintenance, insurance, and the hours lost every week to distance. The farther households moved in search of an affordable home, the more they absorbed those costs. The house on the fringe was often cheaper on paper, but the total system was not.
At the same time, the inflation-adjusted cost of owning and operating an automobile did not change as dramatically as many people might assume. What changed was the composition of those costs. Gasoline became a smaller share over time, while financing, insurance, and other fixed costs took on a greater role. This helped make driving feel normal and manageable, even as households built more and more of their lives around it.
That creates a hidden floor under the ladder of ownership. To participate in the suburban ideal, households first have to clear a set of fixed costs: one or more cars, long drives, daily coordination, and the time lost to distance. At scale, this system sorts households not only by income, but by who can endure those tradeoffs the longest.
And that endurance has limits.
Transportation research has shown for decades that adding road capacity does not permanently solve congestion. New lanes often invite new trips, longer travel distances, and more dispersed land use patterns that eventually refill the space that was just created. Road building can delay congestion. It rarely eliminates the dynamic that produces it. The data on commuting reflects this. The share of workers commuting in private vehicles rose dramatically from 64% in 1960 to a peak of 87.9% in 2000.
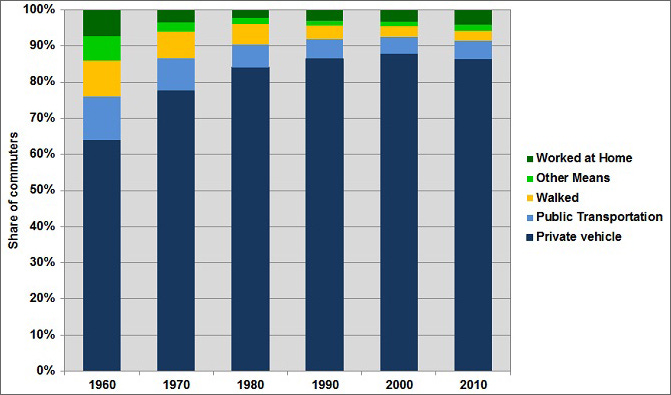
Traffic delays also increased sharply over time. Usings stats from the Department of Energy in 1980, the average commuter experienced about 20 hours of traffic delay per year. By 2015, it was more than 50. What had once been a manageable tradeoff at smaller scales became increasingly unstable at metropolitan scale.
This is what breaking at scale looks like. Not total collapse, but diminishing returns. Each additional subdivision requires more infrastructure, more lane miles, and more public investment just to preserve the same level of performance. Even then, performance often worsens.
The suburban model assumed that metropolitan regions could continue expanding road capacity fast enough to support outward growth. Over time, that assumption became more fragile. The system could absorb growth for a while. It could not do so indefinitely without rising friction.
From 1980 onward, the American economy became more diverse and less predictable. Analysis from Jon-David Hague at Boutisphere captures this idea well: “The 1980s marked a major turning point. As the economy shifted, having an extensive employment history became increasingly important for job applications and career advancement. The decline of manufacturing accelerated due to automation, outsourcing, and deregulation. At the same time, the financial, retail, and healthcare industries surged, shifting the economy toward service-based employment.”
Manufacturing continued to decline as a share of employment. In its place rose a wider mix of occupations in healthcare, services, STEM fields, administration, and management. In many ways it reflected the dynamism of the American economy. As economist Timothy Taylor puts it, “part of a dynamic US economy has always involved dramatic shifts in jobs.” That is true. But the question for this essay is not whether economic change is normal. It is whether a built environment optimized for a much narrower social template can keep serving a society whose work patterns, household structures, and daily rhythms have become much more varied.
The old suburban template worked best in a world of one primary job, one primary commute, and a relatively predictable schedule. As more households depended on two incomes, worked in different parts of a metro area, or navigated more fragmented employment patterns, that template became less comfortable. The problem was not that suburbs were wrong. It was that they were too uniform for a diversifying society.
The same was true in household economics. Productivity continued to rise, but the gains were not evenly distributed. The Economic Policy Institute’s summary of the long-run trend is useful here: “The growing wedge between productivity and typical workers’ pay is income going everywhere but the paychecks of the bottom 80% of workers. If it didn’t end up in paychecks of typical workers, where did all the income growth implied by the rising productivity line go? Two places, basically. It went into the salaries of highly paid corporate and professional employees.” The rise of the professional class shows the labour market moving towards more lucrative jobs that can provide them the lifestyle that underlies the American dream.
That line gets at the heart of the problem. The economy became more productive, but the broad middle of the labor market did not share proportionally in those gains. That mattered because the suburban bargain depended on a wide base of families being able to reliably afford housing, transportation, and family formation at the same time. As that broad-based security weakened, the system became less forgiving.
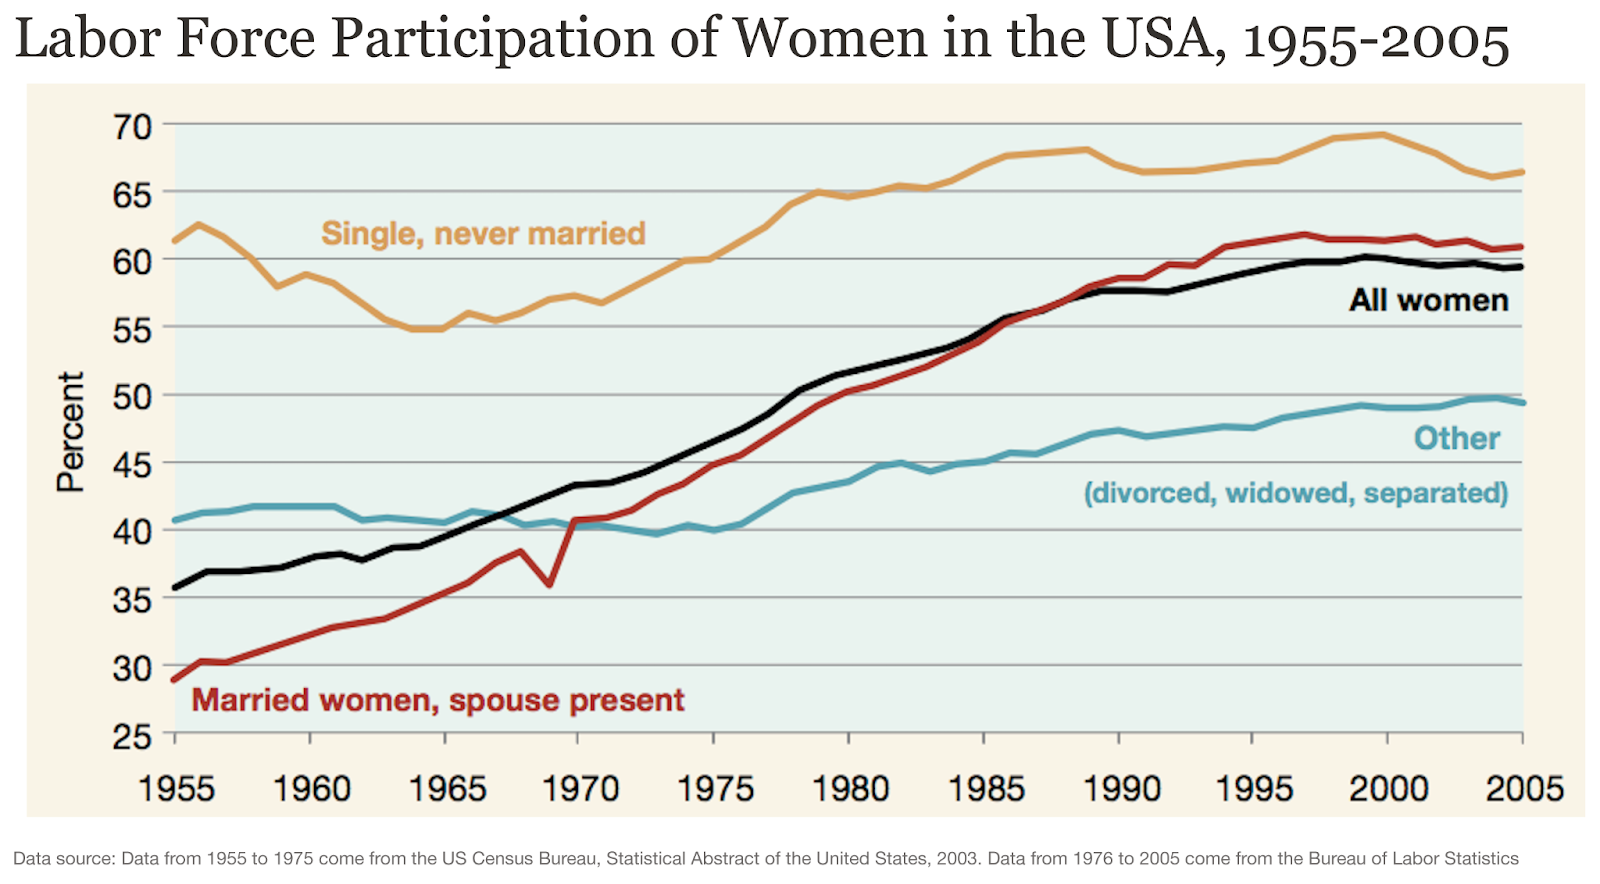
It is also worth noting the significant increase in the participation of women in the workforce. While the overall rate of participation after the war was only around 35% in 1955, it crossed 50% by 1980 and approached 60% by 2005. This changed household economics for the better in many ways, but it also made the one-commute, one-schedule suburban template less aligned with reality. More incomes helped households afford the system, but they also increased the number of trips, the complexity of scheduling, and the pressure created by distance.
Union decline was part of this story, though not the whole of it. Unions were not the sole foundation of postwar middle-class life, and simply restoring union membership would not recreate the old suburban order. But unions were one important part of a broader institutional environment that supported wage growth, benefits, job security, and household stability. While union membership was already declining by the 1980s, this decline accelerated from around 28% to 10% by 2016. This “complicated chart” produced by Labour Movement Researcher Eric Dirnbach based on data from EPI shows the decline in light blue with the corresponding stagnation in labour compensation in yellow. What’s interesting to see here is the increase in growth of the 10% of incomes in this period (orange) that grow alongside increasing productivity.
That decline matters because the suburban middle-class bargain was never sustained by wages alone. It depended on a wider package of economic security: reliable pay growth, benefits, grievance procedures, scheduling predictability, and enough job stability for households to make long-term commitments like homeownership, childrearing, and car-dependent living. The US Treasury puts it plainly: “Evidence suggests that strengthening unions will improve the well-being of the middle class.” Its review of the research finds that unionized workers “earn 10 to 15 percent more than nonunionized workers in similar jobs,” and that unions also improve “vacation time, sick leave, scheduling predictability, and a grievance procedure protected from employer retaliation.” Treasury further argues that these benefits can spill over beyond union shops by improving pay and job quality in related firms as well.
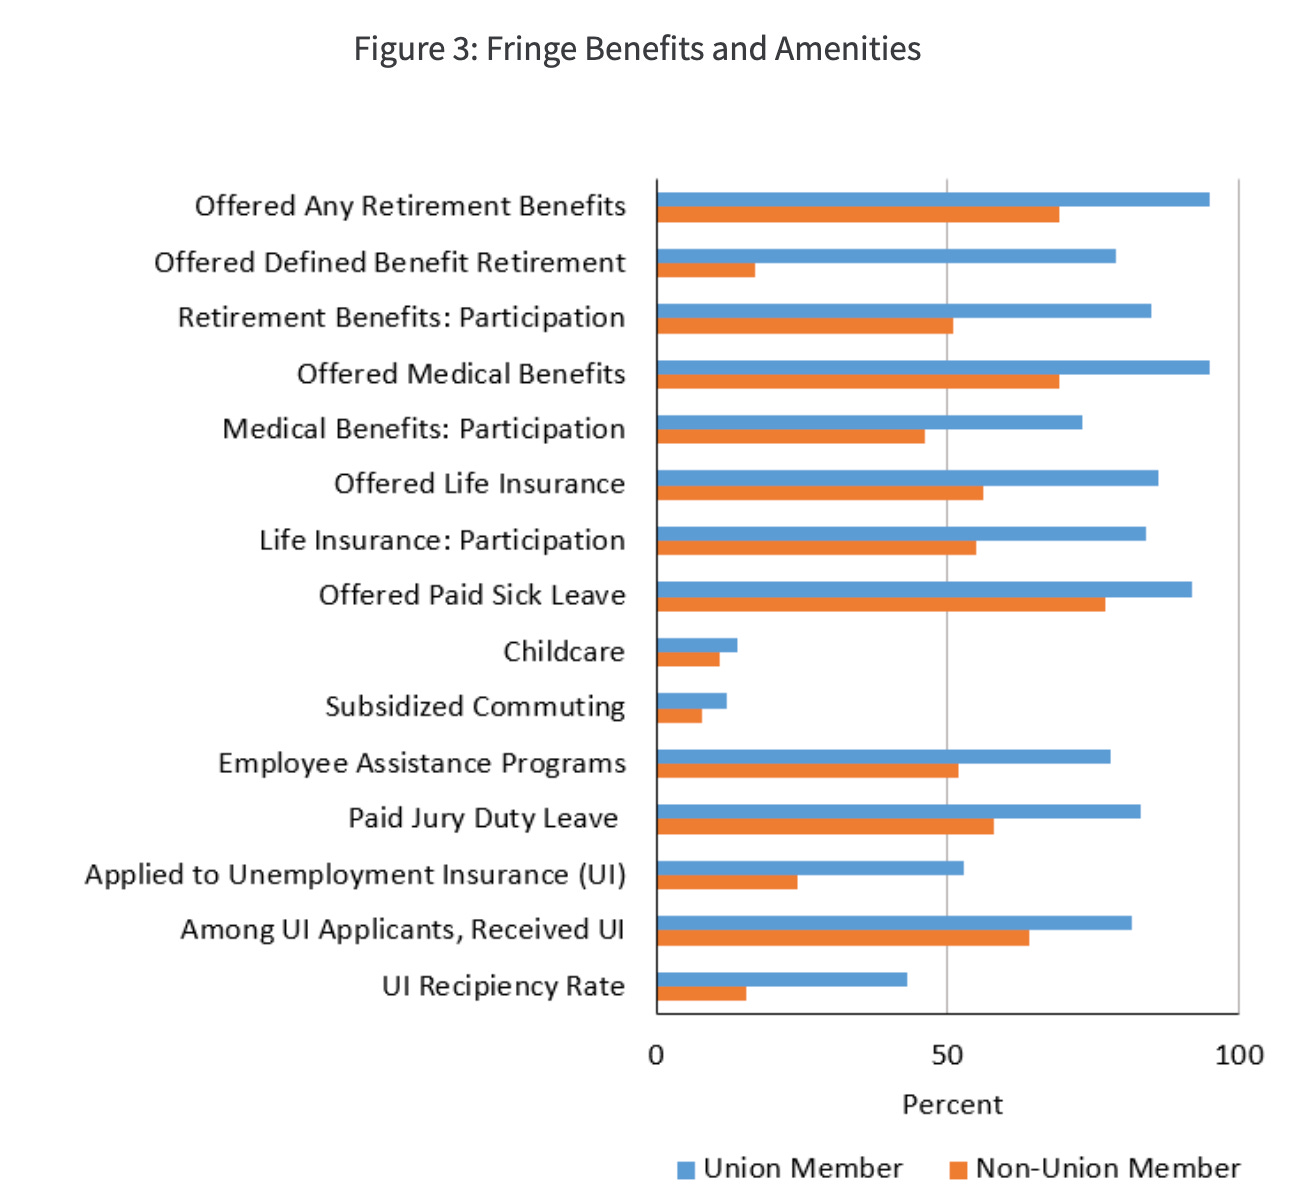
Source: Bureau of Labor Statistics. UI data from 2018. Other data from March 2021. Offered benefits describe whether an employee has access to the benefit through their employer, no the take-up thereof. UI values include non-member workers represented by a union. UI recipiency rate is the percent of unemployed workers who received UI, irrespective of whether they are eligible for UI payments.
Their decline mattered not because it explains everything, but because it removed one layer of protection from a housing system that increasingly depended on stability to remain affordable.
Job tenure also declined over time. The analysis from John-David Hauge at Boutisphere notes an interesting decline in job security. In 1980 the average job tenure was around 13 years and by 2010 it was only 8 years. There are many factors that drive job tenure, but it’s easy to surmise that increased competitiveness, fewer unionized jobs, and increasing layoffs did their part to erode a key pillar of financial stability and home ownership.
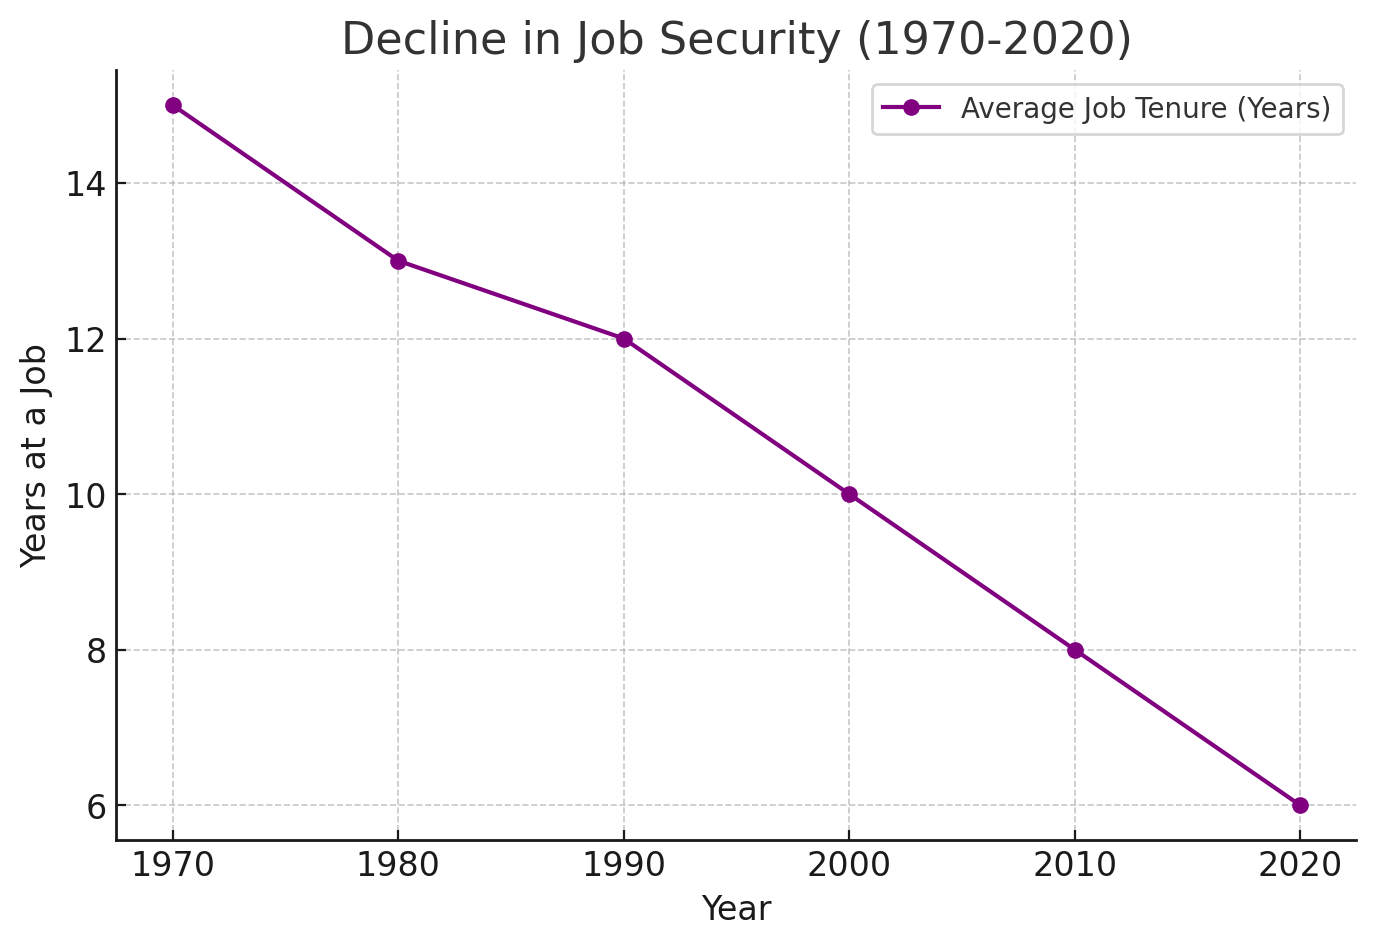
Workers changed jobs more frequently. Careers became more contingent. The result was a labor market that could still produce prosperity, but did so less evenly and with less predictability for the middle of the distribution. That is an important part of the housing story. A built environment optimized for predictable lives becomes harder to inhabit when lives become less predictable.
Timing also mattered.
From the mid-1980s through the early 2000s, the baby boom generation moved deeper into its peak earning years. That helped mask many of the inefficiencies already accumulating in the system. Large households with rising incomes could absorb longer commutes, bigger houses, and more driving more easily than younger households can today. Dual incomes also made many of these tradeoffs feel manageable for a time.
But tolerance is not the same as preference.
A household may accept a long commute because it is the only route into homeownership. A family may stretch for a larger house farther from work because smaller options do not exist. A generation may normalize car dependence because there is no meaningful alternative. None of that means the system is working especially well. It may only mean that people are adapting to the system they have.
In that sense, the baby boom years did not disprove the mismatch. They helped postpone its visibility.
The scale of the generation mattered too. The suburban growth machine had a vast cohort moving through family formation, prime earning years, and peak consumption at roughly the same time. Suburban retail, office parks, and shopping malls all absorbed that disposable income and reinforced a car-dependent way of life. For a while, the size and spending power of the generation helped make the system look more durable than it really was.
The 2008 financial crisis did not suddenly make the suburban model unstable. It revealed how fragile it had become.
For years, the system had been supported by easy credit, rising home values, and the assumption that continued outward growth would remain financially and politically sustainable. When housing prices fell and credit tightened, those assumptions cracked. What had looked like a durable pattern of growth turned out, in many places, to depend on a much narrower set of economic conditions than people had assumed.
What broke in 2008 was not the desire for homeownership or the appeal of suburban life. What broke was confidence in a growth model that had come to rely on debt, price appreciation, and the idea that one dominant housing form could continue serving a rapidly changing society.
By the early 2010s, suburbia had not failed. But it had reached the limits of a system built on conformity, cheap mobility, and predictable lives.
The result of the 80’s Vibe Shift becomes clear when we look at the data. Housing production slowed. New homes got larger even as households got smaller. Prices and rents rose faster than incomes. Commute times lengthened, congestion worsened, and households increasingly absorbed the cost of the suburban bargain not only in money, but in time. At the same time, the economy became more volatile and more specialized, while family life became less standardized than the postwar template the system had been built around.
This is why the story is not simply that housing got expensive. It is that a whole spatial model became less workable. The suburban system could still function for many households, but it no longer scaled cleanly as a universal solution. It produced too little variety, required too much driving, and asked too many households to contort themselves around a built environment designed for a different era.
Understanding this shift is not an argument against suburbs. It is an argument against monoculture. A country as large, economically diverse, and socially varied as the United States cannot rely on one dominant housing type, one dominant mobility system, and one dominant development pattern forever without creating strain.
Looking ahead, In 2016, millennials surpassed baby boomers as the largest generation in the labor force. They entered adulthood facing a more expensive housing market, weaker job stability, and a labor market that increasingly rewarded credentials and specialization. Behind them are Gen Z and Gen Alpha, who will make housing choices under even more uncertain conditions. At the same time, the baby boom generation is moving into retirement and old age, raising new questions about downsizing, aging in place, inheritance, and the future reuse of suburban housing stock.
The next housing era will not be shaped by nostalgia for the last one. It will be shaped by the realities of the economy and household structure we actually have. In the next piece, I want to look at what the data suggests about where housing demand is heading and why building differently is not a cultural imposition, but an economic response to a society that has already changed and is still changing.
No posts
Comments
Nothing yet. Say the first thing.
Sign in to join the conversation.