

From the moment we debuted Bridge Grades for the 119th Congress in October, we already knew we had two urgent areas to fix.
First, we knew no one would blindly trust just an arbitrary score and a letter grade listed on a website without being able to easily see and understand what’s beneath it. We’ll get into that in a future post.
Second, we knew the grading rubric needed refinement with respect to interpreting the 3rd party data we collect. Our techniques were too blunt.
This post is hand-written deep dive (all em-dashes are mine) into how and why we’ve further refined the Bridge Grades grading rubric.1
To help contextualize the coming changes. a reminder of what happened in previous episodes of Season 2.
We collect data on legislative record and rhetoric analysis from 3rd parties and compile forced rankings for every member of Congress on several dimensions. We grant bonus points for “degrees of difficulty” and normalize the House and the Senate onto an index between 0-100. In applying a forced curve, the top half of each class earn As and Bs, and the bottom half of each class earn Cs and Fs.2
Our systems are designed to sort legislative bridgers from dividers. How good a job does it do? Sometimes, to be cheeky, I like to say we give ourselves a B. It can be better, and we want to earn an A grade.
As we compile 3rd party data, imagine there are nine equal parts being added together. Five of the nine come from their legislative record, and four of the nine concern their rhetoric. Within those five parts legislative record, we tally how often legislators engage in cross-partisan lawmaking. Notably, we tally when the lawmaker introduces a bill (as its “sponsor”) that earns a cross-party co-sponsor. We also tally points when they co-sponsor bills that are introduced by the opposite party. Simply ranking each member of Congress on these dimensions alone comprises almost half of the input that help sort bridgers from dividers.
But are all bills made equal? Most certainly not. There are four types of bills and resolutions3 in each chamber, and we can easily pick up the bill type and apply weights to avoid giving full credit for bipartisan co-sponsorship of a resolution to pardon a turkey. We differentiate bill types with “bill-type weights.”
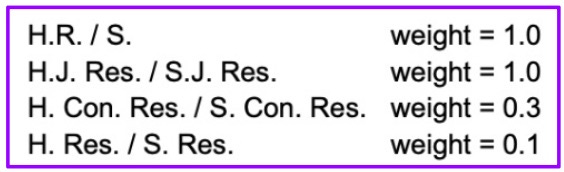
On the co-sponsoring side of things, we also want to avoid giving full marks for performative co-sponsoring. Timing matters. We give full credit for original co-sponsors whose names are on the bill when it is introduced. These are the ones actually at the table, and collaborating to find solutions in common interests. If you join in the days immediately after, you get half-credit, and then it’s halved again if you join a week later. These adjustments aim to fully reward the collaborative effort of the original co-sponsor, and the coalition building of the follow-on co-sponsors (to a lesser degree).
Makes sense, no?
But, then things got spicy.
Because, what about the co-sponsors from the same party as the named sponsor, who are also collaborating and building coalitions with their co-sponsors from across the aisle? We totally missed this group last time. This time we throw same-party co-sponsors a bone for collaboration and coalition building. Still, co-sponsoring legislation introduced by one’s own party isn’t nearly as brave as being a cross-party co-sponsor. So, we apply a haircut here, too.
I’ve spared you the edge cases, but if you want to read the full recipe of how we calculate the grades, it’s all here.
All these well intentioned improvements become quite a complex set of instructions and code-sequences. And, there are curveballs along the way–like when Rep. Kevin Kiley suddenly became an Independent4, when Rep. Marjorie Taylor Greene resigned, or when three (3!) active House reps died during the term.5 So, kudos and respect to our data science and code-writing phenoms. Their work and all of our code is fully available on our github.
We wanted to know, too. So, as we finalized the loose ends, we collected refreshed data, and ran the process to do a sanity check on the results. For example, we compare before-and-after results and look for outliers (did anyone move up or down in a big way that’s unexplainable?). The #1 big no-no is to avoid introducing any measures or settings that structurally benefit one party over the other. For example, at one point last year we wanted to include data on partisan voting records (how often people vote with or against their caucus), but very quickly we learned that due to the fact that a majority party controls which bills make it to the voting stage, this data source didn’t offer a fair comparison across parties and only added noise. So, we dropped that for another time.
In the case of our new v119.2, we could see a clear and observable benefit to one party over the other compared to the earlier version. In taking a closer look, we determined that the bill-type weights impact on the bill sponsoring had no material partisan impact. But, on the co-sponsoring timing (plus same-party co-sponsor credit), the tail of the top gainers were clearly Republicans and the tail of the top losers were clearly Democrats.
At first glance, I hated it.
Why? First, it looked like a clear violation of giving one party over another a structural advantage, and was therefore unacceptable. Second, my own personal bias of hating both parties yet feeling the urgent importance of re-establishing separation of powers in this year’s election screamed NO.
There was a second explanation, though, that our existing rubric was structurally tilted, and this version offered a correction to that. Hmmm.
It was unsettling.
How could one know? In our quest to measure the dimension of collaboration versus divisiveness there is no true North Star—it’s more like tuning in an antenna to the right frequency. Finding that signal within the noise.
Because the core signal we seek within legislative record is collaboration, we realized that there should be some symmetry between statistics we captured on the sponsorship side (introducing the bill) and the corresponding co-sponsorship side. To collaborate, by definition, you must have contributions from both parties.
Therefore, the total size of the prize for sponsoring bills by one party should at least correspond with size of the pool of credit that their cross-party co-sponsors can earn. Their cross-party collaboration and coalition literally creates a pool of credit that together that they should share:
- Democrats introducing bills that Republicans support fills up one pool of points.
- Republicans introducing bills that Democrats support fills up another.
The pools won’t be the same size, but the distribution of points from within each pool should demonstrate logical cross-partisan fairness.
Did it, though?
I went back into the spreadsheets.
I found that the collaborative Democratic lawmakers in our current version were winning both the lion’s share of the bill-sponsoring credits and the co-sponsoring credits. While conceptually possible, the red flag was that margin was too wide. I’ll say it again: it takes two to tango. Notably, after we applied the bill-type weights and co-sponsorship adjustments for the new version, we saw that gap shrink. One blended metric I looked at had the Democrats out earning the Republicans at a 59-41 clip on v119.1, while the updated v119.2 reduced that ratio to 54-46 post the refinements.
Did even this spread make logical sense? Let’s see. At last count there have been 3,980 cross-partisan co-sponsored bills this 119th Congress, with an approximately even partisan split between the sponsors: Republicans (51.4%), Democrats (48.6%). But, on the co-sponsorship side, Democratic legislators to date have been almost 3 times more active building coalitions in support of Republican sponsored bills than their peers in reverse (15,700 to 5,700, or a 73-27 ratio).
So, a slightly greater overall value capture by the Democrats, for me, passes the sanity check.6
The brass tax is what impact does the new rubric have on the distribution of grades by party?
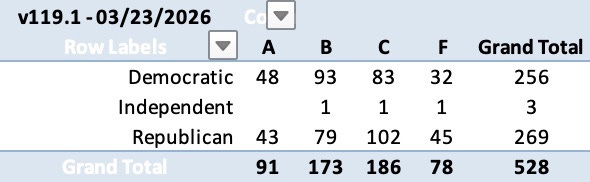
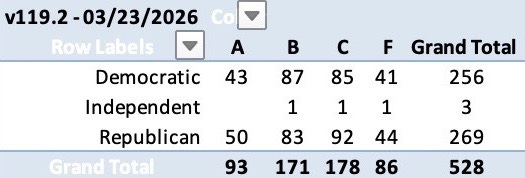
Indeed, there is a noticeable shift in the composition of grades across parties. On v119.1, across both chambers of Congress, the total number of bridgers (As and Bs) leaned Democratic (D-141 to R-122) for reasons explained above. In the updated version, against an identical dataset, we now see more balance (D-130 to R-133). To be very clear, while non-partisan grade parity is not a specific goal or conditional requirement of the rubric, we do see the balance as a healthy sign of having built a rubric with minimal structural partisan bias. We consider this positive as Bridge Grades are designed not to measure ideological differentiation, but rather to sort bridgers who seek win-win solutions from dividers who engage in zero-sum governance.
Grade composition v119.1:
Grade composition v119.2:
For us, this sort of lengthy disclosure is table-stakes — we must demonstrate transparency on the why and the how of every step along the way to earn public trust in a system designed to become a trustworthy public utility.
For you, taking the time and attention to understand it all means you must be truly interested in how this all works. Respect. It is also likely that you have challenges, complaints, ideas, questions, and suggestions about how to improve the rubric. Our intention is that the rubric evolution is crowd-sourced over time, so please get in touch.
In the meantime, we will embrace v119.2 to grade the rest of the 119th Congressional term through 2026 and will use the methodology to update the scores and grades with fresh data approximately monthly through the rest of the term. Any and all future changes to the grading process will only be applied to v120.1 which will launch not until mid-2027.
As always, please subscribe to keep up to date on all of the action. Sharing is caring, and high fives are free.
Coming up next. In early April, with data compiled including the first 3 full months of 2026, we’ll get our first look at the updated Bridge Grades.
See you then.
The grading rubric for the 119th is now considered locked for further change until the 120th Congress when we’ll start all over again grading the new Congress.
Each has its own scale, so House members are measured against themselves, and Senators against only themselves.
Bills, Joint Resolutions, Concurrent Resolutions, and Simple Resolutions
We treat Kiley like a Republican with respect to measuring his bipartisan legislative record, while treating both Independent Senators as Democrats (based on with whom they caucus).
RIP. Rep. Sylvester Turner (D-TX) passed away on March 4, 2025. Rep. Gerry Connolly (D-VA) passed away on May 21, 2025. Rep. Doug LaMalfa (R-CA) passed away on January 6, 2026.
Merits another look in v120.1 to better understand structural partisan advantages due to majority position and legislative agenda control.
Comments
Nothing yet. Say the first thing.
Sign in to join the conversation.