
In the world of product management and customer experience, we've long relied on metrics like Net Promoter Score (NPS) to gauge how well our products are performing. But what if that glowing NPS score is just a shiny facade, masking the cracks of impending churn?
Imagine this: Your users rave about your app in a survey today, only to ghost you tomorrow. That's the harsh reality many teams face when they prioritize feel-good feedback over hard behavioral data.
It's time for a paradigm shift—retention is the new NPS. As a leading indicator rooted in actual usage and adoption, retention doesn't just tell you if users are happy; it shows you if they're hooked for the long haul.
In this post, we'll break down the deep-seated flaws in popular frameworks like NPS and the KANO model, explore why they're so misleading as lagging, subjective indicators, and pivot to the true end goal: delivering value that drives adoption and retention. We'll also discuss how to reposition these older tools without throwing them out entirely, and provide actionable steps to build a more robust metrics strategy. Let's dive in.
The Flaws in Popular Frameworks (NPS, KANO, and Beyond)
First, a quick refresher: NPS, introduced by Fred Reichheld in 2003, is a straightforward survey asking users, "On a scale of 0-10, how likely are you to recommend our product to a friend or colleague?" Responses sort users into promoters (9-10), passives (7-8), and detractors (0-6), with the score calculated as promoters minus detractors. It's become a staple in SaaS, e-commerce, and enterprise software for its simplicity.
But here's where it falls short:
It's a Lagging Indicator: NPS captures sentiment after the fact, based on historical experiences. It doesn't forecast future actions. For instance, a user might score you a solid 9 after a smooth onboarding, but if the core features don't deliver ongoing value, they'll churn quietly. By the time NPS dips, the damage is often done.
Pressure for Positive Ratings: Social dynamics play a huge role. Users might inflate scores due to courtesy bias—feeling obligated to be nice—or external pressures, like in B2B settings where rating low could strain vendor relationships. Incentives, such as "Rate us 10 for a discount," further skew results toward artificial highs.
Subjectivity and Lack of Depth: A raw score tells you zilch about why someone feels that way. You're left crossing your fingers for optional comments, which are hit-or-miss. Without context, it's like diagnosing a patient based solely on their temperature—informative, but incomplete.
Completion Challenges: Surveys interrupt the user experience, leading to abysmal response rates (often 10-20%). Those who do respond might not be representative; busy or indifferent users skip them, leaving you with polarized feedback from the most vocal. And honesty? Forget it—people rush through or game the system.
Now, let's turn to the KANO model, developed by Noriaki Kano in the 1980s. It classifies product features into categories: must-haves (basics that prevent dissatisfaction), performance (linear satisfiers), and delighters (unexpected wow factors). Sounds useful, right? But it's riddled with similar issues:
Like NPS, it's survey-dependent, relying on users' self-reported preferences, which are inherently subjective and prone to bias.
It treats user needs as static, but in reality, expectations evolve with market changes and personal contexts. A "delighter" today (e.g., AI integration) might become a "must-have" tomorrow.
Other frameworks, like Customer Satisfaction Score (CSAT) or Customer Effort Score (CES), share these pitfalls. They're all opinion-based, post-interaction snapshots that don't reliably predict loyalty or revenue.
Why These Frameworks Are Misleading
The core problem boils down to lagging versus leading indicators. Lagging metrics like NPS measure outcomes retroactively—think of them as a rearview mirror. They confirm what already happened but offer little guidance on what's coming. Leading indicators, like retention rates, are your headlights, illuminating potential issues before they crash your growth.
Subjectivity amplifies the deception. Cultural norms influence responses (e.g., some regions score conservatively), and timing matters—survey someone right after a win, and you'll get inflated positivity.
Then there's sample bias: Suppose you have 200 users, but only 10 respond with an 80% NPS. That's a tiny 5% slice, statistically unreliable and potentially skewed toward enthusiasts or complainers. Basing decisions on this is like polling your family for national election predictions—flawed and risky.
This breeds flawed thinking: Teams pat themselves on the back for high NPS, rationalizing churn as "external factors" ("Well, at least they were happy—it's not the product!").
But happiness doesn't pay the bills; sustained usage does. Take mandated enterprise software: Users might give neutral or positive NPS because they're stuck with it—no alternatives in a locked-in deal. Yet, low feature adoption reveals the truth—they tolerate it, not love it.
NPS becomes a dead end: You send a generic "Thanks for the feedback!" reply, but without deeper insights, nothing changes.
In fast-moving markets, these lags can be fatal. A competitor swoops in with better value, and poof—your "promoters" vanish, leaving you wondering what went wrong.
The End Goal – From Value to Retention
At its heart, product success isn't about fleeting satisfaction; it's about creating a cycle of value that keeps users coming back. Here's the progression we should aim for:
Easy to Use: Start with frictionless design. If onboarding feels like wading through mud, users bounce before discovering value.
Find Value: Once in, they need quick wins—solving real problems efficiently. This is the "aha!" moment that hooks them.
Adoption: Value leads to deeper engagement. Track how many users integrate core features into their workflows.
Returned Value: Adoption yields tangible ROI, like boosted productivity or cost savings, reinforcing the product's worth.
Returned Use: Finally, habitual retention—users return because the product is indispensable, not optional.
Retention trumps feedback because it's objective, drawn from behavioral data like login frequency, session length, or churn cohorts. It's a leading indicator directly linked to monetization: Retained users upgrade, expand usage, and advocate organically. Adoption metrics, such as time-to-first-value or feature stickiness, provide early signals to iterate.
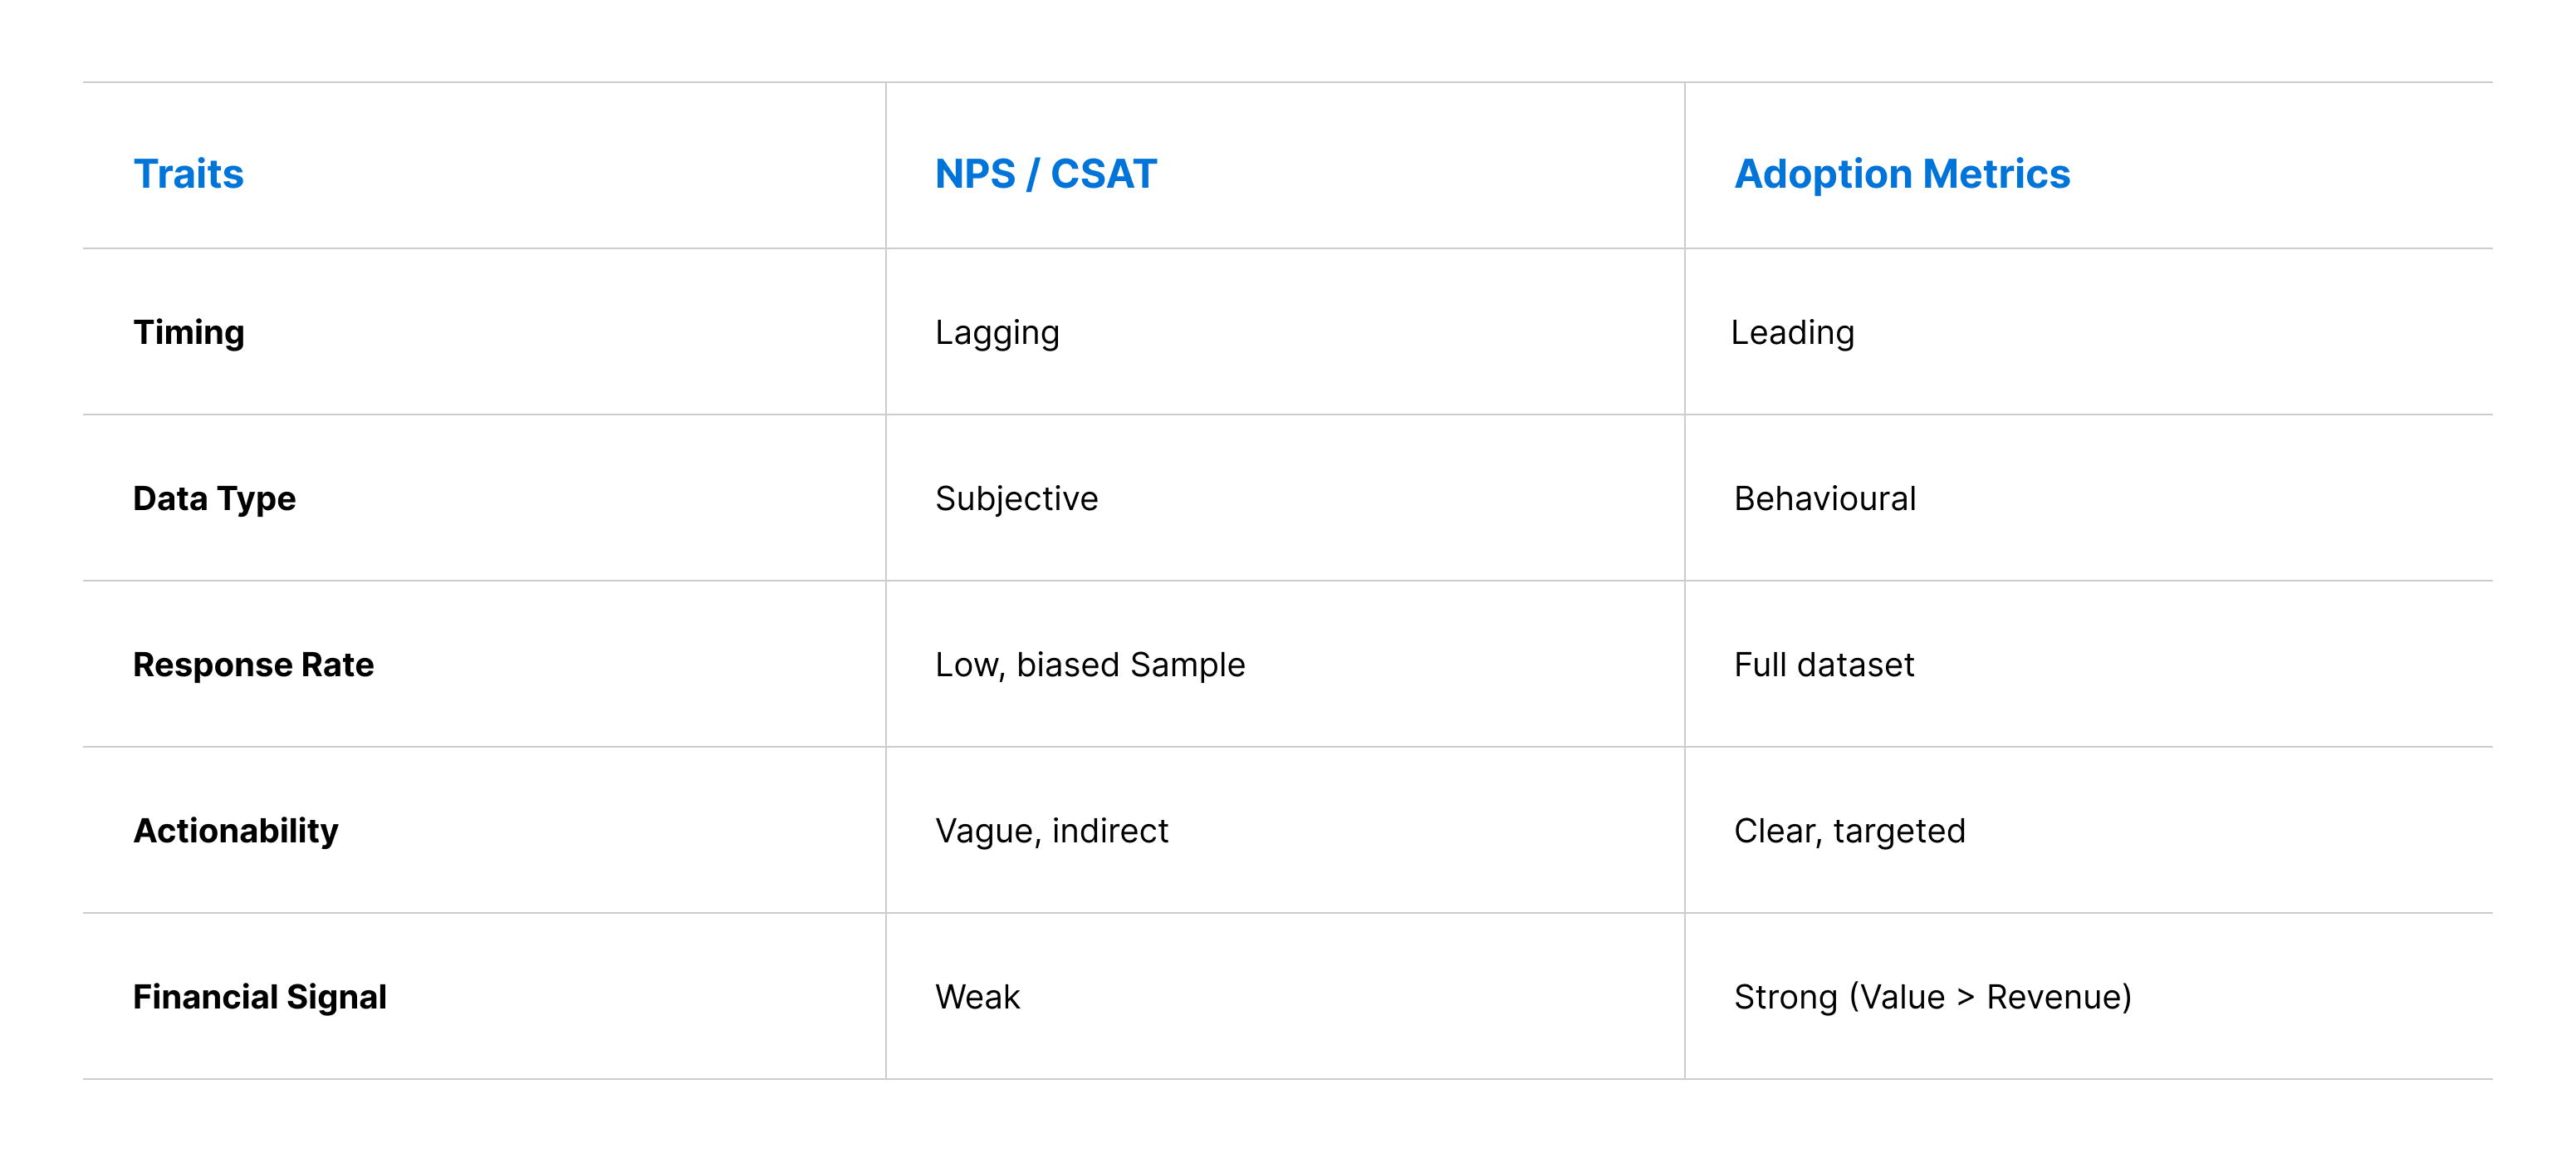
This isn't about ego-stroking; it's about actionable intelligence. Metrics should expose weaknesses to fix, not just celebrate strengths.
Contrast this with Google's HEART framework (Happiness, Engagement, Adoption, Retention, Task Success)—it's a masterclass in balance. HEART blends qualitative happiness (via light surveys) with quantitative usage data, making it far superior to NPS or KANO for holistic insights.
The Role of NPS – Not Dismissed, But Repositioned
We're not here to bury NPS entirely; it has its place as a supporting actor, not the star. When responses come in, NPS can uncover sentiment trends or validate hunches. A low score might prompt targeted questions like, "How can we make your life better?"—sparking qualitative gold.
But its limitations loom large: Low response rates mean you're often flying blind. In those enterprise lock-ins, NPS might mask underlying frustration, as users rate based on resignation rather than enthusiasm. And if you get no feedback? Crickets. Or worse, you over-rely on a skewed sample, leading to misguided priorities.
The key is repositioning: Treat NPS as a tool toward more meaningful metrics. Correlate it with adoption and retention—e.g., if high NPS pairs with low usage, dig into why. Ultimately, adoption and retention are the moneymakers, proving returned use equals real value. NPS? It's the side dish, not the main course.
Addressing This Going Forward – Actionable Steps
Ready to make the switch? Here's how to build a retention-first metrics system:
Shift to Usage-Based Metrics: Ditch survey overload for analytics. Monitor DAU/MAU ratios, churn rates, and feature adoption using tools like Mixpanel or Amplitude. Run cohort analyses to spot retention drop-offs by user segment.
Build Better Feedback Loops: Integrate micro-surveys (e.g., in-app NPS at key moments) with behavioral data. Use AI to analyze patterns, like correlating low engagement with specific features.
Adopt HEART-Like Frameworks: Tailor HEART to your product. Measure:
Happiness: Sparse, targeted surveys.
Engagement: Time spent, actions per session.
Adoption: Percentage using key features.
Retention: Return rates over time.
Task Success: Completion rates for core flows.
Overcome Common Challenges: In enterprise scenarios, proxy metrics like integration completeness or training uptake can fill gaps. For silent users, conduct targeted interviews or A/B tests to uncover needs.
Case Studies and Tips: Look at Slack—they prioritized daily active habits over surveys, fueling explosive growth. Start small: Audit your dashboard for leading indicators, set retention benchmarks (e.g., 40% Day 30 retention), and roadmap based on usage insights. Tools like Google Analytics or Segment can kickstart this.
Remember, iteration is key—test, measure, refine.
Conclusion
NPS and KANO aren't obsolete relics; they're just misplaced heroes in a data-driven era. By highlighting their flaws as lagging, subjective tools, we see the path forward: Prioritize value that fuels adoption and retention, the true engines of growth. These metrics don't just pat you on the back—they demand better products that deliver real, returned use.
Audit your own stack today: Are you chasing scores or building loyalty? Shift to retention as your north star, and watch your product thrive. What's your take—have you ditched NPS for usage data? Drop a comment below, or share your metrics horror stories.
For more on this, check out resources like Google's HEART documentation or books on product analytics.
Adoption isn’t just about retention — it’s a reflection of your product’s maturity.
If people aren’t coming back, it’s not just a UX issue. It’s a signal that something deeper might be broken — in your fundamentals, in the value you deliver, or in what you’ve prioritized.
I break this down in my Product Hierarchy of Needs framework — a practical way to assess what’s missing and where your product really stands
Let's build products that stick, not just satisfy. 🚀
📚 Want to Go Deeper?
If this post resonated with you — if you’re tired of chasing feel-good metrics and want to build products that actually retain users — then you’ll want to check out my book, Conquer Customer Churn.
It’s a practical, no-fluff guide to understanding why users leave, how to spot the signs early, and what you can actually do about it — grounded in real metrics, product thinking, and customer health strategies.
👉 You can grab your copy here: Conquer Customer Churn
Find this content helpful? Be sure to subscribe so you don’t miss the next product tips, series and frameworks to help take your product to the next level!
Comments
Nothing yet. Say the first thing.
Sign in to join the conversation.