

Jensen Huang is such a skilled strategist that I don’t need to waste space explaining the obvious. Ten years ago, he was running a manufacturer of gaming graphics cards. Today, he leads the most valuable company on the planet, having surpassed giants that once seemed untouchable—such as Microsoft, Apple, and others. Those who follow *Mosca* know this isn’t just a trend; it’s about execution.
The major battleground right now is no longer just technological; it is financial. Whoever secures the funds to build data centers wins the race, and the cost of capital is rising even for the hyperscalers—Google, Microsoft, Amazon, and Meta. If it’s getting pricier for them, imagine the situation for smaller companies that also require computing power but lack the same cash reserves.
Nvidia doesn’t want to rely solely on major clients. Google has been manufacturing its own AI chips—TPUs—for years and is expanding that effort, a clear signal that other hyperscalers might follow suit and reduce their dependence on Nvidia. Whether they can truly compete with Huang in the medium term is another story. For now, Nvidia remains the one calling the shots.
So, what was Huang’s move to avoid losing smaller clients who lack the deep pockets to buy chips upfront? He decided to get ahead of the problem and organize the financing himself. The *Wall Street Journal* detailed the mechanism: a $500 billion plan, structured with banks and asset managers, to standardize chip financing and create capital pools backed by these assets. In practice, special-purpose vehicles (SPVs) purchase the equipment using funds raised from investors, lease it to the end customer, and pass the payments on to the investors. Nvidia acts as a sort of partial guarantor—Huang calls this a “residual-value support mechanism.” If the value of the chip backing the loan falls below a certain floor, Nvidia covers part of the difference, potentially footing up to 25% of the project cost. In short—without naming names—Nvidia is backing its customers so they can keep buying its chips, and doing so without offering discounts.
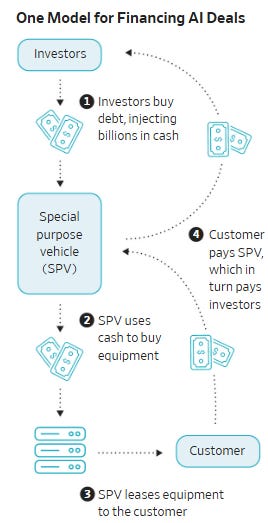
The scale of this move is impressive. According to Bank of America, the issuance of AI-linked bonds has already hit a record this year—far surpassing the total raised in 2025—and the market expects this pace to remain strong through December. However, not everyone raises capital at the same cost: smaller companies, lacking the robust balance sheets of hyperscalers, are already paying significantly higher interest rates to secure the same financing. This reflects the market pricing in the higher risk associated with this type of transaction.
It is worth noting the criticism from Michael Burry—the investor who gained fame by betting against mortgage-backed securities in 2008 and is now shorting Nvidia and other AI stocks. He pointed out that while structuring credit is standard practice, the problem arises when credit is artificially structured to prolong late-stage bull market momentum—that is where the risk lies. It is worth keeping this warning in mind as the financial engineering surrounding Nvidia becomes increasingly sophisticated.
I would also like to address another topic that has been generating buzz: the exceptional second-quarter earnings reported by S&P 500 companies, a trend explained by data from Yardeni Research. So far, 90% of the index’s companies have released their results, beating analyst projections for both earnings and margins. However, a significant portion of this outperformance did not stem from core operations: mark-to-market accounting gains on equity stakes held by Alphabet and Amazon, combined with a tax reversal at Meta, added $14 to the index’s earnings per share for the quarter. Consequently, the S&P 500’s EPS rose 46.7% year-over-year; excluding this accounting effect, the growth rate was 25.7%.
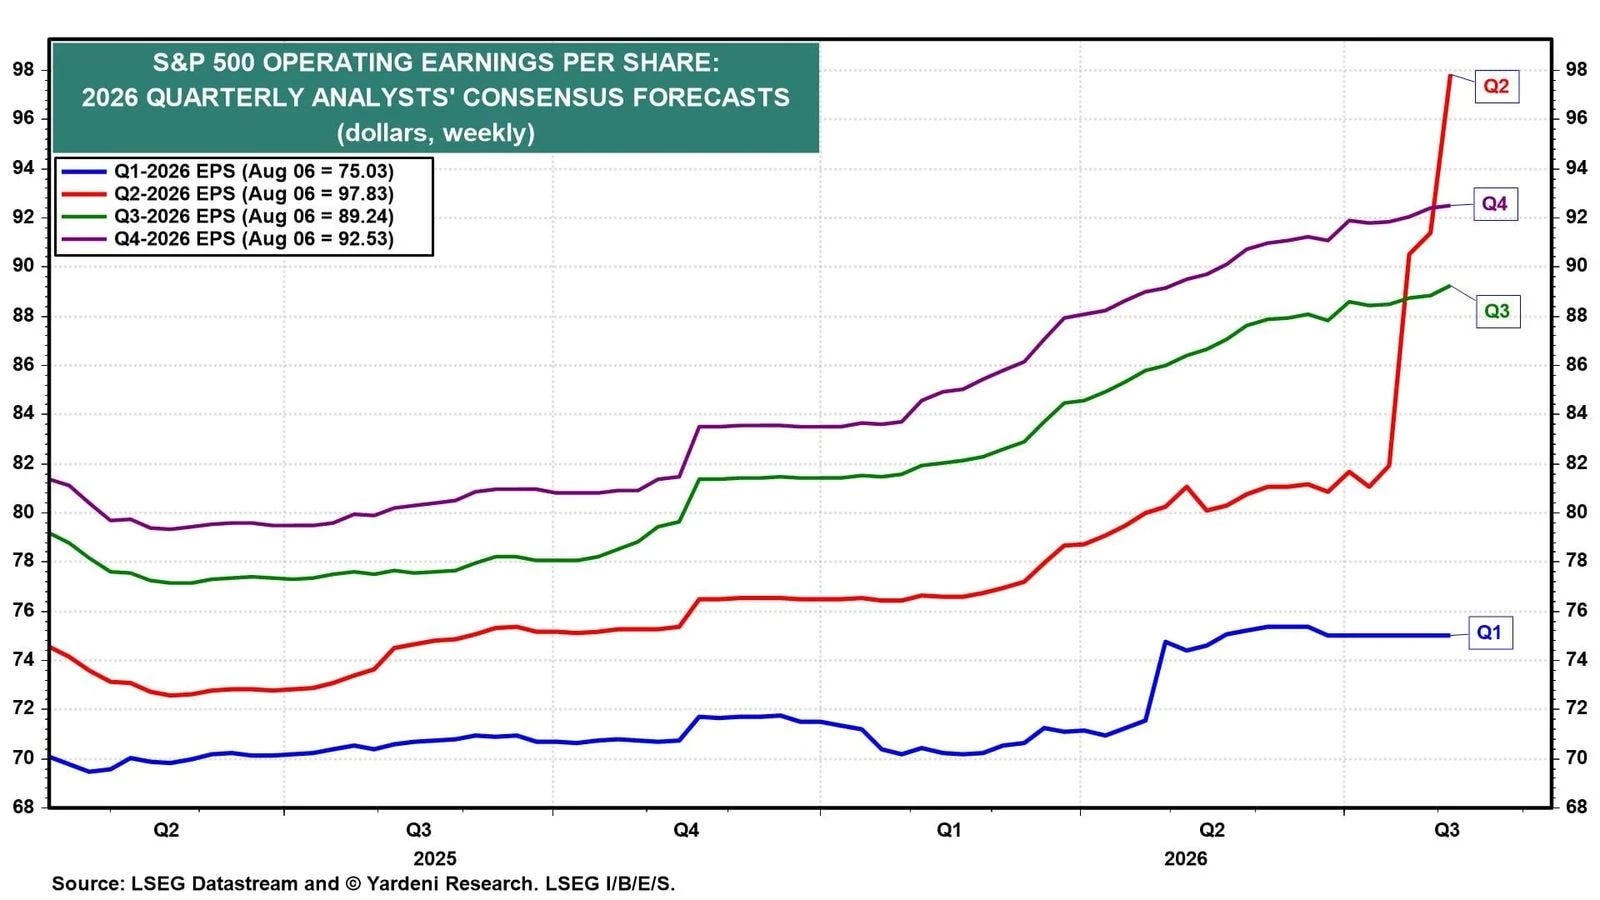
CHART: “S&P 500 Operating Earnings Per Share — 2026 Quarterly Analysts’ Consensus Forecasts (y/y% growth rate)” — source: Yardeni QuickTakes, “Raising Our S&P 500 Earnings & Price Targets Outlook Due To FEMO (Fabulous Earnings Momentum)”, August 11, 2026
If you look at the chart without this context, the slope of the curve might be startling. But don’t be alarmed: the effect stems from a legitimate, recognized accounting practice—mark-to-market valuation of equity holdings—rather than any sort of window dressing, and it is unlikely to recur with such intensity every quarter. Even so, setting aside this one-off effect, a 25.7% annual earnings growth rate is—let’s face it—extraordinary in the best possible way.
Yardeni Research used these results as an opportunity to raise the bar on its own projections. The S&P 500 earnings-per-share estimate was revised from $330 to $375 for 2026, and from $375 to $415 for 2027. The firm also raised its year-end 2026 target for the index from 8,250 to 8,400 points, while maintaining its 10,000-point target for the end of 2029—and making it clear that this could rise further if the “Roaring 2020s” scenario continues to play out. This is no mere figure of speech: the team raised the subjective probability of this positive cycle continuing from 60% to 80%, while keeping the chance of a market-crushing recession at 20%. It is open optimism, yet with the risk acknowledged in the figures themselves—which speaks volumes about the current moment. CHART: “S&P 500 Index & YRI Forecast Range” — index trajectory and Yardeni Research’s new price targets through 2030 — source: Yardeni QuickTakes, “Raising Our S&P 500 Earnings & Price Targets Outlook Due To FEMO (Fabulous Earnings Momentum),” August 11, 2026
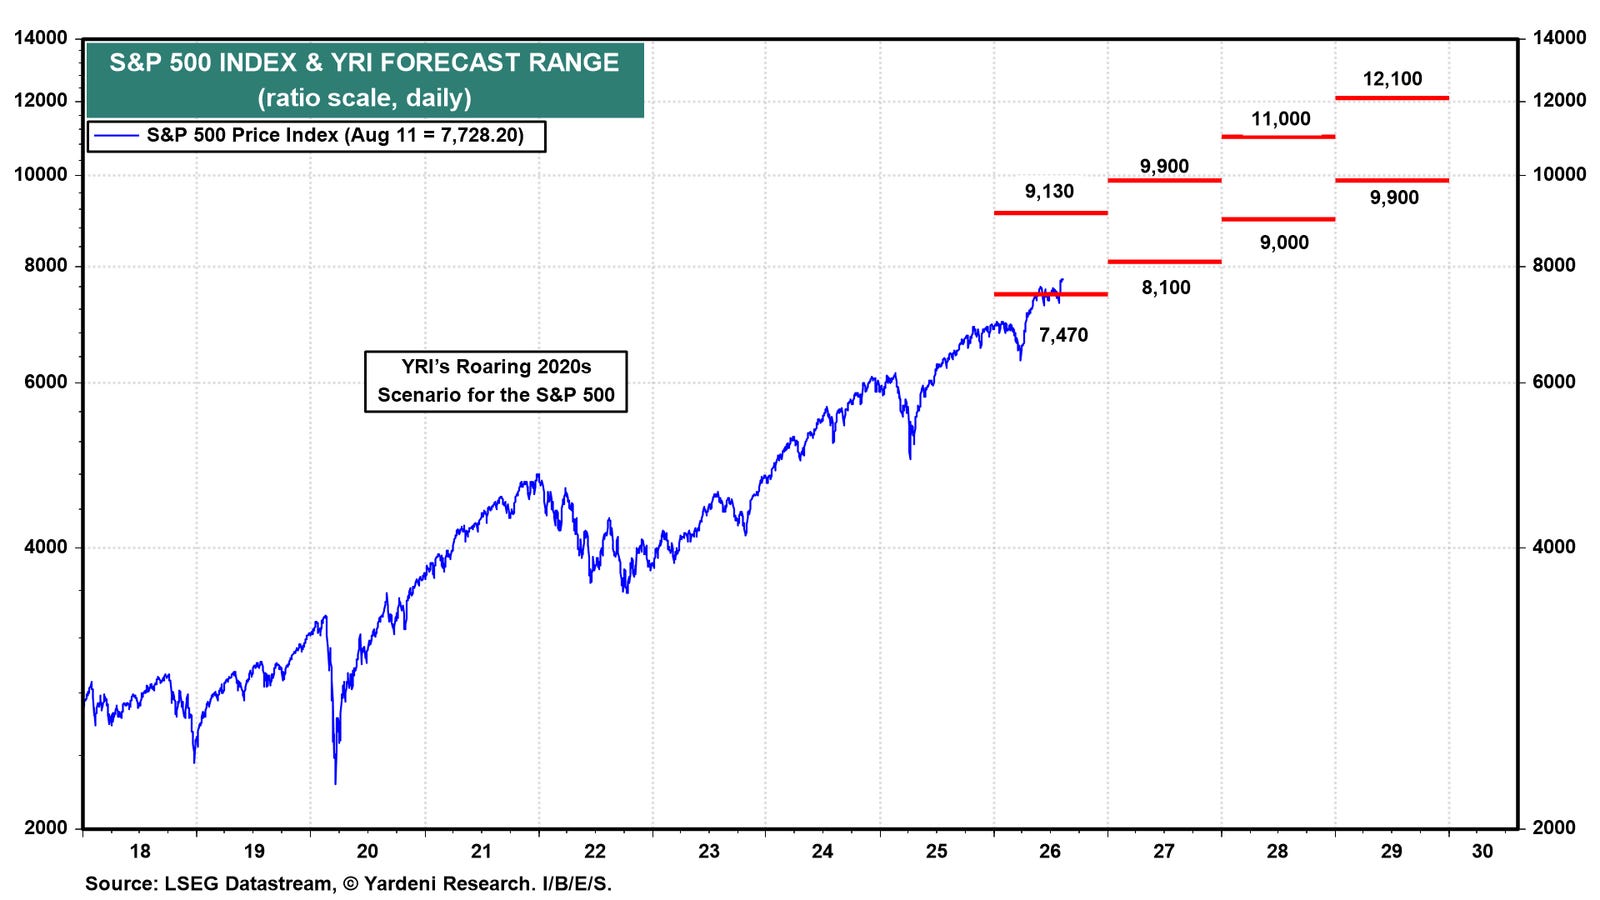
CHART: “S&P 500 Index & YRI Forecast Range” — index trajectory and Yardeni Research’s new price targets through 2030 — source: Yardeni QuickTakes, “Raising Our S&P 500 Earnings & Price Targets Outlook Due To FEMO (Fabulous Earnings Momentum),” August 11, 2026
I’ll wrap up with the data that dominated screens this morning: the July CPI came in as expected, with the headline index holding steady at 2.7% year-over-year and core inflation at 3.1%—up from the previous reading. Nothing that changes the script on its own, but enough for the market to spend the day deciding whether to feel relieved that there were no disappointments or to conclude that everything was already priced in before the opening bell.
Technical Analysis
In the “yen-bad-boy” post, I made the following comments regarding the Ibovespa:
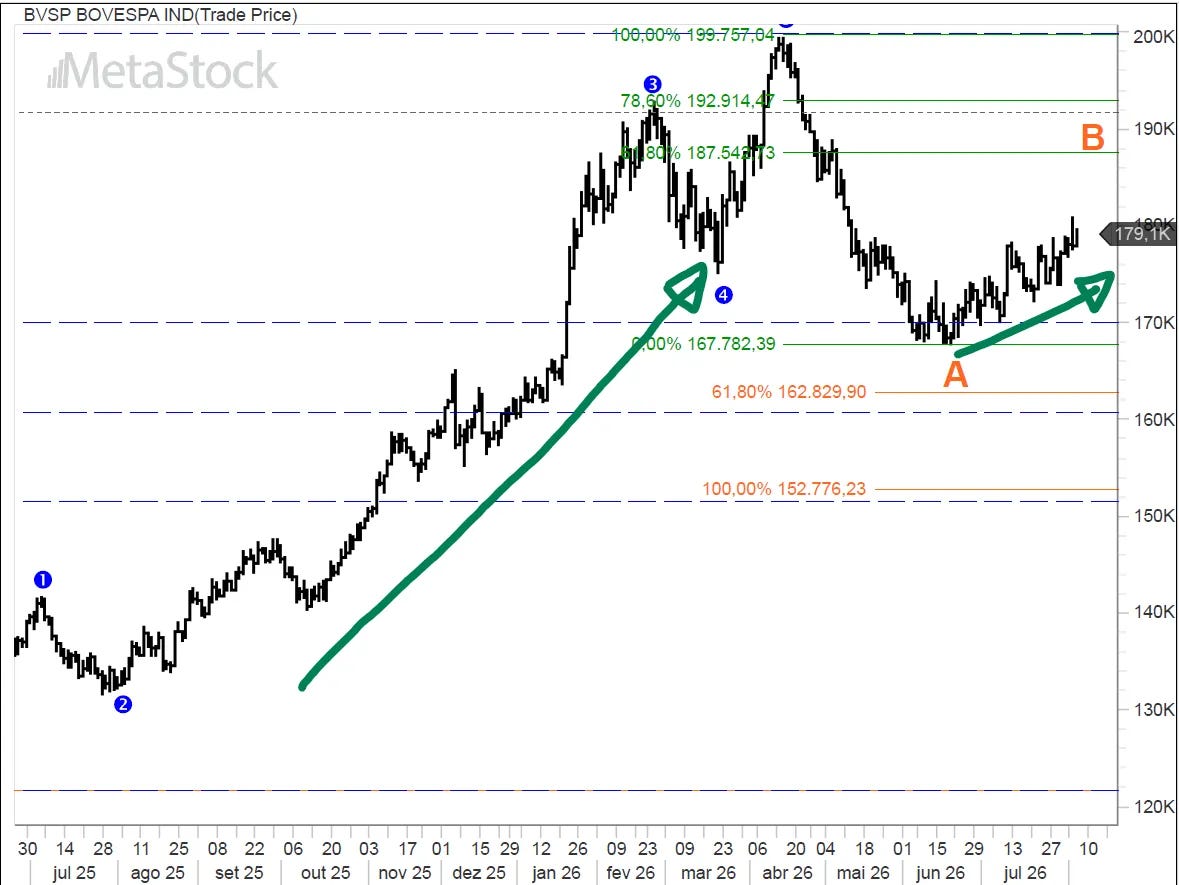
“The triangle pattern eventually broke, but without any real strength—moving with the same lethargy the market has shown since June; the difference is clearly visible in the slope of the green line. While international markets continue the rally that began this year, the Ibovespa has lost its luster. Have investors lost heart at the prospect of a ‘Lula 4’ term? A scenario that, were it to happen, would be too late anyway.”
I used to think my comments carried as much weight as those from a bank like JPMorgan—after all, it only took them announcing a downgrade of the Brazilian market from *overweight* to *neutral* for the index to drop 2.5% yesterday. If that’s the case, I’ll downgrade it to *underweight* and see what happens. Just teasing—you know me! Hahaha.
But rather than focusing on recommendations—which might well be right—being downgraded *after* the drops have already occurred, it’s better to pay attention to the chart, which, as I mentioned earlier, wasn’t showing positive signals. Although the low of 167.9 hasn’t been breached—that level is still holding—all signs point to further declines ahead. Therefore, I will assume that the orange wave B ended prematurely at 180.6k.
You may recall that I ventured a buy recommendation, albeit with considerable caution. I emphasize that B waves are treacherous: never trust them blindly; always remain wary.
Under this new hypothesis, the orange wave C could end at 160k (-4%) or around 150k (-6%); I have used orange symbols to mark this. Crucially, if the stock market falls sharply and continues its downward trajectory, reaching 119.5k, my scenario of a potential rally would be compromised, and I would have to revise my hypotheses.
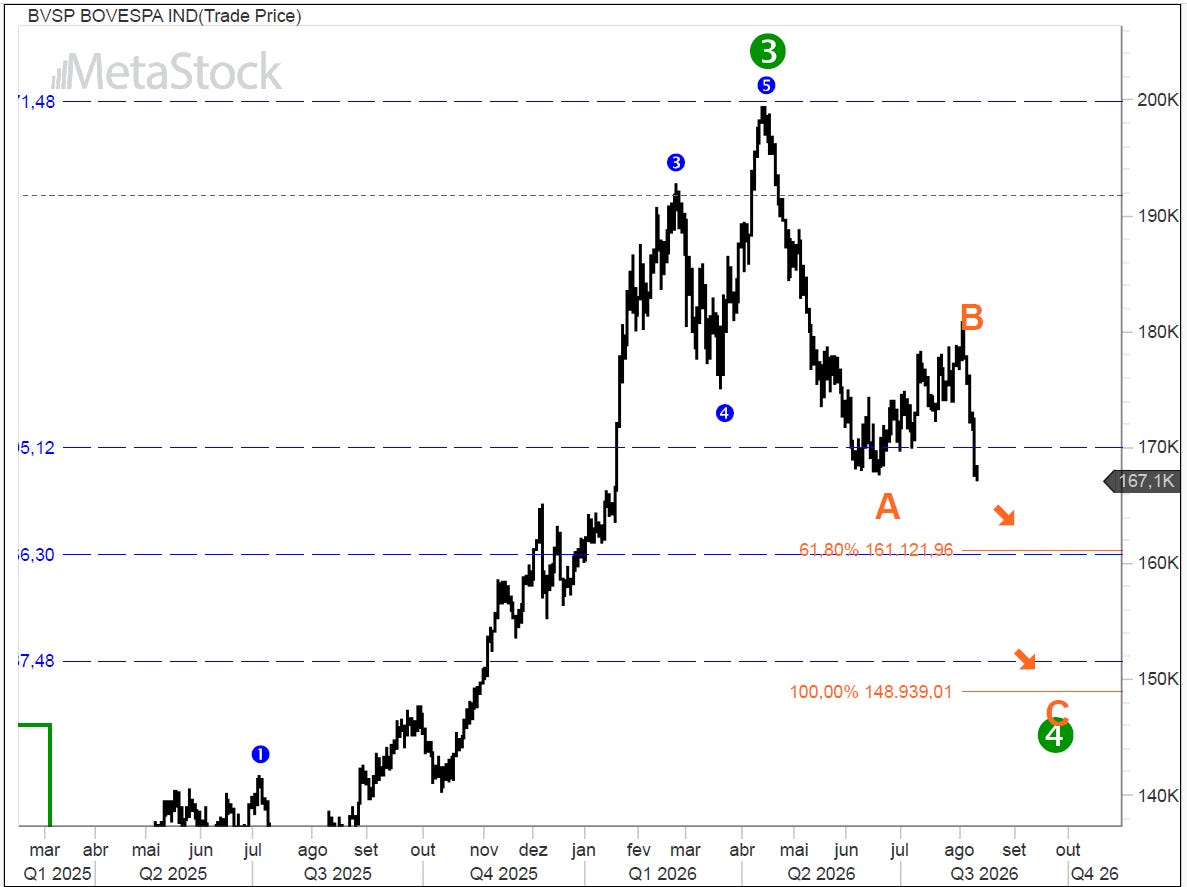
This entire sequence of events aligns with my view on the Brazilian stock market, which can be summarized as follows: it lacks a long-term directional trend; the movements observed are corrective in nature.
Just to speculate for a moment: if the market were to drop more abruptly and hit the 120k level, what would happen to the exchange rate?
The S&P 500 closed at 7,748, up 0.26%; the USDBRL stood at R$ 5.1916, up 0.29%; the EURUSD was at € 1.1523, down 0.17%; and gold was at US$ 4,413, up 1.03%.
Stay tuned!
Original Post: Click Here
This is not an investment recommendation.
About the Author of this Post: David Gotlib has 45 years of experience in investment management. An engineer from Polytechnic School of the University of São Paulo, he was one of the founders of the first Brazilian hedge fund in 1993 (AUM US$ 1 billion). Later, he was Managing Director of Deutsche Bank Asset Management (AUM R$ 2.2 billion) until the company was sold to Bradesco. He is currently the manager of his own investment portfolio and the author of the blog Acertar na Mosca, where, since 2011, he has shared his thoughts on the global economy and the financial market on a daily basis.
Comments
Nothing yet. Say the first thing.
Sign in to join the conversation.