
In Part 1, we covered the foundation stack every CPG brand needs before layering in AI. If you’re reading this first: you have a brand, you’re generating revenue, and you’re starting to feel the friction of growth. This is where most brands lose the plot — not because they chose the wrong tools, but because they never stopped to diagnose what was actually broken.
Early-stage CPG growth is usually a series of fires.
A retail buyer says yes and you scramble to figure out EDI. A campaign blows up on TikTok so you scramble to fulfill. A VC asks for a clean P&L ahead of your next round and you scramble to reconcile three months of QuickBooks entries.
Each scramble produces a tool, a work around, a new agency relationship. Twelve months later, you have a stack held together by spreadsheets, a Slack channel with 47 unread messages, and no single source of truth for anything.
This is normal. It’s also the exact moment when most brands make expensive mistakes: they add more on top of a broken foundation, or hire ahead of systems that don’t exist.
The right move is a diagnostic first — before the next board meeting, before the next tool purchase, before the next hire.
When XRC invests in a new portfolio company — or when a strategic partner asks us to assess a brand they’re evaluating — auditing the operating stack is now a core part of that process. It has to be. The question isn’t just are you — or can you be — profitable? It’s do you have the infrastructure to make good decisions fast? In 2025, those two questions are inseparable.
We look at six dimensions:
This is the foundation of everything. Before any AI tool can help, data has to be clean, connected, and current.
The red flags:
Revenue numbers in Shopify don’t match QuickBooks
COGS is either not tracked or lumped into a single line item
Marketing spend lives in a spreadsheet someone updates manually once a month
You don’t know your contribution margin by SKU or by channel
The diagnostic questions to ask at your next board meeting:
Where does our single source of truth for revenue live, and who owns it?
How long does it take us to produce a clean weekly P&L?
Do we know our margin by channel (DTC vs. wholesale vs. Amazon)?
If the answers are uncomfortable, the problem isn’t your team, it’s the architecture. No AI tool fixes bad data architecture. A clean QuickBooks setup, properly connected to Shopify and your retail reporting, fixes bad data architecture.
When it’s time to outgrow QuickBooks: If you’re doing meaningful wholesale volume, managing multiple retail accounts, or approaching $5M in revenue, QuickBooks starts to show its limits, primarily in multi-channel revenue reconciliation and inventory accounting. The good news: you don’t have to make a massive system change to get dramatically better financial intelligence.
Fincore, (an XRC portfolio company) built specifically for this gap, sits on top of your existing accounting system (QuickBooks, Sage, NetSuite, Xero) without replacing it. It automatically surfaces the “why” behind every number: variances, anomalies, and root cause analysis delivered instantly, down to the SKU level for inventory. Your board wants variance explanations. Your analysts are buried hunting for answers they should already have. Fincore eliminates that gap and does it without a full system migration.
For brands at $5M–$20M that need faster closes and cleaner board reporting, this is the right first step before NetSuite.
If you’re beyond that stage, the typical upgrade path is to NetSuite (~$2,000–$4,000/month, enterprise, worth it at scale) or Sage Intacct (~$1,000–$2,500/month, mid-market, strong for brands with retail complexity). This is a CFO-level decision — but it should happen before you feel the pain, not after.
If your team is spending hours every week pulling reports manually, reconciling spreadsheets, or waiting for someone to compile a dashboard, you’re already behind before a single decision gets made. The brands moving fastest don’t have better instincts — they have data that shows up automatically, in the right format, before the meeting starts.
In 2026, that bar is rising again. A Shopify store connected to the right AI tools means your weekly sales summary, inventory flags, and CPA shifts can be waiting for you Monday morning without anyone pulling them. The question is no longer just can you see your data — it’s does your data come to you?
The red flags:
Key metrics require manual pulls from multiple platforms
Performance data is days old by the time it reaches the right people
There’s no single dashboard that shows the full picture across channels
Someone on the team owns “the weekly report” and the whole operation depends on them
The diagnostic questions:
How long does it take to get last week’s performance data in front of the right people?
Who owns data prep, and what happens when they’re unavailable?
Could you pull a clean cross-channel snapshot right now, in under 30 minutes?
This is the harder question, and the one most brands avoid. Having fast data and making fast decisions are two entirely different disciplines. A brand can have real-time dashboards and still spend three weeks debating what to do about a drop in retail velocity.
The red flags:
The same issues appear on the Weekly Business Review ("WBR") agenda three weeks in a row without resolution - or worse, you don't have a WBR.
Decisions get discussed but ownership is unclear — nobody leaves the meeting knowing what they’re responsible for
Analysis paralysis — the team sees a signal but waits for more data before acting
Post-meeting follow-through is inconsistent or untracked
The diagnostic questions:
When a decision gets made in the WBR, how often does it actually get executed, and how quickly?
Do decisions have a named owner and a deadline, or do they live in meeting notes nobody rereads?
Are we waiting for certainty when speed would serve us better?
The WBR is the most underrated operating habit in Consumer. Done right, it compresses your decision cycle from weeks to days — not just by surfacing data faster, but by creating the ownership and accountability structure that turns data into action. We’ll go deep on WBR structure in Part 3.
Most brands at the $1M–$10M stage are operating across at least three channels: DTC, wholesale/retail, and Amazon. Each channel has different margin profiles, different data outputs, and different operational requirements.
Amazon deserves its own sentence here. It is no longer optional for most CPG categories. Whether you’re in food and beverage, personal care, or home goods, a significant percentage of your potential customers are now searching for products like yours on Amazon before, or instead of Google or Instagram. The question isn’t whether Amazon should be a channel. It’s whether you’re approaching it with a real strategy or treating it as an afterthought. The only categories where Amazon is genuinely optional are prestige beauty, luxury, and brands where channel exclusivity is core to the positioning. Everyone else should have an Amazon strategy before they have a TikTok Shop strategy.
The red flags:
No clear view of CAC and LTV by channel
Retail sell-through data arrives late or not at all
Amazon is either ignored, treated as a secondary priority, or managed without a dedicated operator who owns it end-to-end
Social commerce (TikTok Shop, Instagram) is being tested without a margin framework
The diagnostic questions:
Which channel is driving the most contribution margin and is that where we’re investing?
Do we have a single dashboard that shows performance across all channels, or are we toggling between tabs?
What’s our retail sell-through rate, and how quickly do we know when it drops?
A note on channel complexity and tools: This is the stage where a platform like Triple Whale (~$129–$299/month, DTC analytics), Crisp (pricing tiers start at $18K annually, retail data aggregation), or Stackline (~$5K+/month, Amazon intelligence) starts earning its cost. These tools are of value because they surface insights fast enough to act on them. Your data has always been there — but the process of aggregating it manually slows you down to the point where you’re not acting quickly enough.
When does each tool make sense?
Triple Whale: When you’re spending $10K+/month on paid media. At that level, even a 5% improvement in attribution or creative decisions pays for the tool many times over. Below that, Claude + manual Shopify exports is fine.
Crisp: When you’re in 200+ retail doors across multiple accounts and retail represents more than 30% of your revenue. Below that, a Google Sheet and a broker report works. The signal: if pulling sell-through data takes more than a day and arrives stale, Crisp has earned its cost.
Stackline: When Amazon represents $500K+ in annual revenue. Below that the ROI math doesn’t work unless you’re in a highly competitive category where search rank and competitor intelligence is critical.
The right time to make the transition from manual alternatives — whether that’s Claude, an intern, or an outsourced BI analyst — is when aggregating data is taking more than a few hours a week and still producing results that are a week old by the time they reach the right person. At that point you’re not saving money on the tool, you’re paying for the delay in a different way.
At the $1M–$10M stage, most brands are running a hybrid model: a small internal team supplemented by agencies or fractional operators. The audit question is whether that split is intentional or accidental.
The red flags:
Your agency is your de facto head of marketing
You don’t have internal ownership of your performance data
Creative, media buying, and reporting all live with the same agency (no checks and balances)
You’re paying agency rates for work that a $99/month tool does better
The diagnostic questions:
Which functions require human judgment that’s specific to our brand and do those live internally?
Which functions are execution-only and are we paying the right rate for them?
Where is institutional knowledge living that should be in a system?
This is where AI starts to reshape the org chart — not by replacing people, but by changing what you need to hire for. A brand with a clean operating stack and good AI tooling needs fewer coordinators and more decision-makers.
This is the most under-audited dimension at the growth stage. Most brands are generating content constantly but very few have a system for it. The result is a brand that works hard at content without compounding from it.
The red flags:
Content is produced reactively, not from a calendar with a strategic brief
There’s no UGC or influencer content system — it’s ad hoc
Email and SMS lists exist but aren’t being actively segmented or grown
Community engagement (comments, DMs, reviews) is inconsistent or delegated to an intern
The diagnostic questions:
What percentage of our content is driving measurable engagement or conversion, and do we know which?
Do we have a UGC strategy, or are we hoping customers post?
Is our email/SMS list growing as a percentage of revenue, and is it our most valuable owned channel?
Where are consumers talking about our category organically — and are we listening?
This is where community infrastructure tools become relevant, but only once you have the volume to justify them.
The signal: if your team is spending more than a few hours a week manually responding to comments and DMs, missing interactions entirely, or has no system for capturing UGC, you’re leaving both relationships and revenue on the table.
At that point, a tool like Nectar Social (an XRC portfolio company) earns its cost. It pulls all your social conversations (comments, DMs, Reddit threads, influencer threads, customer service interactions) into one place, uses AI to handle routine responses automatically, and flags high-intent interactions for your team. The human job shifts from answering every message to directing the strategy.
When does it make sense? When you have a meaningful social following and community engagement is generating more volume than your team can respond to consistently: ~$2M+ in revenue with an active organic social presence. Below that, a disciplined manual process works. Portland Leather Goods used it to drive $2.7M in revenue through social engagement alone — we cover the full story in Part 3.
The audit tells you where you are. This tells you where you’re going.
Below are two versions of a CPG brand at the same channel complexity — DTC-primary, an Amazon presence, and one mass retail partner. Same stage. Same complexity. Very different operating models. Neither is wrong. But the gap in cost and leverage between them is significant and most founders don’t realize they have a choice.
The revenue range for a brand at this channel stage is typically $3M–$8M, but the tools and org model are driven by the channels you’re in, not the number on your P&L. A brand doing $2M across three channels has more operational complexity than a brand doing $5M purely DTC. Use the channel mix as your guide, not just the revenue.
You built deliberately. Small team, clear tool choices, AI from day one.
2–3 founders, AI-augmented, fractional where needed. This is the brand that made intentional choices from the start — resisting the urge to hire before tooling, using AI to fill gaps that would otherwise require a full-time role.
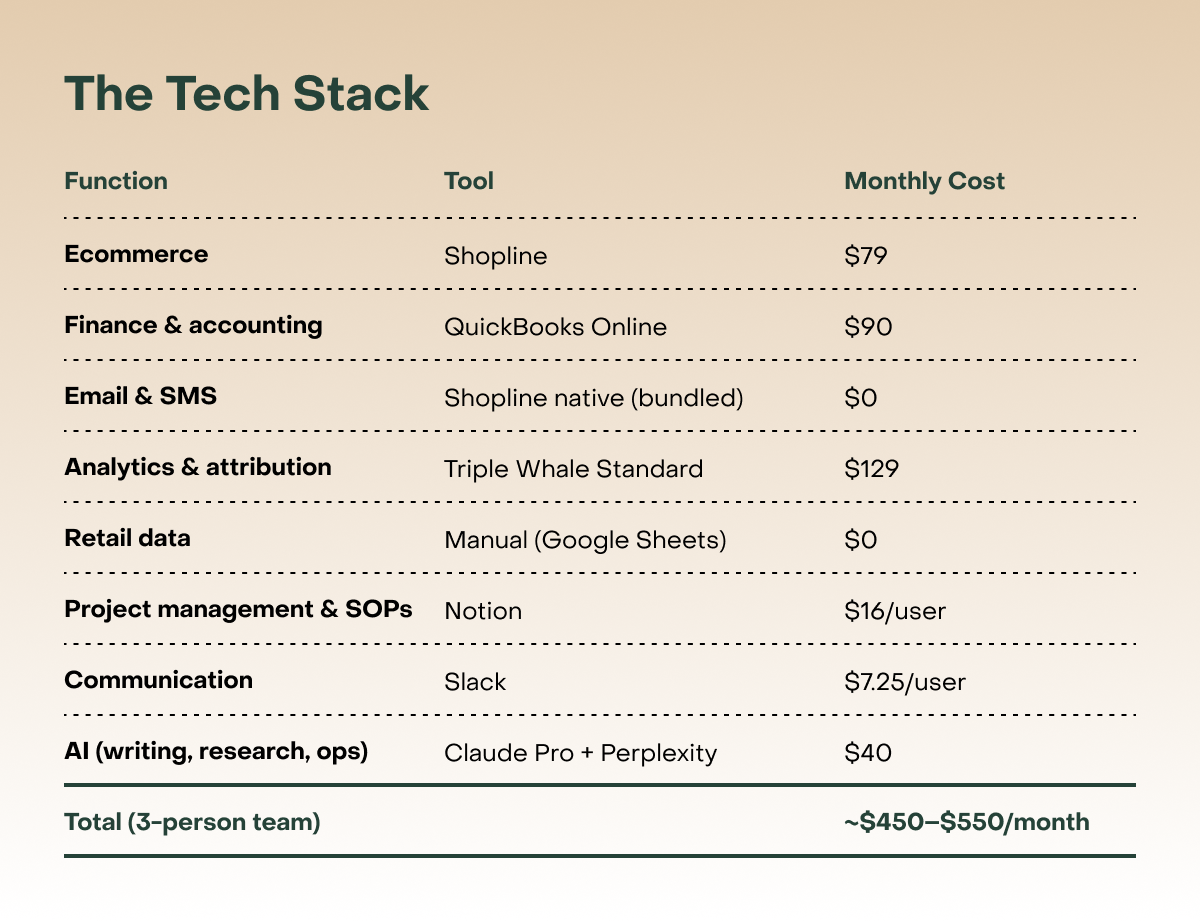
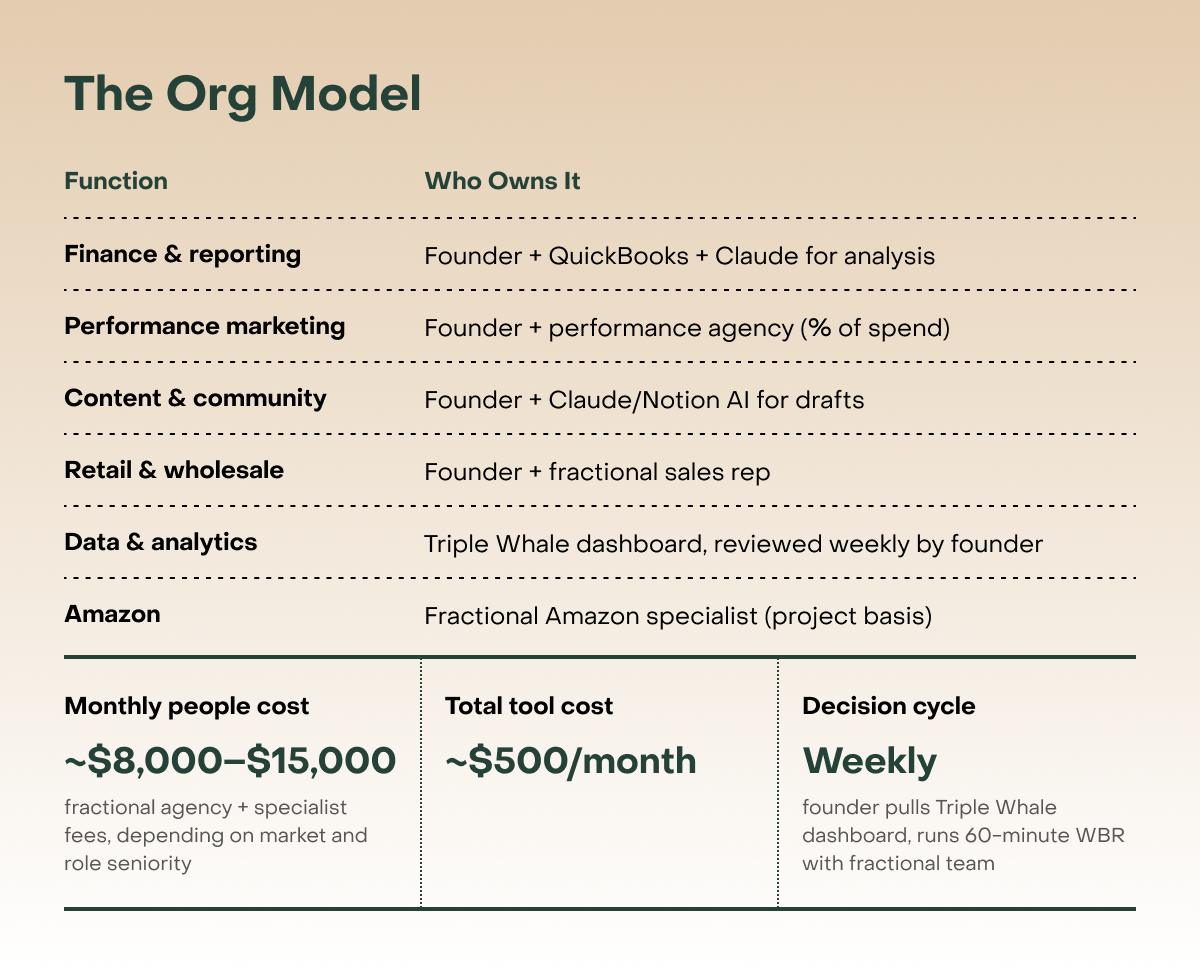
Monthly people cost: ~$8,000–$15,000 (fractional agency + specialist fees, depending on market and role seniority)
Total tool cost: ~$500/month
Decision cycle: Weekly — founder pulls Triple Whale dashboard, runs 60-minute WBR with fractional team
You grew fast. The team and tools accumulated. It works, but it costs more than it should.
Early FTEs, agency relationships, more channel complexity. This is the brand that responded to growth by hiring, because hiring felt like progress. The stack accumulated alongside the team. It’s not broken, but it’s expensive, slow, and harder to change than it looks.
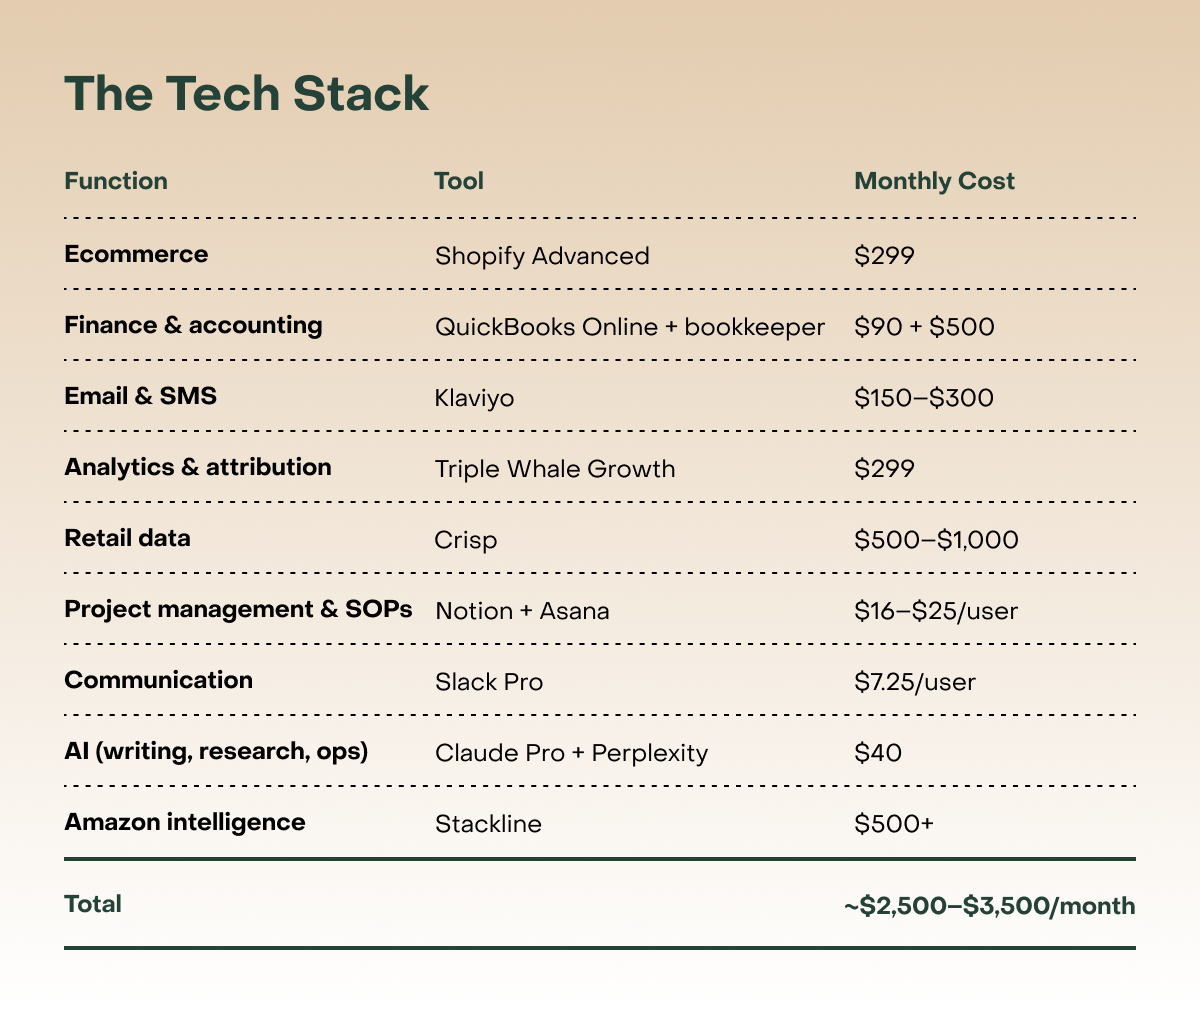
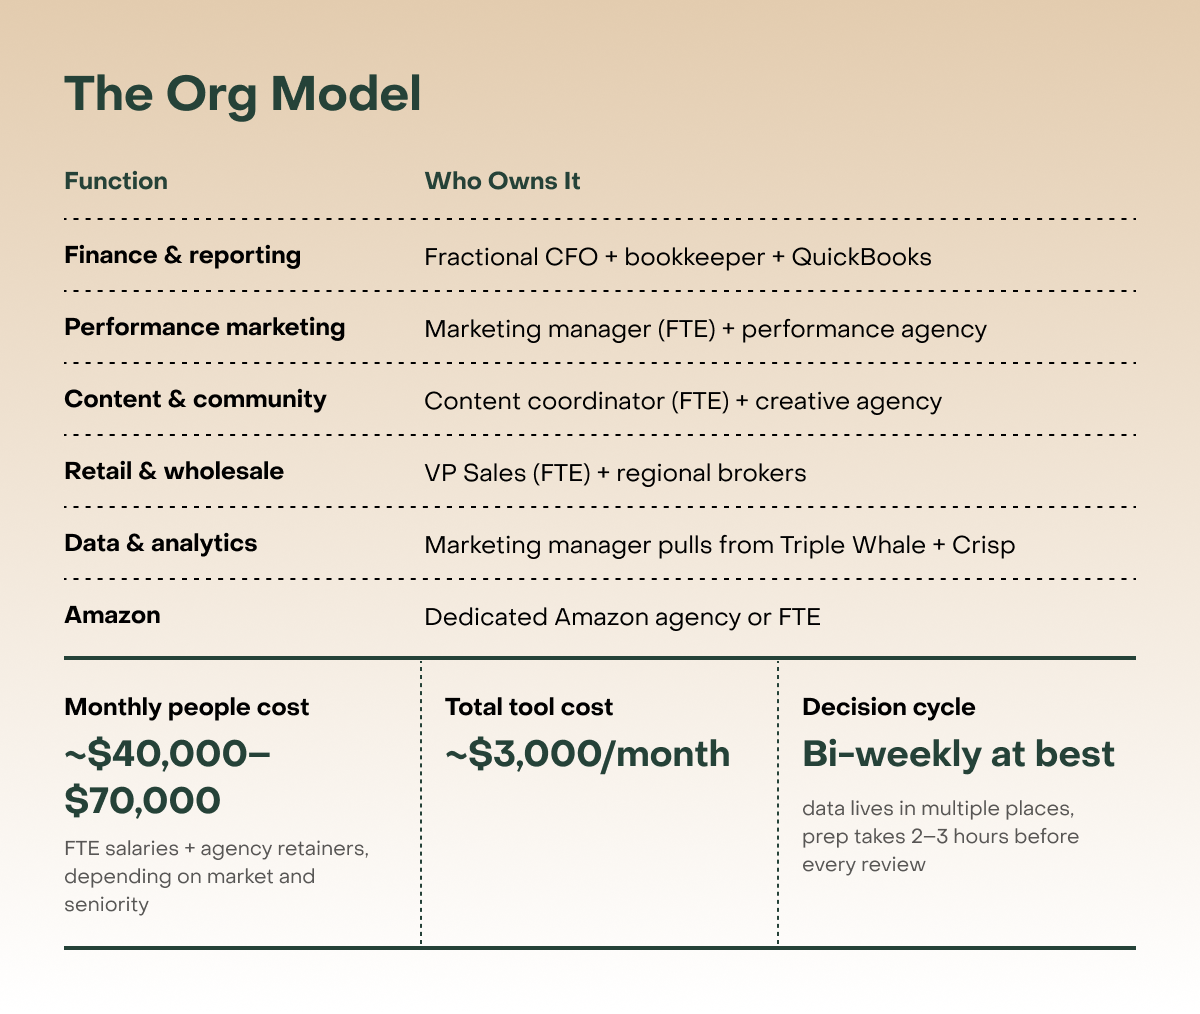
Monthly people cost: ~$40,000–$70,000 (FTE salaries + agency retainers, depending on market and seniority)
Total tool cost: ~$3,000/month
Decision cycle: Bi-weekly at best — data lives in multiple places and prep takes 2–3 hours before every review
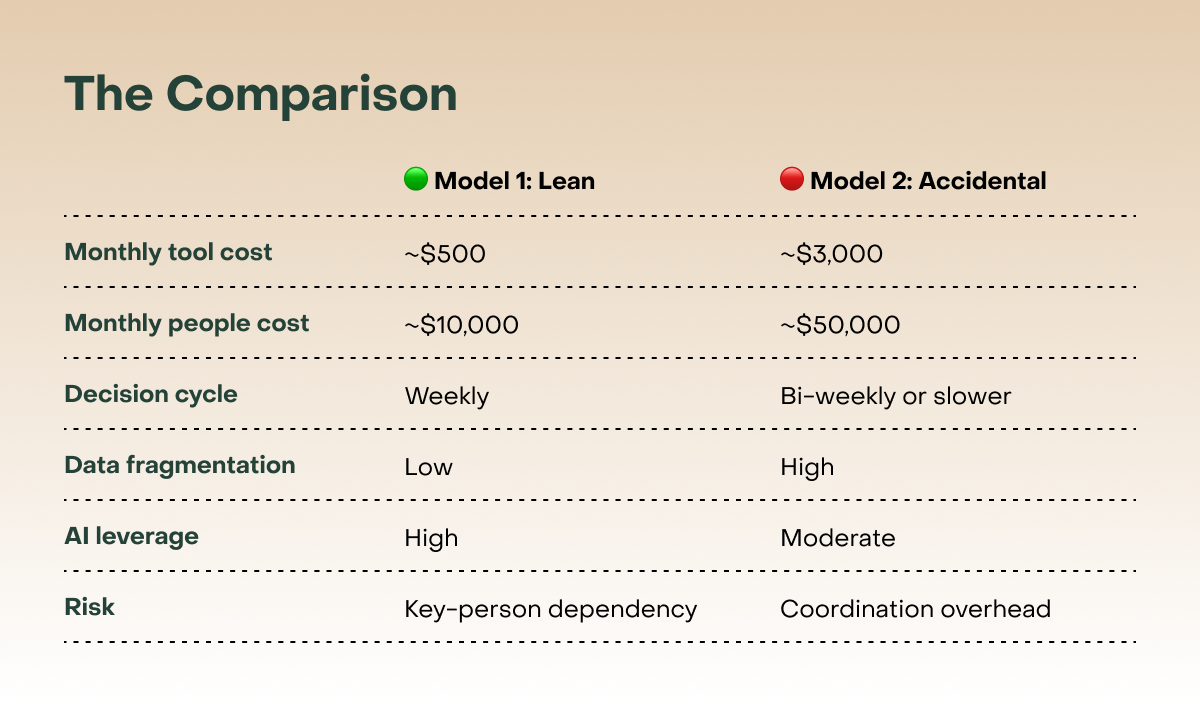
The Accidental Model isn’t wrong — at a certain point, FTEs and agency relationships are the right answer. But too many brands arrive there by accident rather than by design, adding headcount to solve problems that a $300/month tool would have prevented.
Download the Operating Audit Workbook: We've built a workbook that walks you through the six-dimension operating audit. Use it before your next board meeting, fundraise, or major hiring decision. It takes 90 minutes to run as a live working session with your team.
Download it here →
The brands compressing decision cycles fastest right now look more like Model 1 than Model 2, even at $10M+ in revenue. That’s the operating thesis of this entire series.
Each row below is a dimension of your operating stack — score yourself independently on each one, then look at the pattern across all six.
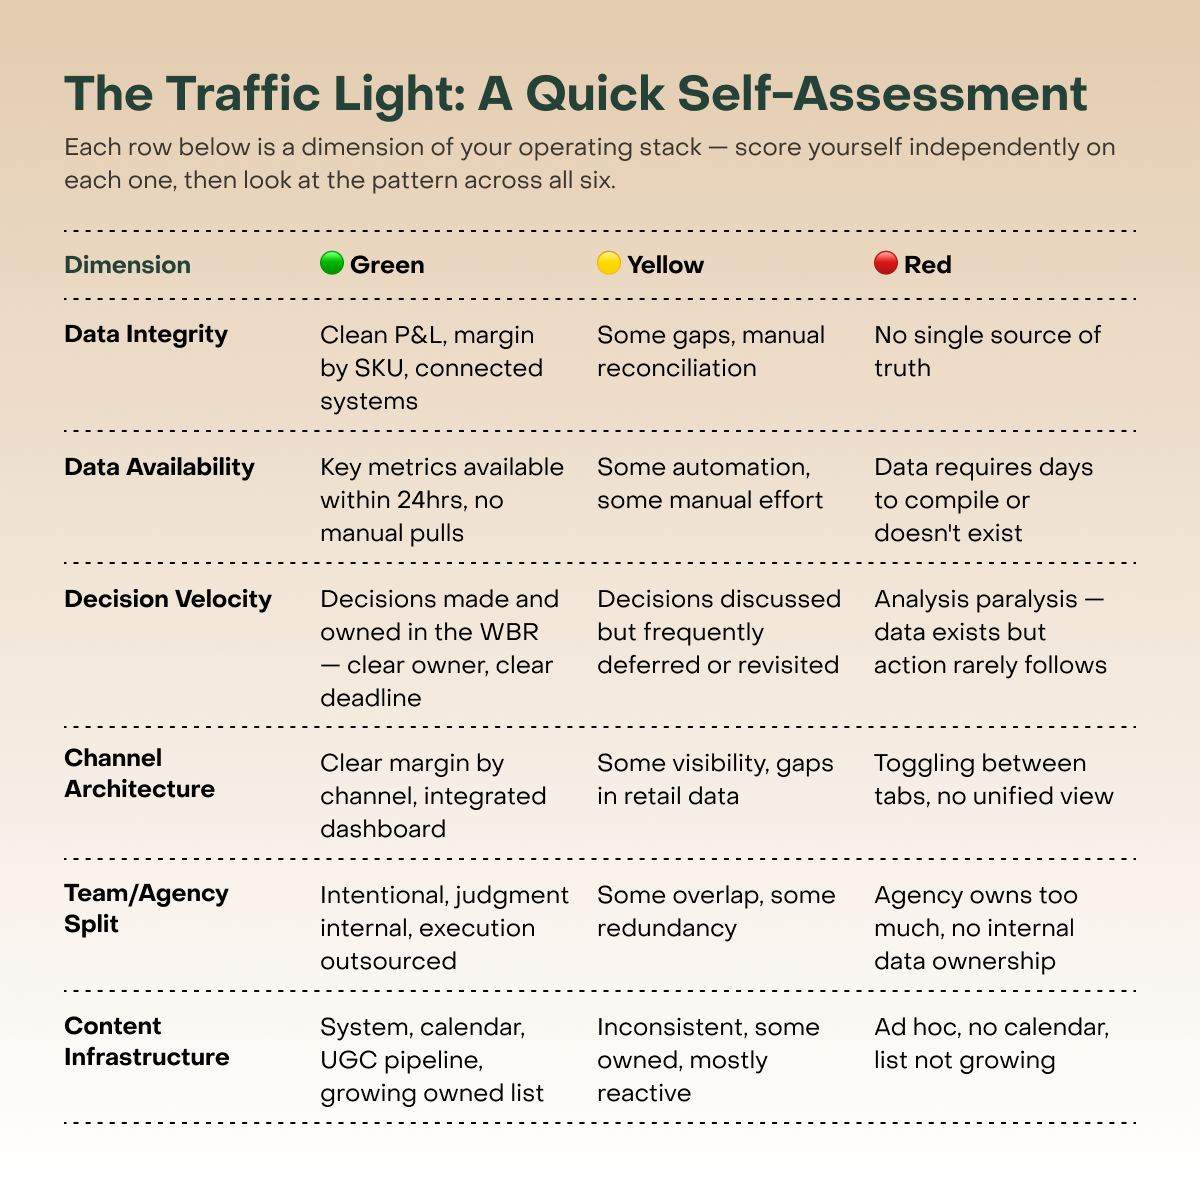
How to read your results — look at the pattern, not the average:
If you have two or more reds: The next tool you buy will not help you. Fix the architecture first.
If you’re mostly yellow: You’re at the right stage to start layering in AI tools strategically. Part 3 is for you.
If you’re mostly green: You’re either further along than most or you’re being generous with yourself. Either way, the question is now about speed and scale, which is exactly what Part 3 covers.
A framework on paper is only useful if someone runs it. Here’s how we recommend doing it — and how often.
The Format: A Working Session, Not a Presentation
The audit is most valuable when it’s run as a live working session — ideally 90 minutes with the founding team, a board member or investor, and whoever owns operations day-to-day. It should not be a slide deck someone presents. It should be a conversation with honest answers and real tension in the room.
The best setting is a board meeting or offsite where there’s already dedicated time for strategic thinking, not a standing Tuesday sync squeezed between two other calls. If you’re an investor or board member reading this: the next offsite is the right moment. Come in with the five dimensions printed out, assign a color to each one as a group, and let the disagreements surface. The disagreements are the data.
A note for corporate incubators and innovation teams: If you're running this inside a larger organization — a Colgate, a Unilever, a strategic that's incubating a new brand — the dynamics are different but the framework applies. The most common friction point: stack decisions are often made by IT rather than operators, and the WBR doesn't exist because everything flows through a monthly business review cadence. In that context, the most valuable outcome of this session isn't the traffic light scores — it's getting alignment that the operating model of a new brand requires different infrastructure than the parent company's. That conversation is worth having before the brand scales, not after.
0–15 min: Score each dimension independently (everyone in the room does this silently, on their own)
15–45 min: Compare scores — discuss any dimension where there’s more than one color of disagreement
45–70 min: Prioritize the two or three reds or yellows that are most urgent or highest leverage
70–90 min: Assign owners and a 30-day action for each priority — not a roadmap, just a next step
The output isn’t a perfect plan. It’s clarity on what’s most broken and who’s fixing it.
This is not a one-time exercise, but it also shouldn’t be a quarterly ritual that becomes rote. Here’s how to think about cadence:
Run it once at the start — ideally before your next fundraise, retail expansion, or significant hiring push. This is your baseline. It tells you what you’re actually working with before you add complexity.
Run it again at each major inflection point:
Entering a new channel (first retail account, launching on Amazon, going into a major retailer)
Crossing a revenue threshold ($1M, $5M, $10M — the stack that got you here rarely gets you to the next stage)
Before a fundraise, VCs will conduct their own version of this diligence; you want to have already done it yourself
After a significant team change — a new COO, a CFO hire, or losing a key operator changes your architecture whether you plan for it or not
Use the WBR as your ongoing signal — between formal audits, a well-run weekly business review will surface the early signs of a dimension turning yellow before it turns red. The audit is the annual physical. The WBR is the weekly check-in that tells you when something needs attention.
The brands that do this well don’t treat the audit as a chore. They treat it as a competitive advantage because most of their peers are flying blind.
Every red or yellow in the audit points to the same underlying problem: a place where your business is making decisions slowly, with bad data, or not at all:
A brand with a red in Data Integrity is making financial decisions without clean numbers
A brand with a red in Decision Cycle Speed is reacting to a problem with last month’s numbers
A brand with a red in Channel Architecture doesn’t know which part of the business is working
That’s what we mean when we say the audit tells you where the decisions are slowest — not as a measure of time directly, but that every dimension of weakness shows up as a delay between a signal and an action (or plan of action).
In Part 3, we go inside the weekly business review, the performance marketing dashboard, and the AI tools that tighten that loop.
This audit framework is something we now run with our portfolio companies and have used with strategic LPs and partners as part of operational diligence on consumer brands. Whether it’s financial infrastructure (Fincore), community and social (Nectar Social), or conversion optimization (Gigit.ai) — we’re actively working with brands on all of these.
For founders: use it before your next board meeting.
For investors: bring it to your next portfolio offsite.
For corporate teams: use it to pressure-test whether your new venture has the infrastructure to move at startup speed.
If you want to go deeper on any of these dimensions, we’d welcome the conversation at dianam@xrcventures.com.
XRC Ventures has been working at the intersection of consumer and technology since 2015. This series reflects what we’ve learned building alongside the operators doing it.
No posts
Comments
Nothing yet. Say the first thing.
Sign in to join the conversation.