
Parts 1 and 2 were for brands building their foundation and diagnosing what’s broken. Part 3 is for brands that have crossed the other side of that — you’re at $10M, maybe $50M, you have a team, a tech stack, investors, and a board. You’re in retail doors or on Amazon. You have an agency relationship, and spending $$$ on paid media.
The question is no longer what tools you need. It’s how to use AI to go faster inside an operation that’s already running. And if you’re still carrying some of the reds from the Part 2 audit, you’re not alone — scale doesn’t automatically fix foundation problems, it just makes them more expensive.
Before diving in, a quick orientation based on where you’re coming from.
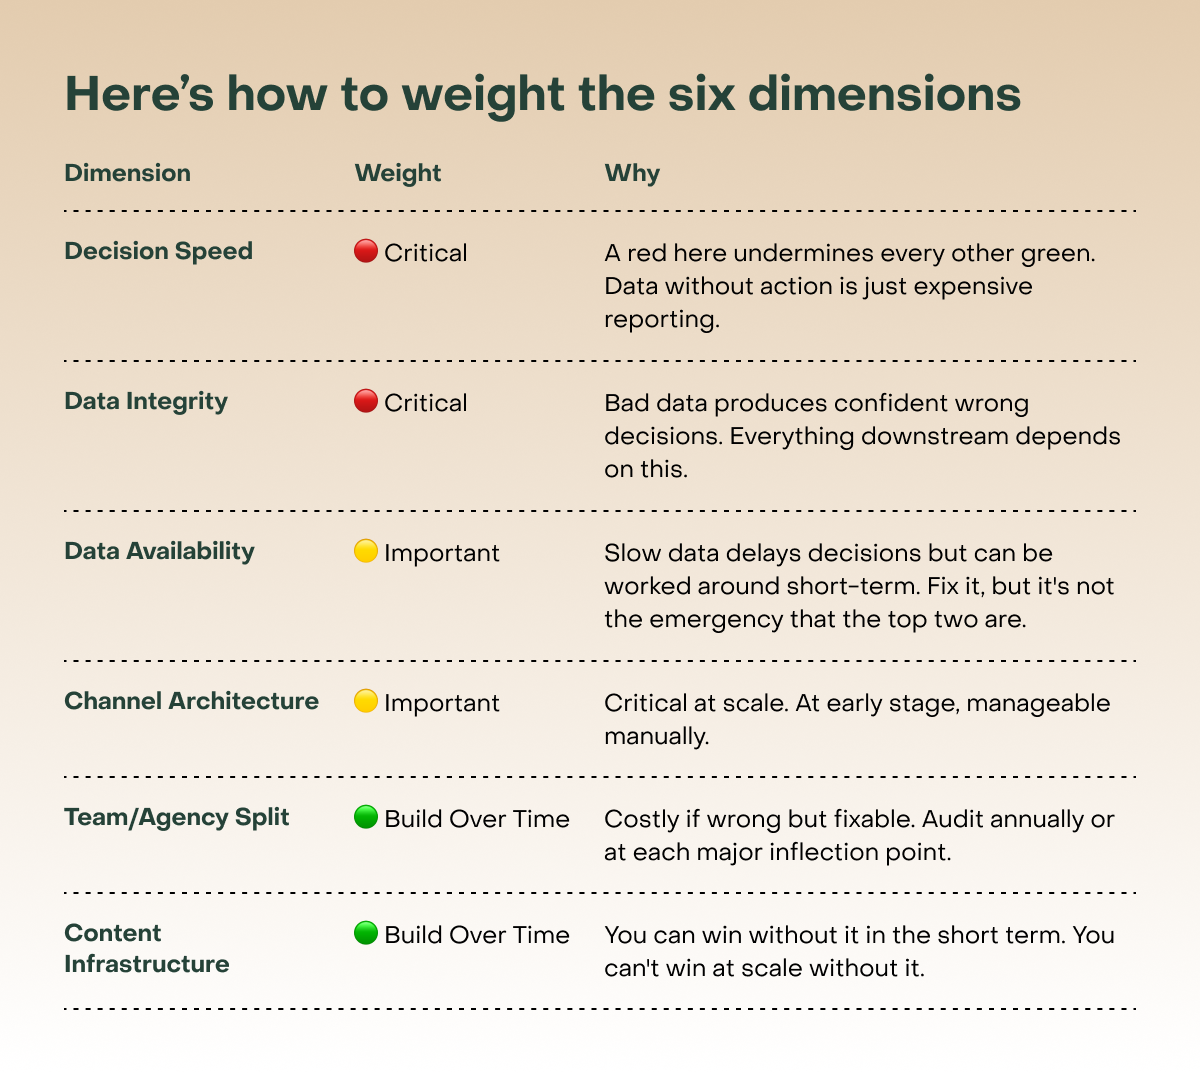
If you ran the Part 2 audit: Don’t just count your colors — not all six dimensions are created equal. A brand can be green across Data Integrity, Channel Architecture, and Content Infrastructure and still be “broken” if Decision Speed is red. Fast data that doesn’t produce timely decisions is one of the most expensive operational traps in CPG, and the hardest one to see from the inside.
Here’s how to weight the six dimensions:
A simple benchmark for what “fast enough” looks like on Decision Speed:
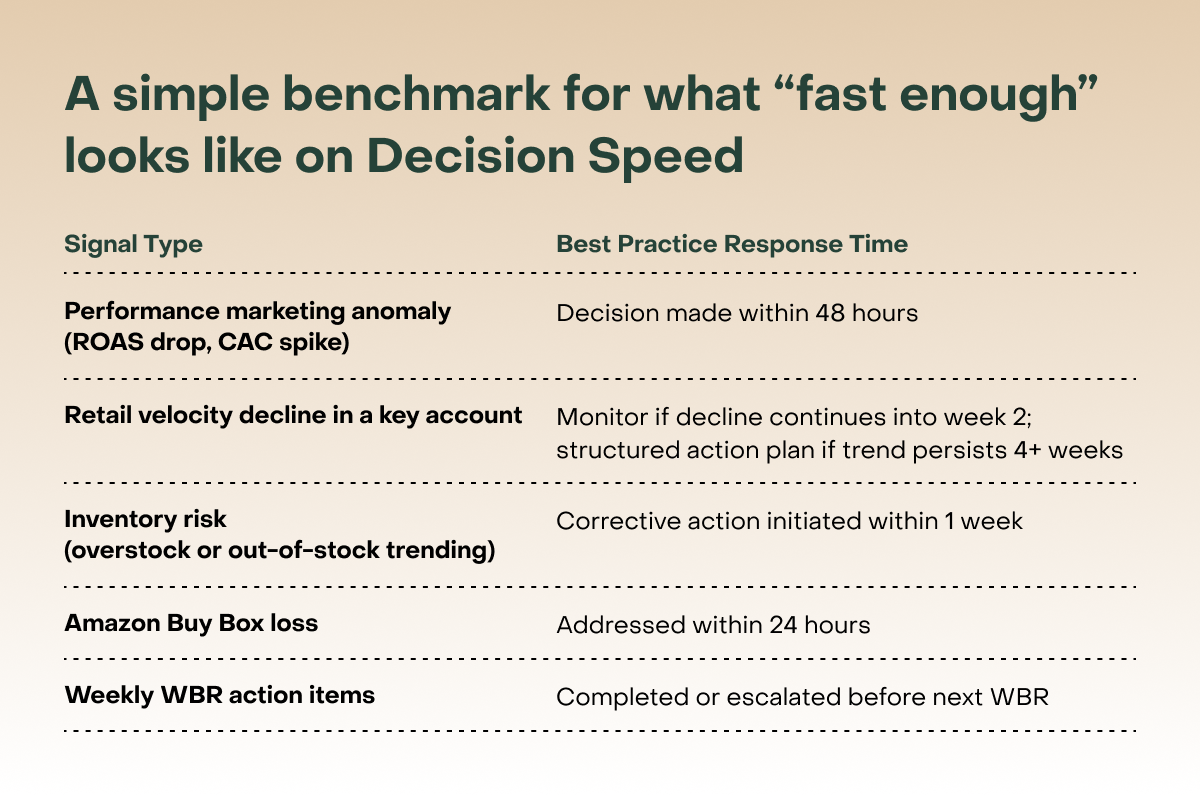
If your actual response times are 2–3x these benchmarks, Decision Speed, is your constraint — not your data, not your tools. Skip ahead to the WBR section — that’s where to start.
If you’re entering Part 3 a different way — you acquired a brand, you’re incubating inside a large organization, or new leadership just walked in the door — the audit may not have happened yet. The complexity didn’t build gradually. It arrived all at once. The tools exist, the data exists, but nothing feels connected. This is the inherited stack problem and it’s common enough that it deserves its own section at the end of this piece.
Either way, the answer starts in the same place: your operating rhythm.
In Part 2, we introduced the WBR as an ongoing signal between formal audits — the habit that tells you when something is turning yellow before it turns red. At the $10M–$50M stage, the WBR becomes the most important meeting in your company. It’s also the one most likely to be broken.
Here’s what a broken WBR looks like at this stage:
It takes 2–3 hours to pull the data before the meeting even starts
Half the meeting is spent debating whose numbers are right
The conversation is backward-looking (”here’s what happened last week”) rather than forward-looking (”here’s what we’re doing about it”)
It ends without clear decisions or owners
The same issues appear on the agenda three weeks in a row
A well-run WBR at scale does one thing: it compresses the time between a signal and a decision. That’s it. Everything else — the agenda, the dashboard, the attendees — is in service of that.
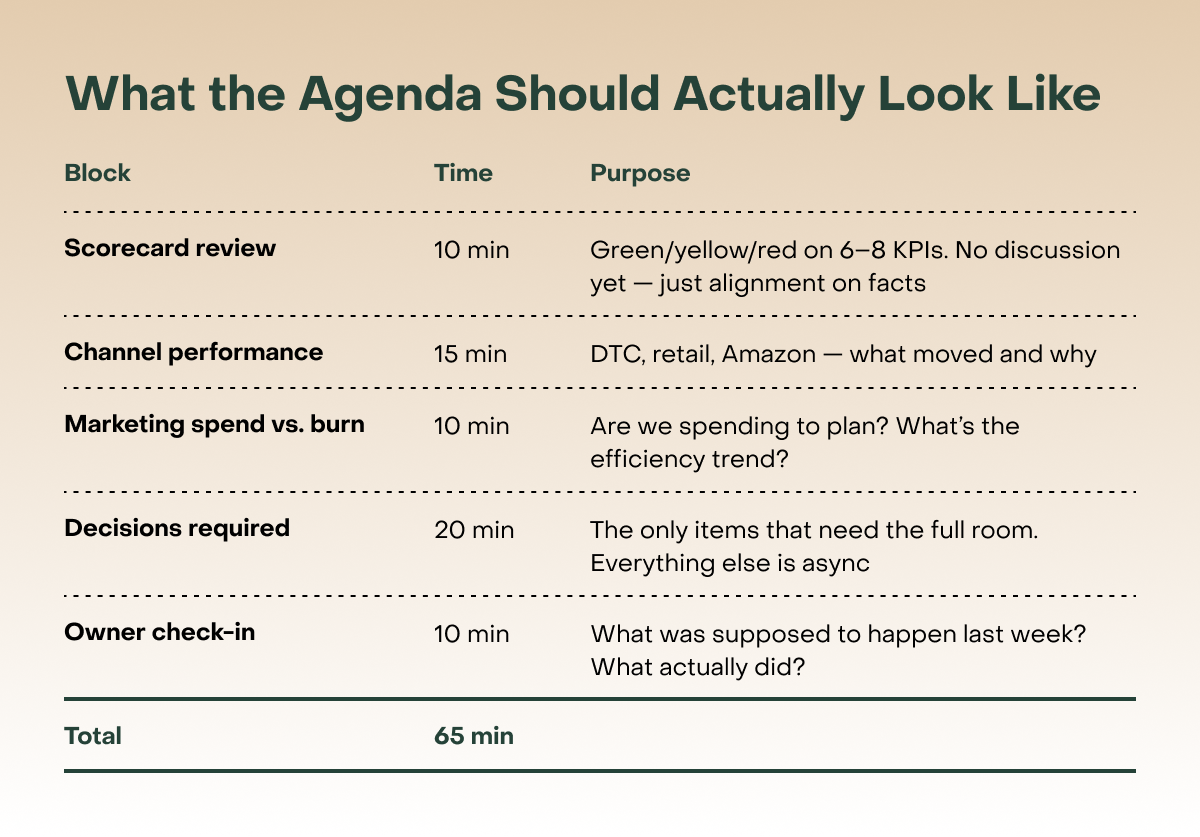
The scorecard is the unlock. When your 6–8 KPIs are agreed upon, visible in real time, and owned by specific people — the meeting changes from a reporting session into a decision session.
One rule that changes everything: every functional owner submits their scorecard color, trend arrow, and context note by end of day the day before the WBR. No exceptions. When updates arrive in writing before the meeting, people come prepared, discussion is focused, and the meeting moves faster. When updates are shared verbally for the first time in the room, people ramble, context gets lost, and you spend the first 20 minutes doing what should have happened the night before.
But here’s where the thinking on AI needs to evolve: AI doesn’t just support decisions. For a growing category of decisions, AI should be making them autonomously — freeing your executive team to focus on the decisions that actually require human judgment (read our piece on AI Guardrails here).
The best-run brands know the difference. Here’s how to think about it:
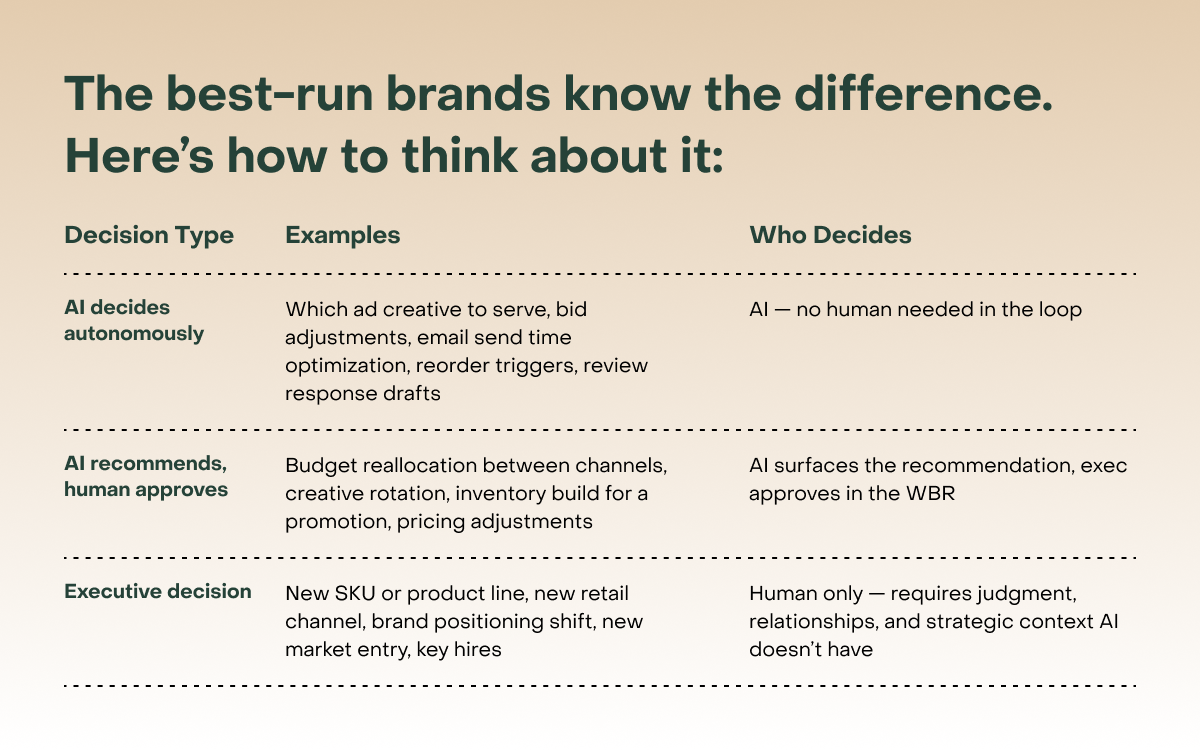
Most brands are making two expensive mistakes:
1. They’re making AI decisions manually — wasting hours on things that should run on autopilot
2. They’re trying to make executive decisions with AI, substituting data for judgment in places that require both.
The WBR is where this gets sorted. AI handles the first category before the meeting even starts. The second category gets surfaced as a recommendation for the room to pressure-test. The third category is what the meeting is actually for.
The CPG Scorecard
Here are four of the most universally relevant KPIs to anchor your scorecard — validated by operators who’ve run this at scale at $100M+ brands:
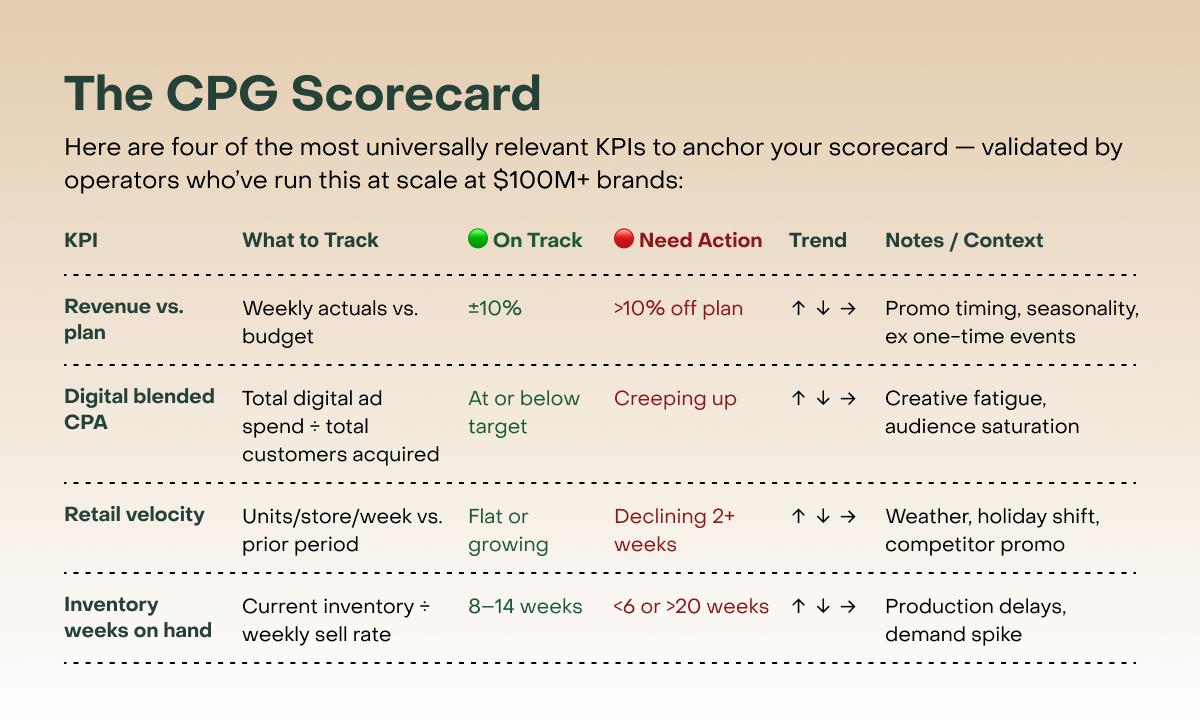
A few notes on using this table:
No yellow: intentional. Yellow creates inaction and, in high-stakes environments, leads teams to lobby leadership before the meeting rather than surface problems honestly. Green and red forces radical candor. A red isn’t a fireable offense — it’s a signal that needs a plan.
Trend and context columns: a single red week is rarely the story. Document one-time events (snowstorm, shifted Easter, competitor promo) before the meeting so the team distinguishes a blip from a pattern without losing 20 minutes debating it.
Retail velocity: a single week of decline without a clear external cause is noise. Monitor closely if it continues into week 2. Structured action plan if it persists four weeks.
Amazon Buy Box: belongs in anomaly detection, not the scorecard. If you’re below 95%, something is broken. Set a hard alert and treat it as an emergency.
Start with five KPIs, not ten. Add the others as your data infrastructure catches up.
These are guidelines, not hard rules. Thresholds vary by category, channel mix, and stage. Calibrate to your business.

Where AI Plugs Into the WBR
At this stage, the manual effort of preparing for the WBR is often where the most time is lost. This is exactly where AI creates leverage — not by making decisions, but by eliminating the preparation tax so the meeting can focus on judgment.
Automated scorecard: Tools like Triple Whale (DTC), Crisp (retail), and Stackline (Amazon) can feed a single live dashboard that populates your WBR scorecard automatically. If you’re on Shopify, the AI Toolkit takes this further — instead of waiting for a dashboard to refresh, you can ask an agent directly: ‘show me revenue vs. plan for last week’ or ‘which SKUs are trending down?’ The data comes to you in plain language, before anyone opens a tab.
No manual pull, no reconciliation debate.
If you’ve been using the Claude export workaround from Part 1 — pasting weekly data exports for analysis — this is the moment that approach breaks down. When you’re managing multiple channels and the manual prep is taking more than 30 minutes a week, the paid tool has earned its cost.Anomaly detection: The best stacks flag what’s unexpected before the WBR, not during it. Most tools have native alerting that brands never turn on. Start there. (Full setup guide — three paths from free to fully automated — included in the WBR Scorecard Template download above.)
AI-generated summaries: Claude can take a week’s worth of performance data and generate a first-draft narrative — “here’s what changed, here’s the likely cause, here’s what needs a decision.” A human edits and owns it. The AI eliminates the blank page.
Monday morning action: Before your next WBR, ask whoever prepares the data how long it takes them. If the answer is more than 30 minutes, that’s your first intervention — not a new tool, just a documented process for what gets pulled, from where, and in what order. That alone will change the meeting.
The WBR surfaces a signal. But a signal isn’t a solution. Between “we have a problem” and “we’re signing up for a tool” is a decision tree most brands never run, and it’s why so many AI implementations fail.
Here’s what it should look like:
Step 1: The WBR flags something. A metric turns red. The scorecard does its job and surfaces the signal.
Step 2: Is it worth acting on now? Not every red is an emergency. Use the dimension weighting from the audit — is this a Critical issue or a Build Over Time issue? If it’s Critical, it goes on the decisions agenda this week. If it’s not, it goes on a watch list with a timeframe or inflection point attached to surface it.
Step 3: Diagnose the root cause This is the most important step! Before reaching for a tool, ask: is this a people problem, a process problem, or a data/tool problem?
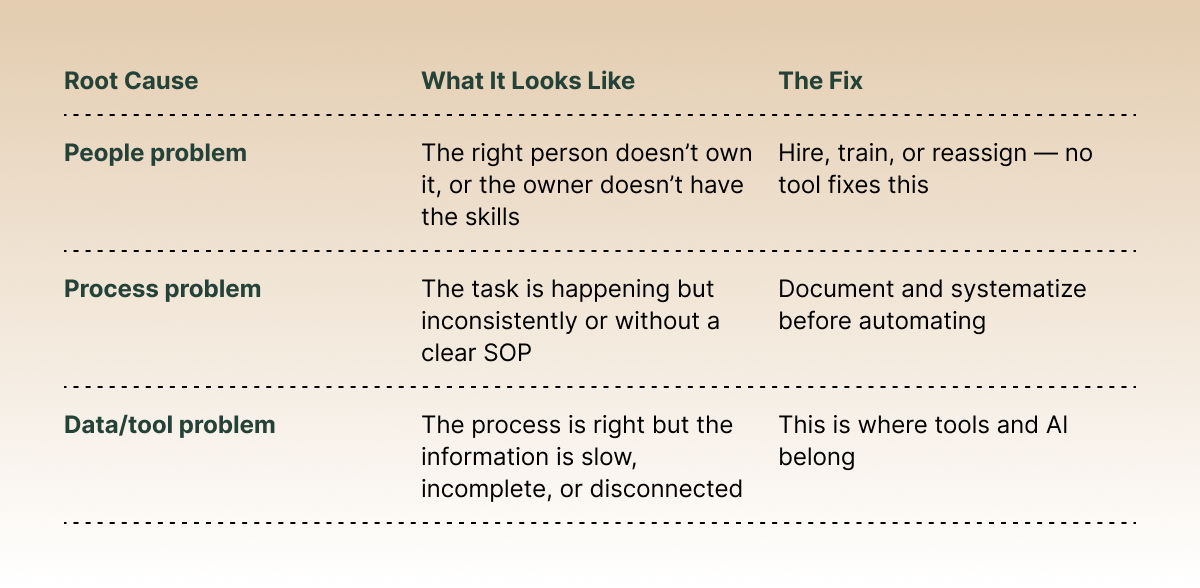
A broken process running faster is still a broken process.
Step 4: If it’s a data/tool problem, can you solve it with what you have? Ask whether Claude, Notion, or a manual workaround can close the gap. At an early stage, the answer is usually yes and buys teams 60–90 days with a free workaround while you properly evaluate a paid solution. This is almost always the right call.
Step 5: If you need a third-party tool, define the job first. What specific output do you need? How does it connect to your stack? What does success look like in 90 days? If you can’t answer these, you’re not ready to buy.
Step 6: Evaluate and decide Now you’re ready to look at specific tools — with a clear problem definition, a baseline to measure against, and a success criteria defined.
The three use cases below are brands that ran this process and arrived at a tool decision grounded in a real diagnosis.
The signal: Response times on social are slow: UGC is happening but it’s not being captured. Community engagement is inconsistent. The WBR flags it — but whose problem is it, and what kind of problem is it?
The diagnosis: It’s not a people problem — the team cares and is trying. It’s not purely a process problem — there’s no process to fix because the volume has outgrown any manual process. It’s a data/tool problem– the team needs infrastructure to keep up with the volume without adding headcount.
The decision: Could Claude or a Notion database solve this? Partially — Claude can draft responses, but it can’t monitor multiple social channels in real time or flag high-intent conversations automatically. This is a genuine tool gap.
Most brands at this stage have the same problem: customers are commenting, DMing, and tagging constantly, and the team can’t keep up. Someone asks a question before buying and doesn’t get a response for six hours. A loyal customer posts a great photo and nobody acknowledges it. Every one of those is a missed sale or a missed relationship. The fix isn’t hiring more people, it’s infrastructure.
Portland Leather Goods: What scaling community actually looks like
Portland Leather Goods started in a garage obsessed with craft and customer experience. Today they’re a $200M+ global brand with one of the most passionate communities in consumer. But as they grew, the volume of social conversations outpaced their team’s ability to keep up. Response rates hovered around 40%. Response times stretched past six hours. UGC was happening — customers loved the product — but there was no system to capture it and put it to work.
Instead of hiring more community managers or handing it off to an agency, they built infrastructure. Using Nectar Social (an XRC portfolio company) their Social, Community, Influencer, and CX teams now work from one unified inbox. AI handles the routine responses automatically. The team focuses on the conversations that actually need a human — high-intent buyers, creator relationships, escalations.
Four months in:
$2.7M in revenue driven directly through social engagement
Response rate jumped from ~40% to 90%+
Response time dropped from 6+ hours to under 1 hour
$3M+ in earned media value from a UGC program that now feeds their paid ads
Real-time competitor insights surfaced automatically from social conversations
The lesson isn’t that PLG found a magic tool. It’s that they stopped treating community as a cost center and started treating it as a revenue channel, and then built the infrastructure to run it that way.
Monday morning action: Pull your last 30 days of social comments and DMs. How many went unanswered for more than two hours? That number is your baseline and your opportunity. If the answer is more than 20%, you’re leaving both relationships and revenue on the table every single week.
The signal: ROAS looks fine. New customer growth is flat. The WBR flags the discrepancy.
The diagnosis: Not a people problem — the agency is competent. Not a process problem. It’s a data problem: blended ROAS is masking the difference between new customer acquisition and retargeting.
The decision: Claude can surface this gap manually from a CSV export. But at $200K+/month in spend, a proper attribution tool earns its cost within weeks. Tool gap.
Some brands at the $5M–$15M stage don’t have a sophisticated attribution problem. They have no attribution at all. Their version of ROAS is simple math: total digital revenue ÷ total digital spend. Intuitive, easy to explain to a board, and deeply misleading.
It tells you nothing about which channel drives revenue, which creative acquires new customers vs. retargeting existing ones, or whether spend is efficient or just correlated with revenue that would have happened anyway. Worse, a brand can have a “good” blended ROAS while slowly exhausting its customer base — overspending on retargeting, underspending on acquisition. By the time the numbers look bad, the damage is done.
This is the use case where we have to be most honest: you can’t AI your way out of bad taste. If your creative isn’t resonating or you’re on the wrong platform, no attribution tool fixes that. Brand judgment, creative instinct, and channel intuition are still human skills.
That said, AI has fundamentally changed what comes next. Testing a new channel, learning what works, and optimizing spend used to take months of manual iteration. Today it’s dramatically faster. AI can run creative variants at scale, identify winning signals earlier, and reallocate spend before a human would have noticed the pattern. The bar for “we should try TikTok” has dropped significantly.
The honest framing: AI can’t replace the taste that gets you into a channel. But once you’re in, it compresses the time between “this is working” and “double down,” and between “this is bleeding” and “stop.”
The attribution stack:
Triple Whale or Northbeam (~$129–$500/month) for DTC attribution: blended ROAS that accounts for view-through, click-through, and new customer acquisition cost
A spend vs. burn dashboard that connects your marketing spend to your actual runway, not just your ROAS. The question isn’t just “is this ad efficient?” It’s “is this spend consistent with our burn plan for the quarter?”
A weekly creative audit: use AI to analyze which ad variants are driving the most new customer acquisition (not just retargeting), and rotate creative before fatigue sets in rather than after
One more layer most brands miss: what happens after the click
Here’s a quick exercise. Take your last 30 days of ad spend and calculate your blended ROAS total digital revenue divided by total digital spend). Simple enough. Now run it again, but this time exclude anyone who purchased it in the last 90 days. New customers only.
If those two numbers look very different, you’ve just found your real problem. And it’s probably not your ads. It’s your landing page.
Most brands are sending paid traffic — intent-rich, expensive, hard-won paid traffic — to static pages that say the same thing to everyone. The person who clicked an ad about durability lands on the same page as the person who clicked a sustainability message. Same headline. Same hero image. Same everything.
The ad did its job. The landing page didn’t.
This is exactly the problem Gigit.ai (an XRC portfolio company) was built to solve. Gigit dynamically matches your landing page experience to the specific ad a visitor just clicked in real time, with no manual tagging and no developer lift. It deploys on top of your existing Shopify or Shopline storefront in under three days. Their brand partners are seeing 40–60% conversion uplift and 30–60% more revenue per visitor. For anyone spending $200K/month on ads, that math gets interesting very quickly.
Worth adding to your WBR too: your marketing block should be answering three questions every week
Are we spending to plan?
Is new customer acquisition cost moving in the right direction?
What creative decision needs to be made this week?
The landing page is where all three intersect.
Monday morning action: Run those two ROAS numbers. If the gap is there, you’ve found your leverage point.
The signal: A buyer meeting reveals a velocity problem that’s been building for six weeks. The team didn’t know. The WBR flags it.
The diagnosis: Not a people problem — the sales team is engaged. Not a process problem — there’s a reporting process, it’s just too slow. Data/tool problem: sell-through data arrives 2–3 weeks late.
The decision: Claude can analyze data once you have it but can’t accelerate how quickly retailers share sell-through reports. Genuine tool gap.
Crisp (~$500–$1,000/month) aggregates sell-through data across major retailers — Target, Walmart, Kroger, Whole Foods — into a single dashboard, updated frequently enough to actually inform decisions. Paired with your inventory and production planning, it becomes the early warning system for two of the most expensive problems in CPG: out-of-stocks (lost velocity, lost shelf space) and overstock (markdown pressure, working capital tied up in the wrong place).
The AI layer on top of this: anomaly detection that flags when a door cluster is underperforming relative to comp stores, so your field team knows exactly where to focus — not after the quarterly business review with the buyer, but before. This is decision cycle compression made tangible: the difference between learning about a velocity problem in a buyer meeting and learning about it three weeks earlier, with enough time to do something about it.
For Amazon specifically: Stackline (~$500+/month) provides the equivalent intelligence for your Amazon business — search rank, competitor activity, review velocity, Buy Box ownership. At the $10M+ stage, Amazon is a business inside your business, and it deserves the same weekly review discipline as your DTC channel.
One more Amazon problem worth solving: you’re generating sales but Amazon owns the customer relationship. You have no idea who bought your product, and you can’t market to them directly. Swapt (an XRC portfolio company) fixes this with QR-powered conversion flows — a code inside your packaging that takes Amazon and TikTok Shop buyers through a branded experience that captures their data, drives reviews, and converts anonymous marketplace buyers into customers you actually own. For any brand serious about building a direct relationship with their customer base, this is one of the highest-leverage tools in the Amazon stack.
Monday morning action: Ask your VP of Sales or broker how long it takes to get sell-through data from your top three retail accounts after the week closes. If the answer is more than 7 days, you are always making decisions with stale information. That lag — not your product, not your pricing — may be your biggest retail risk right now.
If you’ve acquired a brand, joined as a new executive, are incubating inside a larger organization, or simply grown faster than your systems, the question to focus on is how to make progress and build on what’s working in your existing stack.
A practical sequence:
Week 1–2: Listen before you build. Map what exists — every tool, every integration, every manual process. Interview the people who actually run the operation day-to-day. The institutional knowledge that lives in people’s heads is the most important asset and the most fragile.
Optional: Use this prompt in Claude to turn your notes into a structured stack map: “Here are my notes from interviews with the team and a list of tools we’re currently using: [paste notes and tool list]. Organize this into a structured map with the following categories: data and finance, ecommerce and marketing, retail and wholesale, content and community, and internal operations. For each category, note what tool or process exists, whether it’s connected to other systems, and where the obvious gaps or manual workarounds are.”
Week 3–4: Identify the highest-friction point. Where is the most time being lost? Where is the data least trustworthy? Where are decisions being made slowest? That’s your first intervention — not a full stack redesign.
Optional: Use this prompt in Claude to turn your stack map into a prioritized diagnosis: “Here is a map of our current operating stack: [paste stack map]. Based on this, identify the three highest-friction points — the places where the most time is being lost, data is least trustworthy, or decisions are being made slowest. For each one, suggest the single most targeted intervention: a tool, a process change, or a ownership clarification. Prioritize by what would have the highest leverage in the next 30 days.”
Month 2: Establish the WBR. Even if nothing else changes, a well-run weekly business review will surface what needs to be fixed faster than any audit. It also creates the shared language and shared accountability that makes every subsequent change easier. Use the KPI scorecard table above as your starting point — pick the four metrics most relevant to your current stage and build from there.
Optional: Use this prompt in Claude to generate a first-draft WBR scorecard and agenda tailored to your business: “We are a [revenue stage] CPG brand selling across [channels]. Our team consists of [brief description]. Here are our four most important KPIs right now: [list them]. Generate a weekly business review scorecard with green/yellow/red thresholds for each KPI, a suggested owner, and a 60-minute WBR agenda that would work for our team size and stage.”
Month 3+: Layer in AI where the friction is highest. Not as a platform play, not as a transformation initiative — as a targeted intervention in the specific workflow that’s costing you the most time or the most money.
The brands that do this well don’t announce an AI strategy. They quietly build an operation that runs faster than their competitors, and the results show up in the numbers before anyone can articulate why.
Parts 1 through 3 have covered building the foundation, diagnosing what’s broken, and making AI work inside a running operation. The final question is the org chart one — the question that determines whether all of this compounds or collapses.
In Part 4, we tackle when to hire, when to tool, and when to deploy an agent — and what the $100M brand with 30 employees actually looks like from the inside.
The use cases in this piece reflect work XRC has done alongside portfolio companies and strategic partners navigating exactly these inflection points. We’ve run the WBR framework, the inherited stack playbook, and the content operating model described here in real brands — not just in theory. If you’re an operator or investor at this stage and want to go deeper, we’d welcome the conversation- dianam@xrcventures.com.
XRC Ventures has been working at the intersection of consumer and technology since 2015. This series reflects what we’ve learned building alongside the operators doing it.
No posts
Comments
Nothing yet. Say the first thing.
Sign in to join the conversation.