
Payments and fintech stocks continued to struggle during the first part of 2026:
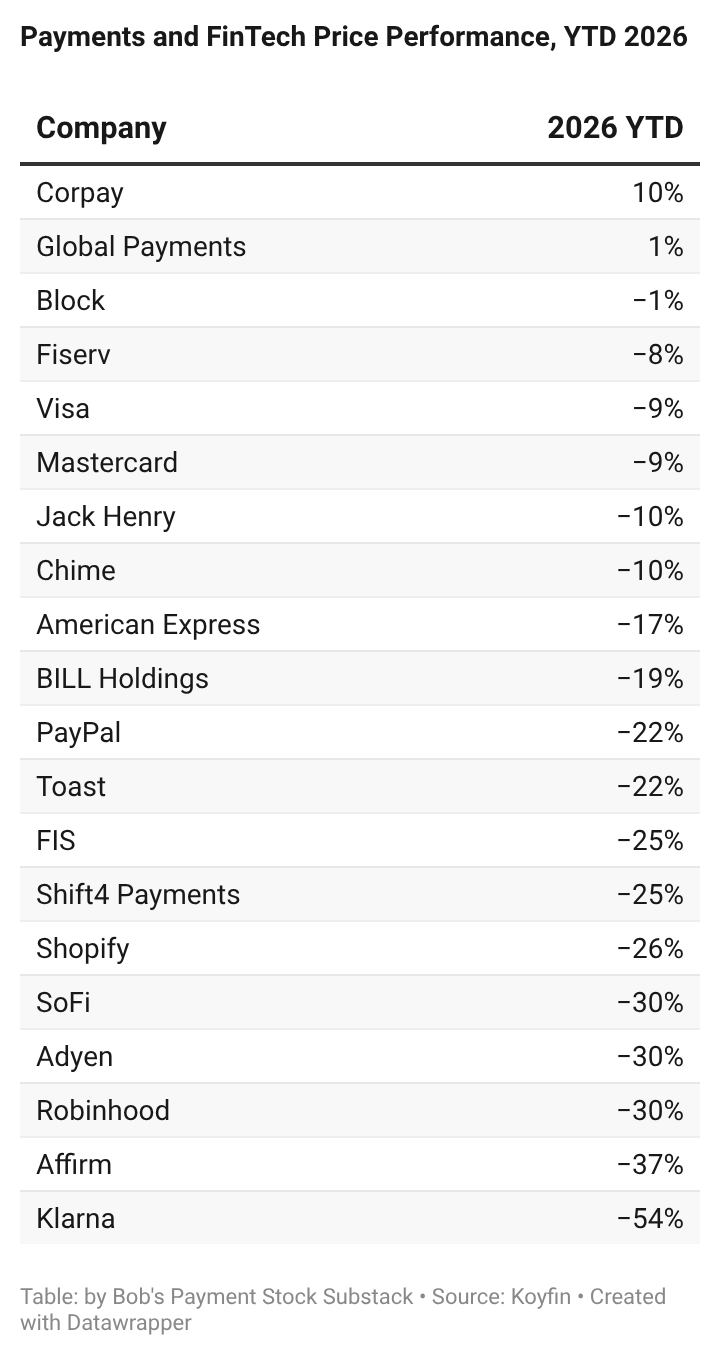
A couple of factors likely drove the additional weakening in sentiment: earlier in the year, the President targeted credit card interest rates and interchange in his affordability push—which at the time, and still now, seems more bark than bite; and more recently, the potential impact from AI, which is coming into focus as a risk for businesses across all areas of the economy.
I believe there are two primary concerns regarding AI’s impact on payments and fintech: (1) the proliferation of more affordable software for SMBs; and (2) agentic commerce disrupting the payments value chain.
The most successful payments and fintech companies over the last several years have been those that combine software and payments: Toast in table service restaurants, Shopify for e-commerce, Shift4 Payments in stadiums and entertainment, and Square for cafes and coffee shops. All of these companies, along with other payments and fintech names, sold-off in sympathy with software stocks as investors assessed the potential impact of new AI tools. The most draconian scenario contemplates a significant reduction in software development costs and time that allows upstarts to flood the market with viable alternatives to incumbent providers. At the least, margins will compress as pricing falls. In the worst case, they are displaced completely. Giving credibility to this prospect, the CEO of Paycom Software, a provider of payroll and HCM software to mid-sized businesses, said it “can get into every adjacent industry…now within weeks or months” with Block’s Jack Dorsey envisioning a future where AI allows customers to “build their own features on top of [Block’s] capabilities.”
While AI disruption concerns are valid, and companies should not rest on their laurels, I believe there are a couple reasons why the payments and fintech leaders of today can be the leaders of tomorrow: (1) these are platform companies, not a single point solution: they provide tools across the front, middle, and back-office, with payment flows seamlessly incorporated, integrated with proprietary hardware devices, all backed by financial services, including lending for both consumers and small businesses; (2) these are businesses, not a product concept, with existing brands, salesforce and partner channels for distribution, backed by significant marketing budgets; and (3) scale provides a data advantage, which is important in an AI-first world, allowing leaders to provide significantly better tools and features than start-ups that rely solely on frontier models.
Additionally, the point-of-sale (POS) software market is already highly competitive, with thousands of options for merchants and businesses to choose from, including lower cost options and ones with less robust features. Finally, new AI tools will provide benefits for incumbents too, not just startups.
Agentic commerce is more of a wildcard. Adoption is in its infancy. While AI-assisted shopping searches are way up (because every search on Google is now AI-enabled, isn’t it?), agents completing transactions on behalf of their humans remain very rare.
As of now, players seem more interested in developing rules of the road, announcing partnerships, and consulting customers. Most believe shopping for mundane or commodity-like products will emerge as an initial use case for agentic commerce with customers interested only in finding the cheapest price or fastest delivery time. Shopping for more specialized items seems less certain. After all, don’t some people still enjoy shopping?
Right now, concern centers on how the payments value chain will be impacted if agentic commerce achieves its full potential, as some predict. Could commerce platforms like Shopify become less relevant if their software no longer powers the splashy websites where products are discovered? Yes, there is value in bringing a significant catalog of merchants to model makers and their agents, but is it the same as before?
For now, I don’t believe Visa and Mastercard have much to worry about. After all, agentic commerce may accelerate the shift to online shopping where payment cards are ubiquitous. It also could break-up transactions into several smaller ones as agents optimize for price and other factors. Acquirers seem potentially safer too, as processing capabilities are unlikely to be replicated by the model makers, and have been cited by platforms as key infrastructure they provide.
As always, there’s much to learn as this technology and the associated risks and opportunities develop. This isn’t the final word, and my initial assumptions may look silly sooner rather than later.
Below are my thoughts on some of the ‘biggest’ stories out of earnings season:
Block: The RIF Heard Around the World
While Block delivered strong results, especially for Cash App, which saw acceleration across key metrics, Block’s decision to lay off more than 40% of its staff due to AI advancements stole the show. There seemed to be some doubt as whether this was truly AI-enabled or more about cleaning up bloat that had accrued over time. The data (see below) suggests Block is above average when it comes to efficiency metrics like gross profit per employee, making Jack’s argument seem plausible. After this reduction in force, Block will generate multiples of gross profit per employee when compared to key rivals like Toast and Adyen, potentially placing pressure on them to do more with less. Still, Block’s announcement sparked a broader debate. Will AI truly come for a majority of white-collar jobs? What will the world look like if that happens? I don’t know the answer to these questions. What I do know is that nothing happens in a vacuum. Employers aren’t given free rein to gut their staffs in the pursuit of higher profits. Politicians will step-in and disincentivize this type of behavior. Further, mass layoffs, if they happen, will have a profound impact on consumer spending, potentially destabilizing the economy and slowing the necessary investments to sustain AI advancements.
Adyen: 2026 Guidance Disappoints, Hiring Pick-Up Caps Margin Expansion
Adyen shares fell significantly following fourth quarter results as guidance for the upcoming year failed to impress investors. Even though the outlook for 20-22% net revenue growth (on a constant-currency basis) fell within the ‘low-to-mid 20%’ range provided last quarter, and reiterated at Adyen’s capital markets day in November, it was widely viewed as a guide down, however small. More disappointing was Adyen’s outlook for 2026 EBITDA margin ‘to remain broadly in-line’ with 2025, which came in at 53%. Adyen still expects its EBITDA margin to exceed 55% by 2028. For 2026, Adyen plans to hire 550 to 650 new employees, implying growth of about 12.5% at the midpoint versus its year-end headcount of 4,771. While I’ll never fault a company for investing to grow, Adyen seems out of step with other peers that have been able to accelerate, or sustain attractive, growth with a stable-to-declining headcount. My forecast, which drives my fair value estimate, assumes Adyen reaches a 60.5% EBITDA margin over the long-term (2033) with an EBITDA margin of 58% by 2028. Although I believe my long-term target is achievable, it is possible my profit expectations for Adyen through 2028 are too optimistic. Even so, after a modest adjustment to near-term margin estimates, my fair value for Adyen suggests it is significantly undervalued at today’s prices. Adyen is one of my favorite ideas in payments and fintech right now.
PayPal: Alex Chriss Out, PayPal for Sale?
It’s been quite the past few months for PayPal. Shares declined into earnings as management struck a cautious tone during the conference circuit, warning that a weakening consumer would dent the holiday shopping season and increased incentives would pressure transaction margin dollar growth in 2026. When the time came for actual results, PayPal shocked markets by ousting CEO Alex Chriss and replacing him with Enrique Lores, a member of PayPal’s board and then-CEO of HP. Not surprising, the results and guidance that went along with the CEO change were not good: branded online checkout volume growth slowed to just 1% and the outlook for 2026 implied a small decline in core checkout volume1 and transaction margin dollars to be roughly flat on an underlying basis. After the dust settled, and PayPal shares fell further, Bloomberg reported PayPal was attracting unsolicited takeover interest from multiple parties. A day later, Bloomberg named Stripe as a potential buyer of either the entire business or parts. But a few days later, Semafor reported PayPal was not for sale. I’m not sure exactly what’s going on, but nothing seems settled with PayPal right now. The new CEO, who started on Sunday, will have a lot to say about the future direction of PayPal and whether it’s as a standalone business or part of someone else. While there are logical suitors for most of the major pieces of PayPal, buying legacy assets has gotten payments companies nowhere fast, so I don’t expect any sale to be a slam dunk, especially as valuations across the industry are widely viewed as depressed and PayPal may hold out for a better price down the road.
Shift4 Payments: Softening Results Further Depress Valuation
Shift4 Payments left a lot to be desired with its latest results. Organic growth appeared to slow meaningfully from 18% to 12%. But that’s a guess as they failed to disclose the metric they seemingly promised to deliver on a go-forward basis last quarter. After a couple quarters of expansion on a year-over-year basis, Shift4’s blended take rate fell during the fourth quarter as enterprise customers made up a greater mix of volume and small business volume growth was challenged. Global Blue remains another issue altogether. Foreign currency is impacting the business in multiple and unexpected ways. While it’s having a benefit from a translation perspective, there is a negative impact from discouraging cross-border shopping in certain corridors. Tension between China and Japan also had a negative impact on Global Blue in the latest quarter. Who could have guessed? The bottom line is that Shift4 expects Global Blue to grow at a mid-single-digit rate in 2026, below recent growth and the high single-digit rate Shift4 used when underwriting the deal. While everyone agrees the stock is attractively valued, as former CEO Jared Isaacman confirmed with another significant insider buy disclosed Monday morning, the market remains uncomfortable with its leverage profile, in my opinion, making the company’s insistence on buying back the entire $1 billion authorization all the more puzzling.
Although volume growth remained largely consistent with last quarter, revenue growth slowed in certain areas, with the primary driver being deceleration at PayPal and Fiserv’s Clover. In each case, the companies are making investments in fee reductions and incentives to improve their competitive positioning. Although historical data shows pricing stability across payments, recent developments bear watching as take rates did tick down in the fourth quarter due to the actions by PayPal and Clover. Elsewhere, there was a mix of take rate expansion (Toast), stability (Global Payments, Lightspeed and U.S. Bank), and declines (Block’s Square and Shift4 Payments) with mix and company-specific factors contributing.
Lending growth remained robust across fintechs, including BNPL and liquidity products, with Block’s Cash App taking top prize with 223% growth in Cash App Borrow origination volume during the fourth quarter. Loss rates remain contained and companies across the board have demonstrated falling loss rates as products mature and customers repeat usage.
Below are my recent publications:
Musings on a Potential PayPal Takeover
The Bull Case for Integrated SMB Payments
President Trump sets sight on credit card industry in AFFORDABILITY push
Q4 2025: Portfolio Update + Investable Universe
PayPal: Past, Present and Future
All Roads Lead to Visa and Mastercard
If you like what you read, please consider subscribing, liking, commenting or sharing to expand the report’s reach. Thank you!
U.S. debit card payment volume for Visa, Mastercard and the EFT networks
Payment volume for the debit card portfolios of J.P. Morgan, Bank of America, Wells Fargo and U.S. Bank
Total debit card payment volume2 increased 5.0% during Q4, a 270-bps stepdown from Q3. I believe the conversion of the Capital One debit portfolio to Discover negatively impacted growth by 150-170-bps, suggesting underlying growth slowed by about 110-bps, primarily reflecting a difficult comparison from the prior year (Q4 2024 was up 8.6%, the strongest growth rate since Q4 2021).
Visa reported 5.9% growth (down 180-bps) and Mastercard 2.4% growth (down 520-bps).
Visa cited the loss of Visa Direct volume from a customer moving its money moving capabilities in-house, the loss of Interlink volume from the Capital One conversion, and severe weather.
Excluding the Capital One conversion, I estimate Mastercard’s growth was about slightly more than 7%, down about 60-bps from Q3.
Collectively, J.P. Morgan, Bank of America, and Wells Fargo (all exclusive, or near-exclusive, debit customers for Visa) grew 6.4% during Q4 (down 70-bps vs. Q3). After excluding the Capital One conversion and Visa Direct impact, I estimate all other issuer volume grew about 7.5%, down 50-bps from Q3.
In addition to regional and community banks and credit unions, other debit issuers include FinTech banks such as Chime and Cash App.
Chime’s card volume, which is mostly debit, grew 13% in Q4 (down 230-bps from Q3) while volume for the Cash App Card increased by an estimated 18.5% in Q4.
U.S. credit card payment volume for Visa, Mastercard, American Express and Discover
Payment volume for the credit card portfolios of J.P. Morgan, Capital One, Citi, Bank of America, U.S. Bank and Wells Fargo
Average loans and net charge-offs for the credit card portfolios of J.P. Morgan, Capital One, Citi, Bank of America, U.S. Bank, Wells Fargo, American Express and Discover
U.S. credit card payment volume increased 6.8% during Q4, a 20-bps decline vs. Q3, despite a more difficult comparison from last year’s strong holiday shopping season.
Adding U.S. BNPL GMV and liquidity product originations to U.S. credit card payment volume raises the pro-forma growth rate by 100-bps during Q4 to about 7.8%, suggesting FinTechs are playing a key role sustaining healthy consumer spending growth in the U.S.
Visa grew fastest at 7.5%, followed by Mastercard (6.7%) and American Express (6.5%) — Discover volume declined slightly vs. prior year.
This was the tenth consecutive quarter American Express failed to gain share of the U.S. credit card market.
Among major issuers, J.P. Morgan gained share, growing more than 7%.
Average credit card loans3 increased 4.5% in Q4, down 30-bps vs. Q3.
The Q4 net charge-off rate4 rose to 3.67%, up 7-bps from Q3 but down 35-bps vs. the prior year period, similar with Q3.
Volume and net revenue5 for Visa and Mastercard
Aggregate global payment volume (PV) for Visa and Mastercard increased 8.3% during Q4, a 100-bps slowdown from Q3.
International PV increased 10%, a 70-bps slowdown from Q3, while U.S. PV grew only 6%, a 140-bps decline from Q3. The U.S. slowdown was attributable primarily to the Capital One conversion, the loss of Visa Direct volume, and a more difficult comparison.
Despite the slowdown in volume, aggregate organic net revenue growth for Visa and Mastercard was about 13.5% during Q4, up 150-bps from Q3.
Value added services (VAS) revenue continues to lead the way, with Visa and Mastercard reporting 28% and 22% (19% organic) growth in VAS revenue during the December quarter, respectively.
Both Visa and Mastercard noted a decline in FX volatility during the December quarter. The level of FX volatility influences the amount of money the networks make when converting currency on a cross-border transaction. Lower volatility results in lower spreads over current exchange rates, reducing net revenue. The first half of 2025 saw heightened FX volatility, creating difficult compares for H1 2026.
Visa reported organic net revenue and global PV growth of 13% and 8%, respectively.
U.S. and international PV growth was 7% and 9%, respectively.
Processed transaction growth slowed by 1-point to 9% while cross-border volume (excluding intra-Europe) growth remained at 11% for a third consecutive quarter.
Mastercard reported organic net revenue and global PV growth of 14% and 9%, respectively.
U.S. and international PV growth was 5% and 11%, respectively.
Switched transactions increased 10%, similar to Q3, while cross-border volume grew 14%, a 1-point slowdown from Q3.
Volume, revenue and take rate for Fiserv, Global Payments, Worldpay, U.S. Bank’s Elavon and J.P. Morgan
Aggregate revenue growth for Legacy Acquiring slowed to less than 4% in Q4, a 230-bps decline from Q3, due primarily to slowdowns at Fiserv and Worldpay.
Even though U.S. Bank’s Elavon reported a more than 4-point slowdown in volume growth from Q3 to Q4, revenue growth of 4.5% was down just 70-bps from Q3 as its Q4 take rate of 30.3-bps was up nearly 3% from 29.5-bps in the prior year period.
Global Payments reported organic revenue and volume growth of 6% and 5% in Q4, respectively, steady with Q3.
Worldpay6 reported revenue growth of 4%, down more than 400-bps from Q3.
Global Payments closed the acquisition of Worldpay in the middle of January. For 2026, Global Payments expects the combined business will grow organic revenue by about 5%, which assumes 6% growth for legacy Global Payments and 4% for Worldpay, and allows for some disruption in revenue momentum as the businesses are integrated in H1 2026.
Fiserv’s Merchant organic revenue growth slowed to 1% in Q4, a 4-point decline from Q3. Clover’s reported volume growth slipped to 6%, down from 8% during Q3, while the elimination of certain Clover fees reduced Fiserv’s Merchant growth rate by a couple of points. Non-Clover revenue, excluding Argentina, was flat in Q4 after being up around 4% through the first three quarters. For 2026, Fiserv expects mid-single-digit Merchant revenue growth with Clover revenue up low double-digits and ‘slight growth’ in non-Clover revenue. As a reminder, non-Clover sources made up two-thirds of Fiserv’s Merchant revenue in 2026.
Aggregate Commerce Platforms revenue grew 17% in Q4, a 4-point slowdown from Q3 even though Commerce Platforms volume growth slowed only 50-bps to 18.1%.
For Commerce Platforms, payments-related revenue increased 15% while non-payments revenue (primarily includes fees from software subscriptions and merchant lending) grew nearly 20%.
There were a couple factors that contributed to the spread between payments-related revenue and volume growth: a continued move upmarket that places modest downward pressure on take rates (Shift4’s take rate fell approximately 3-bps year-over-year due to a greater mix of enterprise volume in Q4), and company-specific actions that resulted in lower prices for merchants (Clover eliminating certain fees) and higher processing costs (Square gaining flexibility with a processing partner at the expense of higher costs).
Square’s volume, or GPV, grew 10% in Q4, with U.S. growth slowing to 7%, down 190-bps from the prior quarter, but still outpacing market growth by about 60-bps. Food and beverage GPV growth remained strong at 16%, down only 1-point from Q3. International GPV grew 25% on a constant-currency basis, similar to Q3. Gross profit growth, excluding the processing partner impact, was 9.5%, roughly in-line with volume growth. More significant hardware losses were an additional 2-point headwind to gross profit growth. I estimate Square’s take rate fell by 5-bps from the prior year, or about 2-bps excluding the processing partner impact, reflecting Square’s move upmarket.
Shopify’s best-in-class volume growth ticked down slightly to 29% during Q4 while revenue growth stayed steady at 24%.
Toast’s volume growth slowed by 170-bps to 21.8% during Q4. Revenue growth stepped down from 32% in Q3 to 26.5% in Q4 as Toast lapped more significant increases in its take that resulted from a modest pricing change, the introduction of a surcharging product and cost optimization efforts with its network and processing partners.
Lightspeed reported an uptick in volume growth—from 7% to 8%—while revenue growth of about 14% slowed 250-bps from Q3.
Clover’s reported volume growth fell to 6%, down 2-points. Fiserv attributed the slowdown to a softer November for U.S. restaurants and retail. On an underlying basis, which excludes the impact of the gateway conversion, volume growth was 9% in Q4. Fiserv did not disclose U.S. volume growth for Clover in Q4. Revenue growth slowed dramatically to 12%, down 14-points from Q3, reflecting slower volume growth and the elimination of select fees, which created a 6-point headwind to Clover revenue growth.
Shift4 reported volume growth of 23%, down 3-points from Q3. Shift4’s blended spread, or take rate, was 57-bps, down 3-bps vs. the prior year, resulting in payments-related revenue growth of 17%, down significantly from 30% growth in Q3. Shift4 attributed the decline in take rate to a mix shift toward enterprise volume in Q4 with weakness in SMB volume. Excluding Global Blue ($158MM of Q4 revenue, by my estimate), Shift4’s revenue grew 12% in Q4, down from 19% (18% organic) in Q3.
Volume9, revenue and take rate for PayPal, Shopify and Adyen
Aggregate E-Commerce revenue grew 9% during Q4, a 5-point drop from Q3, even as volume growth accelerated by 50-bps to 15.6%.
Shopify and Adyen represented more than 37% of aggregate E-Commerce revenue in Q4, up more than 450-bps from the prior year.
PayPal’s volume, or TPV, increased 6% in Q4, a 1-point decline from Q4. Excluding P2P payments, volume was up 9% on a reported basis, reflecting a return to double-digit growth for Braintree, a large, but much less profitable, volume stream for PayPal. Branded online checkout volume growth fell to 1% in Q4, down 4-points from Q3. PayPal attributed the weakness to softness in retail, Germany, and high-growth verticals including gaming, ticketing, travel and crypto. Transaction margin dollars rose 2.5% in Q4, a 3.5-point slowdown from Q3. Revenue for PayPal—which I define as revenue less transaction expense—grew just 1%, down over 7-points from Q3. Excluding interest income from both periods, revenue increased approximately 2% in Q4, down nearly 8-points from Q3. The slower growth reflected deceleration in high margin volume streams and increased incentives to habituate consumer behavior, which act as a contra-revenue.
Adyen’s net revenue grew 19% on a constant-currency basis in Q4, a 4-point slowdown from Q3, resulting in 21% growth for H2 2025, similar to H1 2025. Volume growth was up 19% on a constant-currency basis when excluding a single large volume customer that generates little net revenue (i.e., Cash App funding transactions).
Revenue, active members, card volume and liquidity product origination volume for Cash App, Chime, Dave, The Bancorp Bank and Green Dot
Aggregate FinTech Bank revenue grew 34% during Q4, a 6-point acceleration from Q3. Card volume growth of 17% matched Q3.
Cash App gross profit excluding Bitcoin grew 35%, a 10-point acceleration from Q3. The Cash App Card volume grew by an estimated 18.5%, a modest acceleration from Q3. Expansion of Cash App Borrow continues to be a significant driver of Cash App’s growth, with originations up 223% over the prior year in Q4. After multiple quarters of slowing growth, Cash App saw a second consecutive quarter of uptick in monthly actives and inflow growth.
Chime’s revenue increased 25% during Q4, a 4-point decline from Q3, as it laps the full launch of MyPay (the company’s short-term liquidity product) in July 2024. Card purchase volume growth slowed to 13.1% during Q4, down 230-bps from Q3. Chime noted outbound instant transfers, launched in January, contributed approximately $900 million of volume during Q4. Combining card purchase and OIT volume results in 16% growth over the prior year, down 2-points from Q3. MyPay revenue was $103 million during Q4, up from $49 million in the prior year. If MyPay revenue is excluded from both years, Chime’s revenue growth would have been 15.7% in Q4, a 380-bps slowdown from Q3.
Revenue and volume for Affirm, Afterpay, Klarna, PayPal, Sezzle and Zip
Aggregate BNPL GMV was $80.7 billion in Q4, up 25%, steady with Q3.
I estimate U.S. BNPL GMV of $42.3 billion in Q4, up 31% from the prior year and a 2-point slowdown from Q3.
Aggregate BNPL revenue grew 33%, a 2-point acceleration from Q3.
BNPL providers are driving attracting volume and revenue growth through the expansion of financing and payment options at its merchant customers, as well as by partnering with payment service providers (PSPs) and digital wallets to increase the number of merchants and consumers utilizing their solutions.
Affirm’s revenue grew 30%, a 4-point slowdown from the September quarter, as GMV growth of 36% was down 6-points from 42% in the last quarter. Revenue less transaction costs (RLTC) increased 29%, in-line with revenue. As a percentage of GMV, RLTC was 3.96%, down 20-bps vs. the prior year. The Affirm Card generated $2.2 billion of GMV in the December quarter, up 159% from the prior year, and now counts 3.7 million active customers, up nearly 1 million since last quarter.
Klarna reported GMV and revenue growth of 32% and 38%, respectively. On a like-for-like basis, which adjusts for the sale of Klarna Checkout and currency translation, GMV increased 23%, similar to Q3, and revenue grew 32%, a 6-point improvement from Q3. In the U.S., GMV growth stayed steady at 43% while revenue growth accelerated 7-points to 58%. Fair financing GMV increased 165% during Q4. Fair financing is a longer-term fixed-payment lending product with an interest rate more comparable, but still lower, than a traditional credit card. The Klarna Card, which allows holders to select debit or credit at the point-of-sale, grew GMV 209% in Q4, massive acceleration from a 91% growth during Q3.
Volume and revenue10 for BILL Holdings, Corpay, AvidXchange and Payoneer
Aggregate Corporate Payments revenue grew 14.7% in Q4, a 50-bps slowdown from Q3 despite a more than 3-point acceleration in volume growth to 23.6% in Q4.
Corpay’s organic revenue grew 15.7% in Q4, an 80-bps slowdown from Q3. Organic spend volume growth accelerated by 7-points to nearly 46% but continues to be influenced by volume from enterprise customers where Corpay generates a lower revenue yield. Corpay noted a 2-point headwind to revenue growth from lower interest rates, up 1-point from Q3.
BILL Holdings’ core revenue grew 17.4% during the December quarter, up 370-bps from the September quarter, as total payment volume growth ticked up 70-bps to 12.5%. Monetization improved as a result of increased adoption of ad valorem products, including Supplier Payments Plus, the Divvy corporate card, invoice financing for BILL’s SMB customers, and virtual card payments for accounts payable.
Payoneer’s revenue, excluding interest income, was up 9% in Q4, a 6.5-point slowdown from Q3, even as volume growth accelerated by 1-point to 10%.
Revenue from Fiserv, FIS and Jack Henry
Aggregate Bank Technology revenue grew 2.4% in Q4, 130-bps of improvement from Q3.
Fiserv’s Financial Solutions revenue fell 2% in Q4, a 1.5-point improvement from Q3. As a reminder, following Q3 results, Fiserv highlighted slowing growth for Zelle, a secular decline in the company’s bill pay business, and weakness in its ATM managed services business as headwinds to longer-term growth. Additionally, Fiserv noted the consolidation of its core banking platforms—from 16 to five—is creating confusion among its customer base and allowing competitors to exploit the opportunity to potentially take share. For 2026, Fiserv expects Financial Solutions revenue to be flat to slightly down, with growth returning to a low-to-mid-single-digit range over the medium-term.
FIS’ Banking revenue increased 8.3% on a reported basis in Q4, which includes 130-bps of contribution from M&A, implying organic growth of 7%. This is the first time since Q4 2020 that FIS grew faster than both Fiserv and Jack Henry. FIS believes its focus on large financial institutions (LFIs) serves it well as these banks grow the fastest—both organically and through consolidation, spend heavily on technology, and have excess capital and stable loss rates.
Jack Henry’s organic revenue growth was 6.7% during the December quarter, a 210-bps slowdown from the September quarter. Across segments, Core revenue increased 7%, Payments grew 6%, and Complementary expanded 9%. Jack Henry noted consolidation at one of its competitors (i.e., Fiserv) has positively impacted its sales pipeline across Core, Payments and Complementary solutions, with its win rate likely to improve over time.
Disclosure: Of the companies mentioned in this report, I am long Visa, Global Payments, Intuit, Shift4 Payments, Block, and Adyen. This report is for informational purposes only and is not a recommendation to buy or sell any stock. Finally, while I rely on the information in this report to guide my investment decisions, you should not, because I cannot guarantee its accuracy.
PayPal’s core checkout represents Pay Now volume for PayPal and eBay.
Includes quarterly Visa and Mastercard volume. Excludes EFT networks, estimated annually.
Represents the total average loans of J.P. Morgan, Capital One, Citi, Bank of America, U.S. Bank, Wells Fargo, American Express and Discover.
Represents the total net charge-offs for J.P. Morgan, Capital One, Citi, Bank of America, U.S. Bank, Wells Fargo, American Express and Discover.
Visa and Mastercard report revenue on a net basis with client incentives deducted from gross revenue
FIS, the current partial owner of Worldpay, discloses its results in a supplement to earnings
Shopify represents gross merchandise volume and Lightspeed represents gross transaction volume.
Revenue includes payments or merchant transaction gross profit plus subscription revenue. I exclude hardware sales where possible.
Shopify represents gross merchandise volume.
Revenue excludes interest on client funds for Bill and AvidXchange.
No posts
Comments
Nothing yet. Say the first thing.
Sign in to join the conversation.