
A note from the author: I plan to release my quarterly review in the coming weeks. It is an aggregation of data (revenue, volume, and other KPIs) across payments and fintech (link). Although combining the earnings recap and quarterly review would be ideal, the quarterly review takes more time to compile, so I’m publishing this separately with the goal of providing qualitative commentary on earnings as close to the ‘end’ of the season as possible.
Overall, the market continues to tilt decidedly negative toward payments and fintech companies. In the face of solid results (on both an absolute and relative basis), many stocks sold off as full year outlooks were maintained and a number of bearish arguments persist unresolved: the potential for a weakening macro, increasing competitive intensity, and the impact of AI on software and payments. Below is an aggregated view of key themes across payments and fintech from this earnings season:
Macro: Very little evidence of consumer weakening emerged in Q1. Strong U.S. volume growth continued into April, partly on the back of a robust tax refund season. Charge-off rates are well contained across the board. Where provided, spending remains resilient for both affluent and lower-to-middle income consumers. Significant expansion of alternative fintech lending is likely helping bridge the gap for consumers living paycheck-to-paycheck. Perhaps the most important factor is that these people still have paychecks, as the employment backdrop appeared stable-to-improving despite fears of a structural decline in employment due to AI.
Middle East Conflict: The conflict with Iran appears to be having only a modest impact (so far) on global travel and spending patterns with pockets of strength partially offsetting, including a rebound in inbound U.S. travel. Even though both Visa and Mastercard reported a dip in cross-border travel volume growth during April, it was partially due to the timing of Ramadan. Still, it’s not exactly clear how this will play out if the conflict and elevated energy prices persist or worsen.
Competitive Intensity: Where available, payment yields are mostly stable, with the exception of Fiserv, which has made a purposeful decision to reset its pricing strategy for Clover. Among fintech banks (Cash App, Chime and Venmo), incentivizes to attract greater engagement are on the rise (Cash App Green and Chime Prime).
AI: Discussion around AI-related productivity gains (coding and customer service) and customer-facing feature launches are accelerating. The argument I’m hearing most from payments and fintech companies (which I’m partial to) is their accrued data advantage will translate to differentiated solutions relative to AI-native companies. Stablecoins and agentic commerce remain theoretical concepts, not near-term realities. I believe Visa and Mastercard are well positioned to incorporate these emerging commerce options into their ubiquitous global payment networks. Companies with meaningful software exposure (Shopify, Toast, Broadridge, and Intuit) have been beaten down even though current performance remains solid-to-strong. The question moving forward is whether valuations have been reset to the point where sustained success will result in higher stock prices.
Capital Allocation: Share buyback remains a significant part of the capital return story for payments and fintech companies. In fact, it’s hard to think of a company not buying back stock (answer: Adyen and Affirm). Here’s a list of last quarter’s buyback amounts: Visa ($7.9B); Mastercard ($4.0B); American Express ($1.9B); PayPal ($1.5B); Corpay ($786M); Block ($636M); Global Payments ($550M); Shopify ($491M); Toast ($323M); Shift4 Payments ($295M); Fiserv ($240M); Broadridge Financial ($200M); Jack Henry ($160M); Chime ($86M); and BILL Holdings ($57M). The question is, are there incremental buyers of payments and fintech stocks beyond the companies themselves?
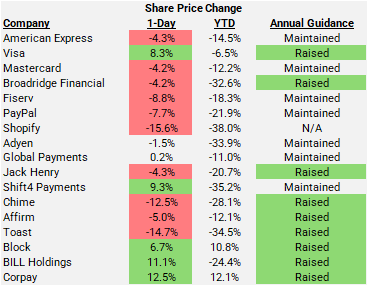
Below is a recap of earnings for the companies I follow most closely, sorted by reporting date:
Synopsis: American Express continues to deliver steady results as its affluent customer base remains in good shape. Even though U.S. volume growth continues to trail larger network peers, credit performance remains excellent, underscoring American Express’ ability to attract and retain the most premium fee-paying customers.
Most Important KPI(s): FXN revenue grew 10%, at its aspirational long-term target. Discount revenue, American Express’ largest source, and anchor of its spend-centric business model, increased 7% FXN. FXN billed business grew 9%, up 1-point from Q4.
Best Part(s) of Earnings: At 2.3%, American Express’ net write-off rate is below its pre-pandemic level, expanding its lead versus peers. American Express continues to perform extremely well with Millennials and Gen-Z, suggesting its brand has generational staying power: in Q1, this cohort, which represents 36% of U.S. consumer billed business, grew over 17%.
Worst Part(s) of Earnings: U.S. billed business grew only 7.2% in Q1, up 70-bps vs. Q4. For comparison, Visa’s U.S. credit volume grew 9.6%, up 220-bps from last quarter, while Mastercard’s grew 8.1%, up 150-bps. Despite Q1 outperformance, American Express maintained guidance as it plans to reinvest upside in marketing and technology spend to support long-term growth. A bearish point of view may be the highly competitive U.S. affluent card market requires elevated investment to sustain attractive growth.
Valuation: After expanding significantly from 12x at the end of 2023 to nearly 23x at the start of this year, American Express’ multiple has backed-off to around 17.5x currently, more in-line with its pre-pandemic average of the mid-teens.
Synopsis: For me, Visa’s results were best-in-class this earnings season. Organic net revenue growth reached 15% on the back of strong U.S. volume growth and a 27% increase in VAS revenue. Over the last ten quarters, Visa’s VAS revenue growth outpaced Mastercard’s by 6-points on average. With VAS revenue now representing 30% of Visa’s total, sustaining a low-to-mid 20% growth rate for VAS sets the stage for 11-12% total net revenue growth, easily clearing the double-digit bar investors feared was slipping out of reach not too long ago.
Most Important KPI(s): Organic net revenue grew 15%, up 2-points from the December quarter. FXN global PV increased 9%, up 1-point. FXN cross-border volume grew 12%, similar to the past three quarters. Processed transactions grew 9%, similar to the December quarter.
Best Part(s) of Earnings: Visa raised its organic net revenue and EPS growth guidance for fiscal 2026 based on strong volume growth, VAS outperformance, and increased FX volatility (Visa earns a spread over the wholesale rate when it converts currency in a cross-border transaction—the spread is influenced by FX volatility, so the more volatility the better for Visa).
Worst Part(s) of Earnings: While not perfectly clear, the Olympics and upcoming World Cup may be driving outsized VAS revenue growth for Visa through increased marketing engagements with customers. If this is the case, it may indicate a lower sustainable growth rate for VAS and set up a more challenging comparison next fiscal year. Cross-border travel, a highly valuable volume stream for Visa, dipped in April due in part to the Middle East conflict.
Valuation: At around 23x NTM EPS, Visa trades near its trough level over the past decade. Historically, this has been an excellent time to buy the stock, but will this time be different?
Synopsis: Mastercard’s results played second fiddle to Visa’s, a rare occurrence over the past few years. Still, results were solid, and I expect Mastercard to sustain modestly stronger growth than Visa over the long-term.
Most Important KPI(s): Organic net revenue grew 12%, down 2-points from Q4. FXN global PV increased 9%, similar to Q4. Switched transactions grew 9% and FXN cross-border volume grew 13%, both 1-point lower vs. Q4.
Best Part(s) of Earnings: 12% organic net revenue growth is nothing to blush at. Organic VAS revenue growth remains in the high-teens.
Worst Part(s) of Earnings: Mastercard maintained full-year guidance despite solid volume growth and increased FX volatility. Guidance assumes the Middle East conflict concludes this quarter, and travel patterns normalize in H2. This could prove optimistic, capping outperformance for the remainder of the year.
Valuation: Over the past decade, Mastercard has traded at a 4-point premium to Visa on an NTM P/E basis. It currently sits at less than 1.5-points. Interesting.
Synopsis: Broadridge reported solid results, inching up recurring revenue and EPS guidance for fiscal 2026 (ends June), but the stock fell on a reduction in its closed sales forecast, which contributes to recurring revenue growth in future years. Broadridge cited larger and more complex deals taking longer to close.
Most Important KPI(s): Equity positions (that generate revenue) were up 11% with fund positions up 6%. Organic recurring revenue growth was 5%. YTD closed sales of $147M are down 16% from the prior year period.
Best Part(s) of Earnings: Position growth, the primary driver of long-term growth in Broadridge’s regulatory and communications franchise, remains healthy. For the upcoming proxy season, Broadridge expects revenue-generating equity positions to increase in the low double-digits with mid-to-high single digit growth in fund positions. Even though deals are taking longer to close, Broadridge’s sales pipeline (north of $1B) is up 20% vs. the prior year.
Worst Part(s) of Earnings: Broadridge’s capital markets and wealth management businesses deliver significant parts of their offering via SaaS to large customers with a primary alternative being an in-house solution. Any commentary about large enterprise deals taking longer to close may stoke AI fears (and that’s exactly what happened this quarter).
Valuation: At 15x NTM EPS, Broadridge trades at a meaningful discount to its low-to-mid 20s average over the past decade. I believe that is just too low for a business with a virtual monopoly in proxy distribution and a highly complimentary regulatory and communications franchise that together represent close to 70% of profits.
Synopsis: Even though Fiserv delivered results in-line with the shape of its full-year forecast, banking organic revenue fell 6% as elevated attrition drove a decline in the number of accounts on Fiserv’s core platforms, a troubling development for a business that relies heavily on cross-selling.
Most Important KPI(s): Organic revenue declined 4%. Management expects Q2 to be the trough with improvement in the second half as comparisons ease. Even so, achieving the midpoint of Fiserv’s 1-3% full-year organic revenue growth outlook appears challenging. Adjusted operating margin fell 810-bps to below 30%.
Best Part(s) of Earnings: Underlying Clover volume growth accelerated by 3-points in Q1, reaching 12%.
Worst Part(s) of Earnings: Disruption from platform consolidations and poor service (which are now being addressed) has led to elevated attrition among Fiserv’s core banking customers. Core accounts fell 2%. Jack Henry, a key competitor to Fiserv in the community bank and credit union space, is reporting higher competitive takeaways, citing the disruption at Fiserv as a contributing factor.
Valuation: Fiserv trades at a rock bottom multiple of less than 7x NTM EPS. Although this is not deserved, Fiserv’s best asset (the annuity-like earnings stream from its core banking franchise) may now be its greatest liability as the market questions a return to MSD growth.
Synopsis: Despite solid Q1 results, PayPal shares fell after management offered cautious commentary and a soft outlook for Q2 and hinted a sale of all or parts of PayPal was not imminent. PayPal will reorganize its business into three distinct segments (PayPal, Venmo, and Braintree, essentially) and reduce headcount by 20% to fund growth investments. However, new CEO Enrique Lores failed to deliver a more specific turnaround plan for the struggling digital payments giant.
Most Important KPI(s): Transaction margin dollars (TM$) excluding interest on client funds grew 3% during Q1 with an uptick in branded online checkout TPV growth to 2%.
Best Part(s) of Earnings: Braintree volume growth accelerated to the mid-teens during Q1. PayPal announced a multi-year restructuring plan that will generate cost savings to fund investments to modernize PayPal’s technology platform and incentivize customers to more fully participate in PayPal’s ecosystem.
Worst Part(s) of Earnings: Q2 branded online checkout TPV growth was tracking at the ‘low-end’ of PayPal’s full-year guidance for ‘slightly positive to LSD growth’ as management noted weakness in the travel vertical and Europe. PayPal is guiding for a LSD decline in TM$ excluding interest on client funds in Q2.
Valuation: At around 8x NTM EPS, PayPal’s valuation reflects serious concern over PayPal’s competitive position and the fragility of its branded online checkout volume stream. Still, the balance sheet is in excellent shape, and PayPal produces significant FCF that it deploys to dramatically shrink its share count.
Synopsis: Shopify is another company where results appeared strong, but the stock got knocked down pretty hard as the upcoming quarter’s guidance failed to impress. The bottom line is Shopify is among the most expensive stocks in payments and fintech, so any bobble may be (severely) punished. Although Shopify is positioning itself as a ‘winner’ in agentic commerce, the outcome is far from determined, creating additional uncertainty for the stock.
Most Important KPI(s): FXN GMV grew 30%, up 1-point from Q4, and the second consecutive quarter of more than $100B. Payments penetration was 67%, up 3-points from a year ago, driving 41% growth in payments volume (on a reported basis).
Best Part(s) of Earnings: Shopify delivered 78% GAAP operating profit growth in Q1. Shopify’s GMV growth remains best-in-class with strength across geographies and channels.
Worst Part(s) of Earnings: On a reported basis, Shopify expects Q2 revenue growth in the ‘high-20s’, down from 35% in Q1, and ‘mid-20s’ gross profit growth, down from 32% in Q1. After accounting for a smaller FX tailwind (0.5% in Q2 vs. 2% in Q1), the slowdown is about MSD. Shopify mentioned that increased LLM costs were a headwind to subscription gross profit margin, a dynamic that is expected to continue.
Valuation: Burdened for SBC expense, I estimate Shopify trades at an EV-to-2026 EBITDA multiple in the mid-50s. Although more reasonable than in the past, it’s still (slightly) too rich for my blood.
Synopsis: Adyen disclosed preliminary Q1 results in conjunction with its Talon.One acquisition announcement on April 23. FXN net revenue grew 20%, at the low-end of its full-year 20-22% guide. However, Adyen expects Q2 to be slightly stronger, and H2 to be equal to H1.
Talon.One Acquisition: Adyen is acquiring Talon.One, a German-based loyalty and incentives platform, for €750 million, roughly 12.5x expected ending 2026 ARR of €60 million. Adyen believes the combination of its unique identification capabilities (enabled by Adyen’s single platform) and Talon.One’s SKU-level product catalog will enable Adyen to deliver real-time promotions to human shoppers, online and in-store, and AI agents. While this sounds wonderful in theory, delivering it in practice may be more difficult, especially since payments companies have been attempting this for at least the past decade.
Most Important KPI(s): FXN net revenue increased 20%. Processed volume grew 21% on a reported basis. Assuming a similar FX impact as net revenue (-4-point) implies FXN processed volume growth in the mid-20% range, a bit better than 23-24% growth during 2025. Adyen added 88 net new FTEs in Q1, below the pace implied by its full-year plan for a 550-650 increase (which remains unchanged).
Best Part(s) of Earnings: Adyen has not observed a discernible change in spending behavior since the start of the Middle East conflict. Further, it appears wallet share gain of existing customer volume is off to a solid start in 2026.
Worst Part(s) of Earnings: The Talon.One acquisition is expected to be 1-point dilutive to Adyen’s 2027 EBITDA margin. Volume growth was more weighted to Adyen’s largest customers during Q1, driving about a 5-point spread between FXN net revenue and processed volume growth, slightly higher than Adyen’s long-term average.
Valuation: Adyen trades at about 16.5x on an EV-to-EBITDA basis, an attractive level in my opinion and a discount to other high-growth payments and fintech peers, including Shopify (mid-50s) and Toast (low-20s).
Synopsis: In its first quarter post-Worldpay close, Global delivered organic revenue growth of 4.5%, in-line with expectations. Although Global kept the full-year guide intact, which includes approximately 5% organic revenue growth, the call was short on details and Global outlined headwinds from lower tax payments and the Middle East conflict that will be a 1-point drag on growth in Q2.
Most Important KPI(s): Organic revenue grew 4.5%. Segment composition (forthcoming with Q2 results) and growth dimensioned by legacy Global Payments and Worldpay were not disclosed, making a robust analysis of Q1 results difficult.
Best Part(s) of Earnings: Global Payments delivered on their Q1 commitment of organic revenue growth of ‘slightly less’ than 5%. While qualitative in nature, the Worldpay integration appears on track and momentum around the Genius platform appears solid.
Worst Part(s) of Earnings: Expectations for Q2 are unclear. Comments around headwinds suggest it is possible organic revenue growth could step-down in Q2, making the path to approximately 5% growth for the full-year more back-half weighted, always a concerning proposition.
Valuation: Global remains the ultimate show-me story in payments. At a pro-forma market cap of about $19 billion, Global trades at less than 4x its expected 2028 FCF of around $5B. I’m sticking with it.
Synopsis: Jack Henry delivered steady fiscal Q3 results, raised the low-end of its organic revenue guidance, and upped its margin outlook for fiscal 2026. More importantly, Jack Henry is signing more, and larger, core banking customers and selling them more solutions upfront, setting the table for continued momentum in the upcoming fiscal years.
Most Important KPI(s): Organic revenue grew 7.3%. Fiscal year to-date, Jack Henry won 43 core deals, up from 28 a year ago. 58% of core wins this fiscal year included digital banking and card processing, double the percentage (29%) from a year ago.
Best Part(s) of Earnings: FCF conversion is expected at the high-end of its 95-105% forecast. Despite significant expansion in fiscal 2026 (85-bps at midpoint), Jack Henry expects additional margin expansion during fiscal 2027. Jack Henry is seeing early success with its SMB payments product and is poised to begin selling its highly popular digital banking solution outside its core customer base.
Worst Part(s) of Earnings: Payments revenue grew only 5% in fiscal Q3 as network incentives were a headwind. It is important to note Jack Henry’s network incentives (the amount of rebates it earns from Visa and Mastercard) are based on the number of transactions, not the dollar value of transactions, making them susceptible to rising inflation (and by the way, a positive for Visa and Mastercard).
Valuation: At 21x NTM EPS, Jack Henry is (significantly) less expensive than it was in the past but is in no way cheap, especially compared to other similarly attractive businesses across payments and fintech.
Synopsis: Shift4 delivered in-line Q1 results, maintained its full-year guide, and provided greater transparency around organic GRLNF, a welcome development for transparency advocates (myself included). While this was good enough for an initial pop, those gains have since been erased as the market appears to be taking a wait-and-see approach for the rest of the year.
Most Important KPI(s): Organic GRLNF increased 11%, broadly in-line with my 12% estimate for Q4, but down significantly from mid-20s growth in 2024. Shift4’s blended spread of 61-bps jumped about 4-bps from Q4 and was flat year-over-year.
Best Part(s) of Earnings: SSS were slightly better than management’s internal expectation. Blended spreads rebounded from Q4, alleviating some of my concerns. Shift4’s H2 guide, which includes Global Blue in the base and only a moderate inorganic contribution from Smartpay and Bambora, implies organic GRLNF growth of 11-12%.
Worst Part(s) of Earnings: It’s not exactly clear how an ongoing, or escalating, Middle East conflict will impact not only Global Blue, but other discretionary categories like restaurants, travel and entertainment, where Shift4 plays heavily.
Valuation: At around $41 per share, Shift4 trades at only 7x the midpoint of its non-GAAP EPS ($5.60). If I burden EPS for SBC expense and recurring acquisition and restructuring costs, it reduces non-GAAP EPS by about $1.50, implying normalized EPS of $4.10 and a P/E of 10x. From my perspective, the market is pricing a slowdown in organic growth to the MSDs. If you believe Shift4 can sustain an organic growth rate closer to the low-DD (as I do), then shares are attractive, and upside potential is significant.
Synopsis: Chime shares declined significantly post-earnings despite better-than-expected results and an increase to full-year guidance. Even though Chime is successfully monetizing its customer base with (among the lowest cost) lending products (MyPay), the Chime Card (a secured credit card), and instant transfers, card purchase volume growth, a key barometer of primary financial relationships, continues to moderate.
Most Important KPI(s): Card purchase volume of $38.7B increased 12%, down 1-point from Q4. Including instant transfers, volume growth was 15%, also 1-point slower vs. Q4.
Best Part(s) of Earnings: Falling SBC expense and operating leverage are expected to result in GAAP profitability during 2026. A switch to a variable pricing model has boosted MyPay yields (to 2.6-2.7% in Q1 from about 1.9% a year ago) while loss rates remain low at 1%.
Worst Part(s) of Earnings: Card purchase volume growth has slowed from 18% to 12% over the past year, even though active member growth remains high at 19%, suggesting Chime is acquiring more lightly engaged users while the pace of primary financial relationships added may be slowing.
Valuation: If we take the high-end of Chime’s 2026 adjusted EBITDA guidance ($431M) and burden it by expected SBC expense (say $250M), it implies normalized EBITDA of $181M and an EV-to-2026 EBITDA multiple of the low-to-mid 30s, reasonable in my opinion.
Synopsis: Affirm continues to impress with significant volume growth, strong credit performance, and substantial operating leverage. Although I have questions about the long-term durability of Affirm’s high-APR lending profile, there was little to find fault with in Affirm’s fiscal Q3 results.
Most Important KPI(s): GMV growth of 35% (down 1-point from last quarter) and revenue less transaction costs (RLTC) as a percentage of GMV expanded to 4.3%, above the company’s long-term target of 3-4%.
Best Part(s) of Earnings: Funding costs continued to fall, down 34 bps sequentially and 126 bps on a year-over-year basis. Even though there are concerns about the broader private credit market, Affirm highlighted the breadth and depth of demand for its loans, resulting in a further tightening of spreads on recent deals.
Worst Part(s) of Earnings: Affirm expects GMV growth of 28% (at the midpoint) for the June quarter, a 7-point slowdown, as it faces its most difficult comparison. Still, Affirm alluded to the fact it believes GMV growth for the upcoming fiscal year can grow above the fiscal Q4 exit rate.
Valuation: On a GAAP basis, which incorporates SBC expense, I estimate Affirm trades at an EV-to-EBITDA basis in the low-to-mid 30s, a price I’m unwilling to pay for a business model I’m uncomfortable with.
Synopsis: Despite strong results and an increase in full-year recurring gross profit and adjusted EBITDA targets, shares of Toast fell significantly post-earnings. While I cannot place my finger on the exact reason why, possibilities include: increased competition from Square, a softer Q2 outlook (even though the full-year guide increased), high expectations given Toast’s premium valuation, and commentary about hardware costs being a larger headwind in 2027 vs. 2026.
Most Important KPI(s): GPV growth of 22% ticked down ever so slightly from Q4. Toast’s payment take rate of 50.9-bps expanded by more than 2-bps from a year ago. SaaS ARPU on an ARR basis increased 4% from a year ago, similar to Q4.
Best Part(s) of Earnings: Moderating SBC expense growth and operating leverage are driving significant GAAP profitability for Toast. With few exceptions, Toast’s volume and location growth remains best-in-class among publicly traded PSPs.
Worst Part(s) of Earnings: Toast is forecasting recurring gross profit growth to slow from 27% during Q1 to 23% in Q2 at the midpoint. Based on my modeling and historical precedence, I expect Toast to outperform its guidance. Advanced memory chip purchases are expected to negatively impact near-term FCF and result in a larger headwind from hardware losses in 2027.
Valuation: At $50 per share, the market was pricing exceptional outcomes for Toast not only in U.S. SMB restaurants, but also enterprise, international, and adjacent categories. At around $23 per share, the market is pricing a great outcome only for U.S. SMB restaurants but giving you a reasonably priced call option on Toast’s other growth opportunities.
Synopsis: Block delivered solid Q1 results as growth in key volume streams improved modestly and consumer lending expanded significantly. For the second time since its November investor day, Block lifted its 2026 outlook, now forecasting 19% gross profit growth and a 27% adjusted operating margin. Post-RIF, execution appears steady with an accelerated pace of product development.
Most Important KPI(s): Square GPV grew 11% on a constant currency basis, up 1-point, with over 8% U.S. growth and a 26% increase internationally. Cash App gross profit grew 38%.
Best Part(s) of Earnings: Cash App commerce volume grew 18% and 21% excluding Cash App Business GPV, both slight improvements from Q4, reflecting ongoing strength in Cash App Card volume growth and likely acceleration in BNPL volume as use cases expand. Square is seeing particular strength in food and beverage with GPV growth accelerating 5-points to 21%, nearly matching Toast. Through April, Square U.S. volume growth was 9%, a 1-point improvement from Q1.
Worst Part(s) of Earnings: Although improving, Square’s gross profit growth of 9% trailed reported GPV growth by nearly 4-points. Excluding hardware losses, Square’s gross profit increased 11%. For H2 2026, Block expects Square’s gross profit and GPV growth to converge. Transaction and credit losses nearly tripled as Block continues to scale its consumer lending business.
Valuation: Trading at just 13x on an EV-to-2026 EBITDA basis, Block remains ‘cheapest’ among high-growth payments and fintech peers (Toast at low-20x, Adyen at 16.5x, and Shopify at the mid-50s), suggesting further upside potential if Block can execute on the medium-term financial goals (mid-teens gross profit growth and substantial margin expansion) laid out at its November 2025 investor day.
Synopsis: BILL delivered core revenue growth of 16%, at the higher-end of guidance. More importantly, it announced a 30% workforce reduction that will generate $110 million in annual savings, with only a modest amount ($20-30 million) allocated to growth investments, resulting in a step-up in profitability ($85 million on BILL’s fiscal 2027 consensus revenue forecast of $1.85 billion implies 4.5 points of margin expansion).
Most Important KPI(s): TPV of $88.7B increased 12%, down about 1-point from the December quarter. Core revenue (which excludes interest on client funds) increased 16%, at the high-end of its 14-17% guidance.
Best Part(s) of Earnings: BILL announced a $1B share repurchase authorization, about a quarter of its market cap. The workforce reduction should result in a meaningful step-up in profitability during fiscal 2027. SBC expenses are trending down. Monetization trends remain stable and the rewards rate for its spend and expense product (Divvy) fell 3-bps sequentially.
Worst Part(s) of Earnings: BILL remains unprofitable on a GAAP operating basis and derives significant income from interest on client funds and corporate cash balances, making it susceptible to a meaningful decline in interest rates (which, admittedly, is unlikely over the near-term). BILL slightly lowered the high-end of its fiscal 2026 core revenue guidance with the mid-point of its fiscal Q4 guide (+14.5%) implying a modest slowdown from 16% during fiscal Q3.
Valuation: BILL trades at 2.3x on a price-to-NTM revenue basis, a significant discount to recent deals completed in the B2B payments space. With a buyout looking unlikely (I think), BILL is accelerating its transition to a more profitable business.
Synopsis: Corpay delivered the goods in Q1: organic revenue growth of 11%, a raise of the full-year guide, and bullish commentary on many parts of its business (corporate payments, lodging, and its middle market strategy across the organization).
Most Important KPI(s): Organic revenue grew 11%, Corpay’s fourth consecutive quarter at that level. Corporate payments, which now make up 40% of Corpay’s revenue, grew organically by 18% excluding float income.
Best Part(s) of Earnings: New sales (up 24%) and retention (93.5%) were strong. The lodging business improved sequentially and is expected to exit the year with growth in positive territory (up MSD or better). EPS guidance was raised by about 3%. Corpay is considering additional divestitures and acquisitions to further tilt the business toward corporate payments, where it feels it has a complete solution and the TAM is significant.
Worst Part(s) of Earnings: Corpay still expects around 10% organic revenue growth for the full year as comparisons get more challenging starting in Q2.
Valuation: Corpay may be the ‘deal’ stock that has performed best in payments. What the team has been able to build in corporate payments is truly impressive. The pitch on Corpay is simple: it has leadership positions in markets that are less competitive (fleet, lodging, and tolls) and significant enough to support multiple winners (corporate payments). At just 14x on NTM EPS (burdened for SBC expense and recurring acquisition costs), no one should be sleeping on Corpay.
As always, thank you for reading, and if you’ve enjoyed this, please consider sharing, liking, commenting or subscribing!
Disclosure: As of May 13, 2026, of the stocks mentioned in this report, I am long Visa, Global Payments, Intuit, Adyen, Block, Shift4 Payments, and Broadridge Financial. This report is for informational purposes only and is not a recommendation to buy or sell any stock. Finally, while I rely on the information in this report to guide my investment decisions, you should not, because I cannot guarantee its accuracy.
No posts
Comments
Nothing yet. Say the first thing.
Sign in to join the conversation.