
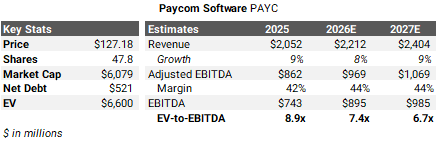
At first glance, there’s much to like about Paycom Software: a founder-led business delivering mission critical solutions to the mid-market through an organically built all-in-one platform, growing underlying recurring revenue at the high single-digits with juicy margins and a rock solid balance sheet, all for the bargain basement price of about 11x next-twelve-months (NTM) headline EPS. Is it too good to be true? Well, in many ways, the answer is complicated.
Although Paycom’s recurring revenue is expected to grow in the high single-digits during 2026, a respectable figure, it’s a far cry from the company’s pre-pandemic growth rate in the high-20% range. Further, despite multiple hints at expected improvement, Paycom’s recurring revenue growth is set to slow from 11% in 2024, which was originally framed as a temporary downshift due to the cannibalizing effects of significant Beti adoption, to 10% in 2025, and 7-8% during 2026, prompting greater scrutiny of potential contributing factors, including the macro environment, company-specific decisions and circumstances, and/or competition:
Stable Macro. Private employment gains have slowed over the past couple of years, falling from 1.4% growth in 2023, to 0.8% during 2024, and an anemic 0.2% increase in 2025. However, through May of 2026, private employment was tracking 0.5% ahead of the prior year, only slightly lower than 2024’s increase. Even if we assume Paycom’s recurring revenue grows above the high-end of its 2026 range, say, at 9%, that represents a 2-point slowdown from 2024 despite similar private employment growth, suggesting macro is not contributing to Paycom’s slowing growth.
Beti Cannibalization. Starting in 2023, Paycom incentivized client relations representatives (CRRs) to push adoption of Beti (through a tripling of their sales commissions) within Paycom’s existing customer base. Beti encourages employees to do their own payroll, reducing preparation time and labor, and catching errors before they happen, which are often costly for employers. While adoption of Beti boosts customer ROI, it had two significant impacts on Paycom’s financial results: first, CRRs sacrificed revenue-generating cross and up-sells to focus on Beti adoption and utilization, which generates little-to-no incremental revenue; and second, significant adoption of Beti results in fewer supplemental payroll runs to fix mistakes that Beti eliminates, reducing Paycom’s revenue. The strategy’s financial impact culminated in a 38% decline for Paycom’s stock following Q3 2023 results (reported October 31), which saw the company miss it’s Q3 revenue forecast by about 1%, guide Q4 revenue down more than 6.5%, and introduce guidance for a 10-12% increase in 2024 revenue versus the consensus expectation of more than 20% growth. While the word transitory was initially used to describe the downshift caused by Beti’s cannibalization, growth has never reaccelerated, but, in fact, continues to moderate.
Client ROI Achievement Front and Center. Paycom’s Beti push is part of a broader effort by Paycom to drive improved ROI for customers without asking for an immediate return, instead hoping to share in the value creation over time. Over the past two years, Paycom has continued to introduce innovative no-or-low-cost solutions, including GONE, its automated decisioning tool for time-off requests, and IWant, an AI-powered, command-driven prompt allowing employees, HR professionals, and executives to easily access information from Paycom’s platform with little-to-no training. Although Paycom has shared anecdotal evidence about customers’ positive reaction to these new features, a meaningful impact on Paycom’s sales or retention has yet to materialize. Even though client employee growth ticked higher during 2025, along with gross revenue retention, Paycom’s 2026 guidance does not suggest accelerating momentum.
Sales: Stops and Starts. At the end of the day, Paycom’s ability to grow requires feet on the street. Paycom defines capacity by the number of sales teams. A team consists of one manager and several other sales professionals. Paycom has at least one sales office in 41 of the top 50 U.S. markets, including multiple offices in seven cities. While Paycom has mentioned an aspirational goal of 100 sales teams, it ended 2025 with only 58. Further, growth in sales teams has slowed meaningfully. From 2016 to 2018, Paycom increased its sales teams by seven, from 42 to 49. Over the next seven years, only nine sales teams were added:

To open a new sales office, Paycom elevates a high-performing sales professional to manager, relocates them, and tasks them with hiring a team of sales professionals, which are usually college graduates. It takes 24 months for a new sales team to mature. In addition to a lack of candidates to start new offices, Paycom has experienced turnover at the top of its sales organization. Early in 2024, Amy Walker took over all of sales for Paycom, with CEO Chad Richison noting on the Q1 2024 call that she was having a “dramatic impact on that group…and we continue to improve week after week” and in mid-2025 that Paycom had gone back to the “basics” on training. Fast forward less than two years and Jeff York, who was Chief Sales Officer for Paycom from 2007 to 2021, returned as leader of the sales organization in early 2026. At the same time, Paycom was pulling sales teams from the field to retrain them on full solution automation and adding two sales professional per office, resulting in about 100 additional sales professionals for Paycom. Although Paycom does not provide specific detail or guidance on new sales bookings, according to Richison, the retraining “put a little air in the line” with an expectation for bookings to “have some inflection” throughout the year.
Increasing Mid-Market Competition. While the payroll and HCM industry has always been competitive, major players are increasing their focus on the mid-market—Paycom’s sweet spot—and delivering positive results, suggesting a material impact on Paycom:
ADP’s modernization of Workforce Now, its HCM platform for mid-sized businesses, has contributed to accelerating mid-market customer growth. From fiscal 2019 to 2023, the number of Workforce Now clients increased 10,000—from 70,000 to 80,000. The next 10,000 increase took just two years as Workforce Now clients exceeded 90,000 at the end of fiscal 2025.
One of Intuit’s big bets is on the mid-market. The company’s Intuit Enterprise Suite combines QuickBooks with payroll, payments, and marketing, and its newly launched Workforce solution goes even further, “equipping businesses with a robust HCM solution that automates, simplifies, and syncs their workforce management, including payroll, time tracking, benefits, recruiting, hiring, performance and compliance on a single platform.” In the past, Intuit’s mid-sized businesses usually graduated to more sophisticated platforms like Paycom’s. Now, many are staying, and adopting more solutions from Intuit as they grow. For fiscal 2026, I expect Intuit’s mid-market ecosystem to generate more than $1.6 billion of revenue, adding approximately $450 million, nearly 3x the increase for Paycom.
Workday is aggressively moving down-market, from large enterprises to mid-sized businesses, highlighted by the launch of Workday GO at the start of 2025. GO combines Workday’s leading HCM and finance capabilities with AI-powered agents and fast implementation times (less than 60 days) to attract mid-sized businesses. Workday reported medium enterprises “drove roughly 60% of net new ACV (annual contract value) in FY’26.” Given an expectation for an additional $1.1 billion of subscription revenue for Workday in fiscal 2027 implies medium enterprises are contributing hundreds of millions of new subscription revenue, also multiples of the increase for Paycom.
Valuation: More than Meets The Eye, But Still Attractive. Paycom’s non-GAAP net income overstates earnings power in two important ways: first, it adds back stock-based compensation; and second, it ignores the net cash outflow that consistently arises from obtaining and fulfilling contracts, which can be measured as the amount capitalized minus expensed. Paycom is unique in the sense it amortizes contract costs over a 10-year period as opposed to 3-8 years for competitors, resulting in lower amortization expense for Paycom, which overstates both GAAP and non-GAAP profitability. As a result, the multiple on Paycom’s ‘headline’ EPS is materially lower than reality, in my opinion.
Over the last twelve months (LTM), Paycom generated $522 million of non-GAAP net income, which adds back stock-based compensation expense. Free cash flow of $442 million over the same period represented less than 85% of non-GAAP net income, primarily reflecting the $79 million gap between capitalized and amortized costs for obtaining and fulfilling contracts (i.e., a net cash outflow). Reducing free cash flow by stock-based compensation results in about $332 million of non-dilutive earnings power for Paycom over the LTM, only 63% of non-GAAP net income. Applying a similar ratio to the NTM consensus EPS estimate of $11.30 equals $7.17 and implies a price-to-earnings multiple of nearly 18x, much greater than about 11x on a non-GAAP basis. However, this is likely too simplistic a method and ignores the likelihood of continued declines in stock-based compensation and net cash outflows from obtaining and fulling contracts as a percentage of revenue:
Based on my modeling, I estimate GAAP net income of $483 million over the NTM, which includes stock-based compensation of $81 million, or 3.6% of revenue, versus $111 million, or 5.3% of revenue, during the LTM. I assume the net cash outflow from obtaining and fulfilling contracts is $78 million over the NTM, or 3.5%, versus $79 million, or 3.8% of revenue, during the LTM. Reducing my GAAP net income estimate of $483 million by $78 million results in $405 million or $8.44 of normalized EPS, implying a P/E of about 15x:
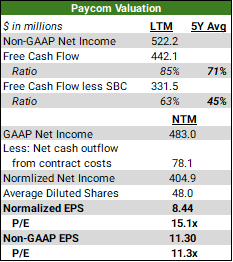
I believe this is an attractive valuation for Paycom. In fact, on an apples-to-apples basis, Paycom trades at a discount to ADP and Paychex, slower-growing competitors. However, performing a similar calculation for Intuit yields a P/E of only 12.5x on about $21 of normalized EPS for fiscal 2027, a discount to Paycom, ADP and Paychex, despite a superior growth profile for Intuit. As a result, among this group, I still strongly prefer Intuit over everyone else.
Organically built all-in-one platform. Unlike competitors that have different platforms for different market segments, acquire companies to gain or enhance specific features and functionality, or open their platforms to third parties, Paycom has a single organically built all-in-one platform that is largely self-contained and discourages third party integrations. This approach carries both advantages and limitations for Paycom and its customers. For Paycom, a single platform simplifies and speeds product development, lowering costs. It also gives Paycom a holistic view of client data, providing an excellent base for building AI-powered tools. For customers, an all-in-one platform is ideal for smaller and mid-sized businesses that wish to consolidate their payroll and HCM functions with a single vendor. Paycom’s single source of truth (i.e., database) also eliminates costly mistakes associated with multiple back-office integrations. An employee record entered once drives all modules on Paycom’s platform. Unfortunately, larger businesses and more sophisticated mid-market companies, segments Paycom views as key drivers of future growth, may not be satisfied with Paycom’s self-contained platform. They may want additional capabilities, including a fully outsourced option, or to integrate a ‘best of breed’ point solution, deterring them from considering Paycom.
Founder-led. Chad Richison founded Paycom in 1998 and has been CEO throughout the company’s entire history, with the exception of a short period of time during 2024 when he served alongside a co-CEO. Christopher Thomas left the company for personal reasons in May 2024, only three months after accepting the co-CEO job. In 2016, Richison was elected Chairman of Paycom’s Board, giving him effective decision-making control over the company. Richison owns about 12.5% of Paycom’s outstanding stock. Investors favor founder-led businesses because shareholder interests are aligned with the CEO’s, who typically take a long-term view of the business, resulting in healthy investment levels and disciplined capital allocation. There is no doubt Richison’s long-term track record with Paycom is exceptional and his decision to sacrifice near-term returns for improved customer ROI may prove to be the winning strategy. My concern lies with Paycom’s limited transparency, a recent tendency to over-promise and under-deliver, and the possibility the company may be stuck in its ways, unwilling to consider different options to improve performance:
Although not too different from peers, Paycom’s transparency is more limited, in my opinion. The company stopped giving quarterly guidance, provides no detail and limited color when discussing new sales bookings, and does not offer any medium or long-term guidance to anchor expectations.
Given more limited transparency, investors must ‘read the tea leaves’ in order to assess medium-term expectations. In this regard, the tea leaves have been over-promising and under-delivering, in my opinion. During 2024, the company selectively disclosed attractive new unit sales and starts, painting an optimistic picture: new unit sales were up 24% in Q2 2024, and 15% YTD, with July 2024 starts up 40% from a revenue perspective. In 2025, Paycom emphasized its focus on growth. From the Q3 2025 call: ”…over the last 2 years, we’ve done a significant amount of work that needed to be done throughout our organization. And as we sit here today, we’re all focused on one thing, and that’s capturing more market share, and that’s available to us now. We have a very differentiated product. It’s meaningful.” Of course, an acceleration in growth has yet to materialize.
Change can be a good thing. In no way am I suggesting change is necessary to improve Paycom’s performance. Instead, an openness to change may be appropriate given flagging performance. Among the topics that deserve more discussion, in my opinion, are whether Paycom’s closed platform is ideal for larger businesses, outside partners are needed to improve Paycom’s distribution to drive improved sales growth, and a more balanced capital return approach, including a higher and growing dividend, would attract a larger number of shareholders.
AI. No software discussion would be complete without mentioning AI. While all payroll and HCM companies, including Paycom, have touted efforts to incorporate AI into internal operations, service models, and customer-facing products, investors increasingly question whether the system-of-record model remains viable in a world where AI can easily ingest, analyze, and act on large amounts of data at little cost. In an era of AI, I believe Paycom has more positives than negatives. The biggest plus, in my opinion, is Paycom’s single platform, which helps it harness the entirety of its data set to build the best AI-powered tools for clients. I still believe proprietary data holds value. However, Paycom’s mid-market customers may have more resources to build their own software—more than small businesses, where payroll and HCM providers are best positioned, but less than enterprises.
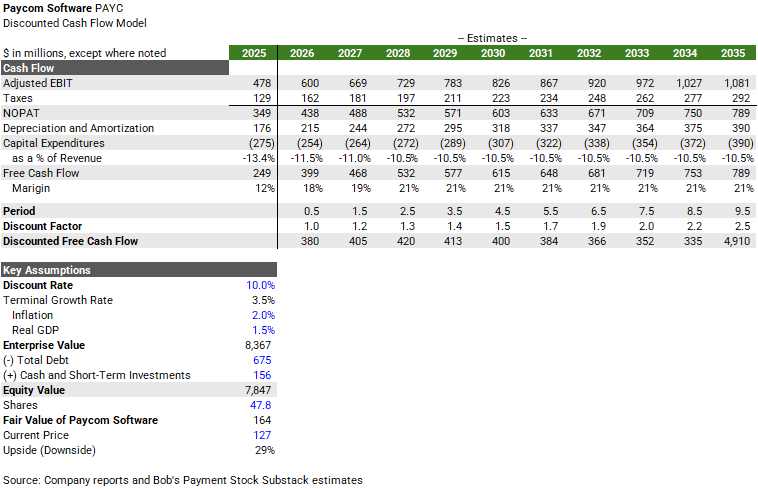
My fair value for Paycom is $164. Key assumptions are:
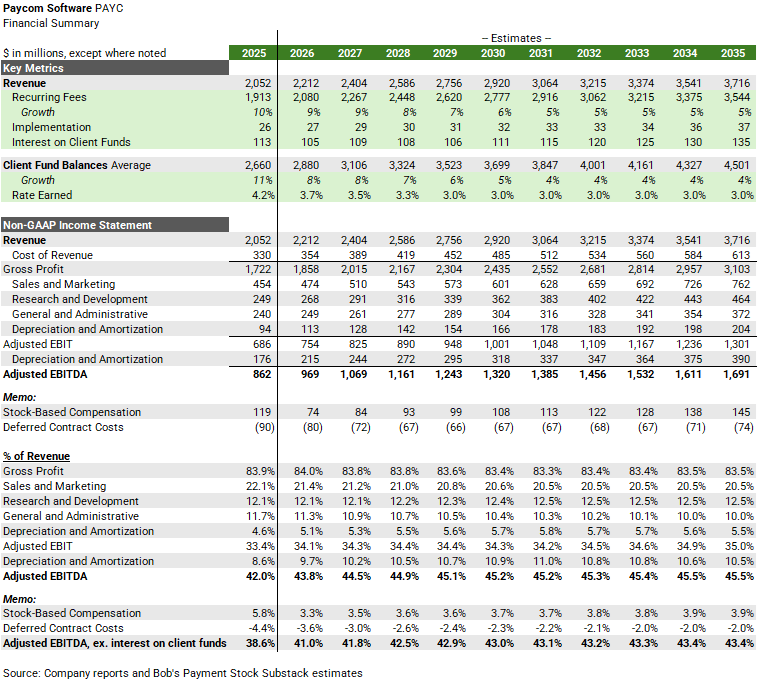
Revenue. I assume Paycom’s total revenue grows at a compound annual rate of about 6% from 2025-2035. Recurring fees, which represent 93% of Paycom’s total revenue, are expected to grow by nearly 6.5%, slowing from 10% growth in 2025 to 5% by 2031, and remaining steady thereafter. I estimate implementation revenue will grow approximately 3.5% over the same time. For interest on client funds, I assume average client fund balances advance at a slightly slower pace than recurring fees, growing at a compound annual rate of approximately 5.5% over the next decade. Assuming Paycom generates interest at my long-term fed funds rate estimate of 3% implies interest on client funds will grow at a compound annual rate of less than 2% from 2025-2035. I believe my revenue assumptions reflect only modest market share gains for Paycom over time, an appropriately conservative approach given my concerns about increased mid-market competition.
Gross Margin. I assume Paycom’s gross margin averages 83.6% over the next decade, about 1-point lower than the past decade. I believe data center and AI investments will push depreciation and amortization included in cost of revenue up to more than 5% of revenue by 2030, about 1-point higher than 4% of revenue during 2025. Operating expenses included in cost of revenue, which reached 13.5% of revenue in 2024, are expected to fall to 11.4% by 2026, primarily reflecting lower headcount—Paycom’s employees declined by 21% during 2025. Over the long-term, I expect operating expenses included in cost of revenue to represent 11.5% of revenue.
Cash Operating Expenses. Over the next decade, I expect Paycom’s cash operating expenses to fall from 45.9% of revenue in 2025 (and 44.8% during 2026) to 43% by 2035, with leverage occurring in sales and marketing expense, led by advertising, and general and administrative expenses. I assume Paycom’s research and development expense will rise from 12.1% of revenue in 2025 to 12.5% of revenue by 2031, and remain steady thereafter, reflecting Paycom’s commitment to internally developing products.
All of these assumptions imply Paycom’s adjusted EBITDA margin reaches 45.5% by 2035, up 160-bps vs. my 2026 estimate of 43.9%.
To guide my free cash flow estimates, I also model stock-based compensation and deferred contract costs. After projecting a fall to 3.3% of revenue in 2026, I estimate Paycom’s stock-based compensation will rise to 3.9% of revenue by 2035. Reflecting Paycom’s maturation and slowing sales growth, I estimate the cash outflow from obtaining and fulfilling contracts will fall to 2% of revenue by 2035.
For my DCF model, I assume:
A free cash flow calculation as follows:
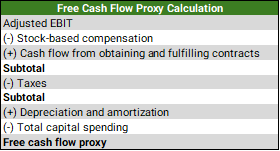
A tax rate of 27%
Depreciation and amortization reaching 11% of revenue by 2031 before declining to 10.5% in 2035, aligning with total capital spending during 2035
A discount rate of 10% and a terminal growth rate of 3.5%
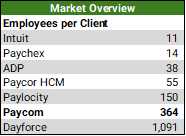
Paycom provides a cloud-based human capital management (HCM) platform to small and mid-sized businesses primarily in the United States. The company offers a global HCM platform and native payroll processing in Canada, Mexico, the U.K. and Ireland, but international contribution is believed to be immaterial at this point. Paycom targets businesses with 50-10,000 employees. At the end of 2025, Paycom had 20,321 clients based on parent company grouping with 7.4 million employee records stored on its platform, implying 364 employees per client.
Over the past decade, employees per client grew at a compound annual rate of 4.4%, reflecting Paycom’s move upmarket. However, recent increases have been modest, suggesting Paycom may be struggling to attract large enterprises:

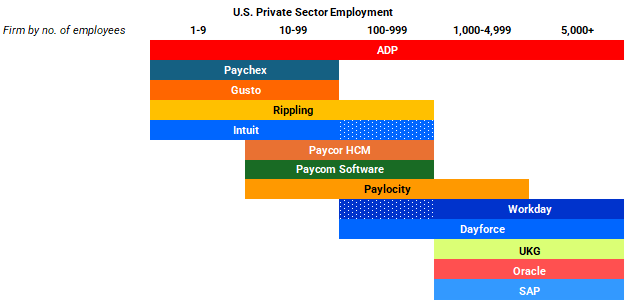
Paycom sits squarely in the mid-market:
And faces significant competition:
Paycom’s 2025 10-K lists 38 different solutions, or modules, offered on its platform across payroll, talent acquisition and management, time and labor, and HR management. Paycom encourages employee participation in human resource administration through user-friendly mobile apps. A client must utilize Paycom’s payroll processing to access all features of Paycom’s platform.
Paycom generates three types of revenue: recurring fees, implementation revenue, and interest on client funds:
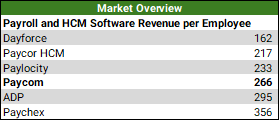
Recurring fees are based in part on the number of modules adopted by clients and client employees, as well as the number of payroll runs and forms filed by Paycom. Payroll processing accounts for the majority of Paycom’s recurring fee revenue. In 2025, Paycom generated $266 in recurring fees per client employee. Over the past nine years, recurring fees per client employee grew at a compound annual rate of 8%, led by increased adoption of modules by clients and to a lesser extent pricing strategies:

Revenue per employee has an inverse correlation with employees per client. Businesses with a small number of employees generate the most revenue per employee (i.e., ADP and Paychex) while businesses with a large number of employees generate the least revenue per employee (i.e., Dayforce). Not surprisingly, Paycom sits around the middle. However, even though Paylocity and Paycor HCM have fewer employees per client than Paycom, they generate less revenue per employee, suggesting Paycom’s pricing may be at a premium to those companies:
Paycom charges a one-time fee that represents 10-30% of the contract’s value at time of inception. Paycom recognizes the payment as implementation revenue over a ten-year period.
Interest on client funds occurs from the timing difference between when funds are collected and when they are remitted to employees and taxing authorities, which can span up to 120 days. In 2025, Paycom’s average client fund balance was $2.66 billion by my estimate. Paycom invests client fund balances in short-term securities, including commercial paper, overnight CDs, and two-year treasuries, among others. Paycom captures a significant portion of the fed funds rate with its investment portfolio. Paycom began reporting interest on client funds in Q4 2024, providing retrospective reporting back to 2022. Paycom discloses average client fund balances on its quarterly earnings conference calls. Historically, Paycom’s average client fund balance has grown at a modestly slower rate than recurring fees, but above client employee growth:

Guidance: Outperformance Moderating
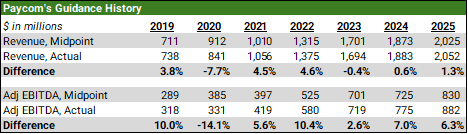
Historically, Paycom generated healthy upside to guidance. Excluding the pandemic year of 2020, from 2019-2022, Paycom beat its initial revenue guidance by an average of 4.3%. That changed in 2023 with Beti cannibalizing revenue from extra payroll runs and cross-sells from the CRR group, leading to a miss of 0.4%. Although Paycom beat revenue expectations during 2024 and 2025, it was versus more modest expectations and outperformance was much smaller, averaging less than 1%. Similarly, adjusted EBITDA upside also moderated in recent years, but still remains significant versus Paycom’s initial outlook:
Go-To-Market
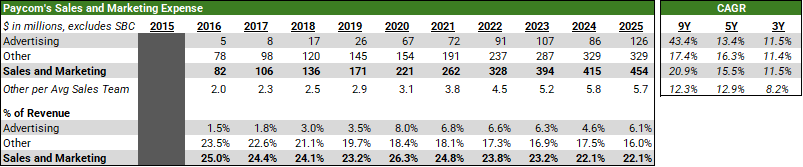
Among peers, Paycom’s sales approach is unique. It relies only on an internal sales force, eschewing the partners many other payroll and HCM providers rely on to sell their products, including accountants, banks, insurance brokers, benefits administrators, and systems integrators, among others. Additionally, and as a result, Paycom spends heavily on advertising to attract customers. In 2025, Paycom’s advertising expense was $126 million, representing more than 6% of revenue. Although ADP and Paychex do not disclose advertising expense, Paylocity (1%), Dayforce (1.5%) and Paycor HCM (5.5%) all spend less, some significantly so.
From 2016-2020, Paycom’s advertising expense increased from 1.5% of revenue to 8%, before falling back to 6.1% in 2025. The remaining portion of sales and marketing expense (i.e., Other in the table below), excluding stock-based compensation, has fallen from 23.5% of revenue in 2016 to only 16% of revenue during 2025. Per average sales team, Other sales and marketing expense was $5.7 million during 2025:
Balance Sheet and Cash Flow
Historically, Paycom has carried little-to-no debt. That changed in Q1 2026 when the company borrowed $675 million to help fund a repurchase of 8.375 million Paycom shares at $127 per share for a total price of approximately $1.06 billion. Still, even after the borrowing, Paycom’s net debt-to-EBITDA ratio is only 0.7x, providing them ample flexibility to invest, repurchase more shares, or boost its dividend. Paycom has never made an acquisition and there is no indication the company would consider doing so at this point.
Over the past decade, Paycom’s cumulative free cash flow represented only 70% of non-GAAP net income:

This reflects two dynamics: the previously mentioned cash outflows from obtaining and fulfilling contracts, and a sizable gap between depreciation and amortization and total capital spending:

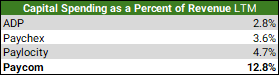
Paycom owns and operates their own data centers, requiring significantly greater capital investment relative to peers:
As always, thank you for reading, and if you’ve enjoyed this, please consider sharing, liking, commenting or subscribing!
Disclosure: As of June 29, 2026, of the stocks mentioned in this report and across payments and fintech, I am long Visa, Global Payments, Intuit, Block, Adyen, Shift4 Payments, Paychex, Mastercard, and Broadridge Financial. This report is for informational purposes only and is not a recommendation to buy or sell any stock. Finally, while I rely on the information in this report to guide my investment decisions, you should not, because I cannot guarantee its accuracy.
No posts
Comments
Nothing yet. Say the first thing.
Sign in to join the conversation.