
Since early March the flow of barrels through Hormuz has been constrained to a trickle. Some of course got rerouted by the Saudis to the Red Sea, the UAE through their pipeline, and were hidden through illicit Iranian efforts. But such efforts have cushioned roughly 6 of the 20mln bbl/d that were flowing through Hormuz before the war.
This 14mln bbl/d cut from March through July totals 2.1bln bbls in total over the 5 month period and counting. Haircut it a generous 10mln bbls for the 30 days of the MoU and you are still talking 1.5 bln bbls on the low end for the accumulated reduction in supply due to the war.
And yet when you look at what has come out of measured inventories… well it’s pretty de minimis overall.
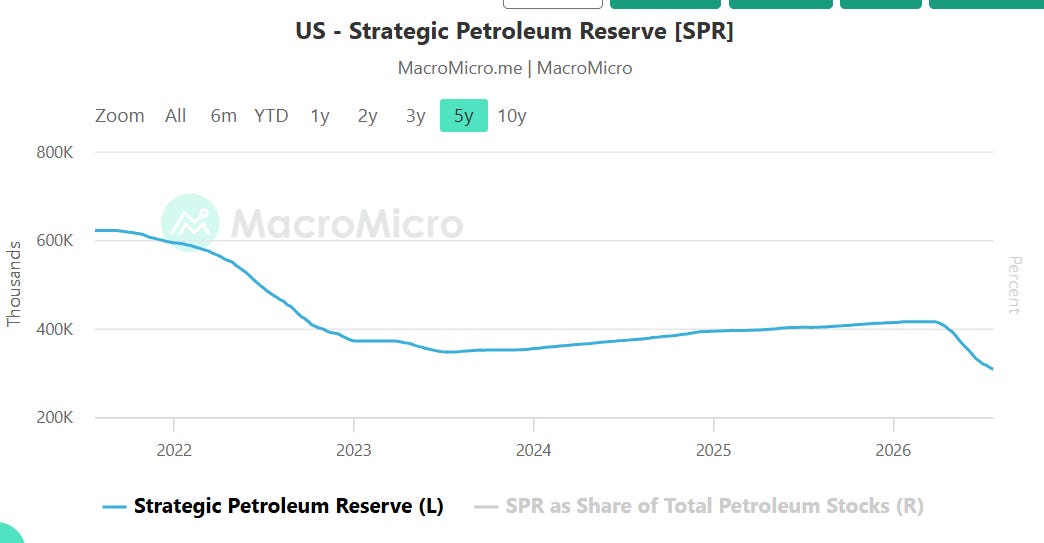
US inventories - commercial plus SPR - are only down about 250mln bbls.
Asia outside of China is down 125mln bbls or so based on import data.
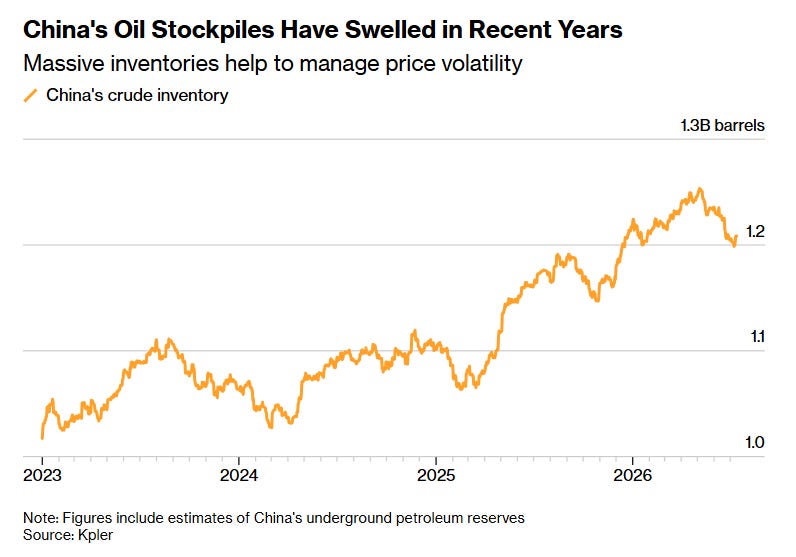
Western satellite based imaging suggests China has scaled back their stocks by less than 75mln bbls.
Taken together this suggests a global inventory drawdown from peak levels of about 500mln bbls at most in total, leaving 1bln bbls since the start of the war implicitly absorbed through reduced demand. That amounts to a roughly 6% cut in global oil demand over the last 5 months. Its a cut in demand is about double the GFC, on par with the late 70s, and not too far away from the reduction seen during the covid stop.
If that’s the case, it’s an extraordinary outcome considering 1nb Brent has averaged 40 bucks above the pre-war levels over the last 5 months. Up, sure, but by no means an extraordinary surge in prices. It would amount to something like 3-5x the price and/or activity sensitivity seen in past disruptions.
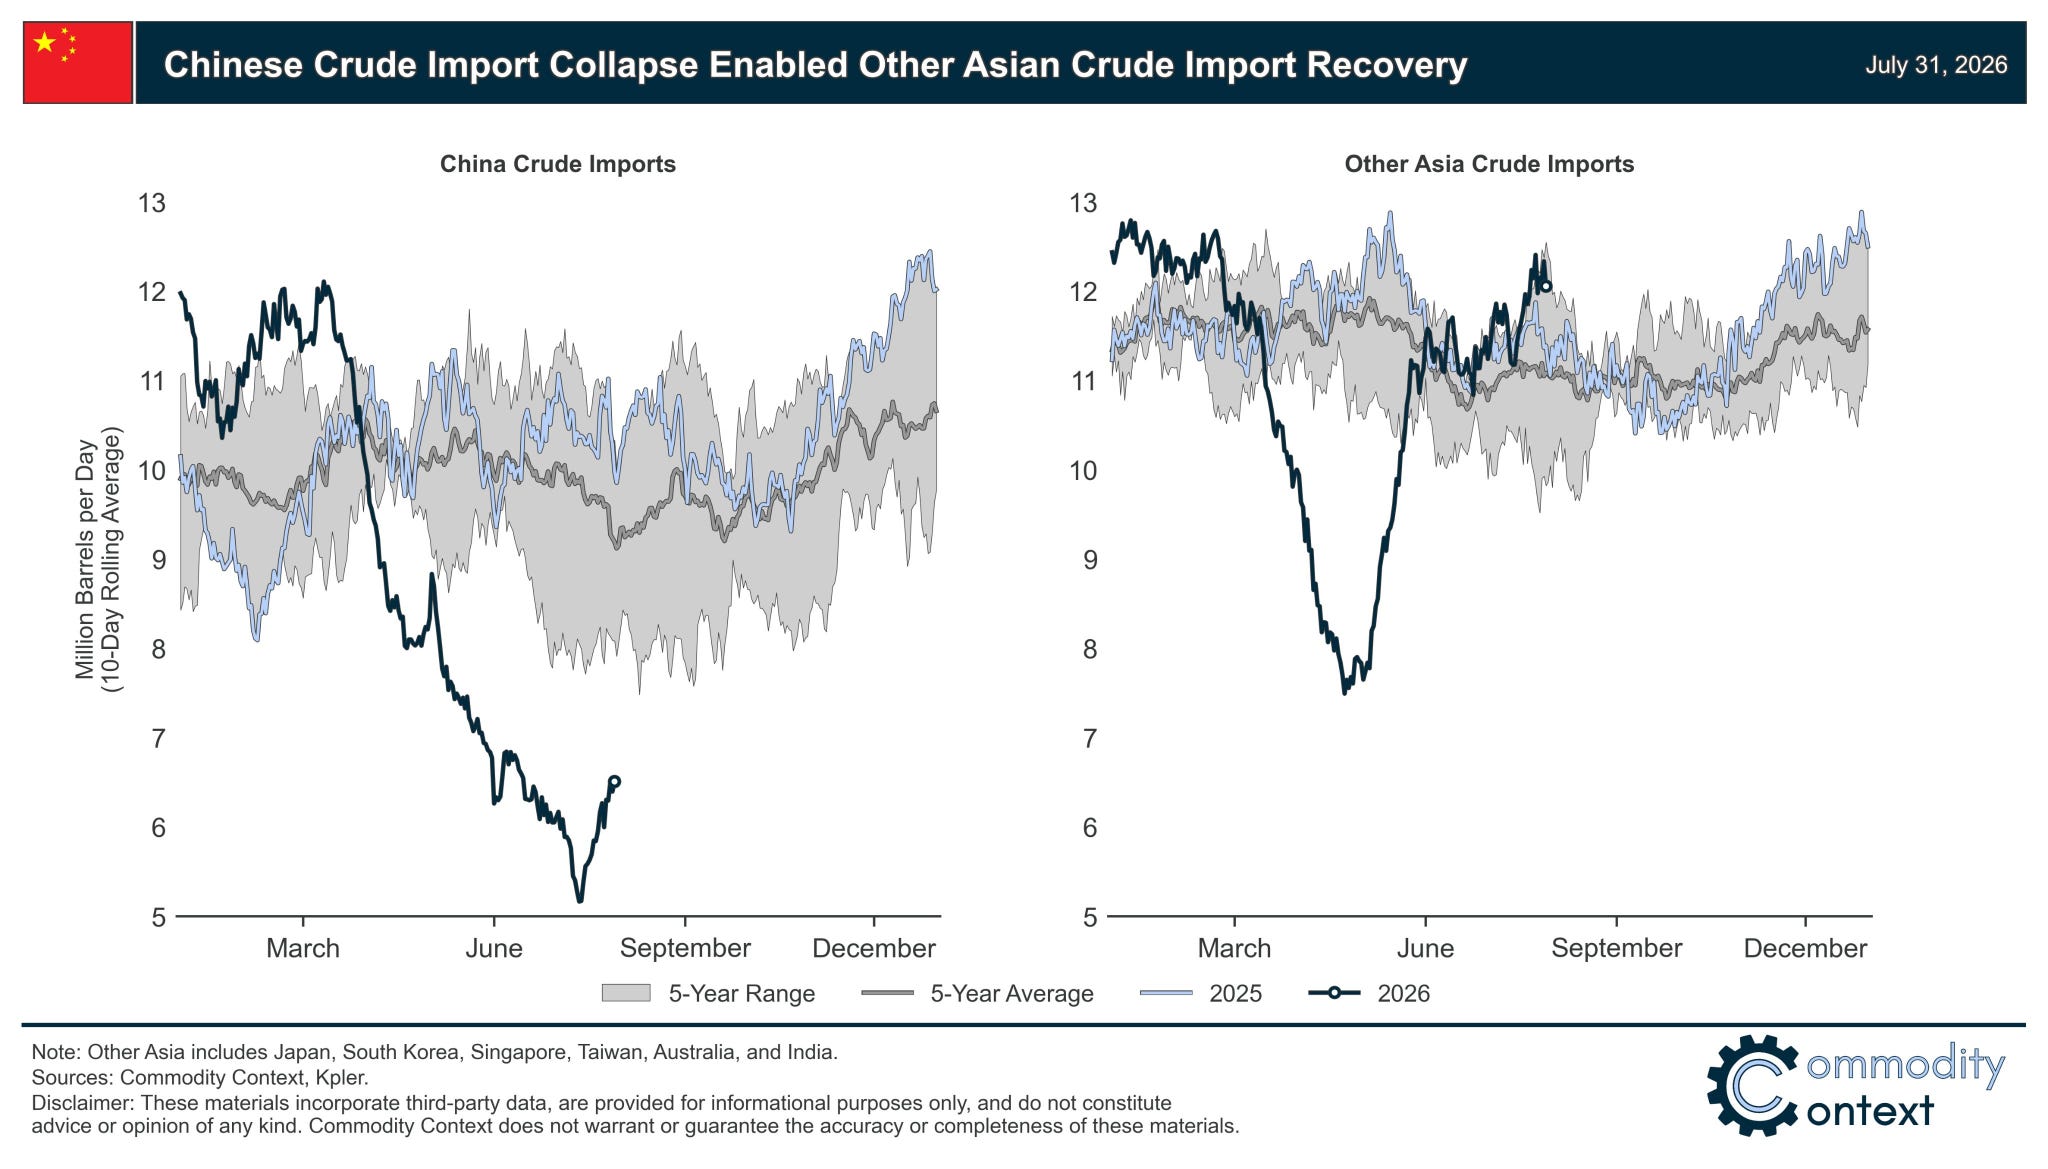
It seems much more likely that Chinese inventories are being drawn down far faster than whatever the Western measures suggest. The import data (which is pretty reliable) suggests a huge cut. For instance June itself was down 6mln bbl/d vs. pre-war levels. That’s nearly 200mln bbls in 1 month alone!
While your eyes may have glazed at what looks to be an accounting exercise, it’s far more important than that. Economic bulls & oil bears point to the minimal drop in inventories and suggest that the disruption can go on for a long time ahead without too much of an issue.
But if its really China cushioning the global price by severely drawing down their stocks, the global cushion may be much smaller than many believe.
A Look At The Numbers
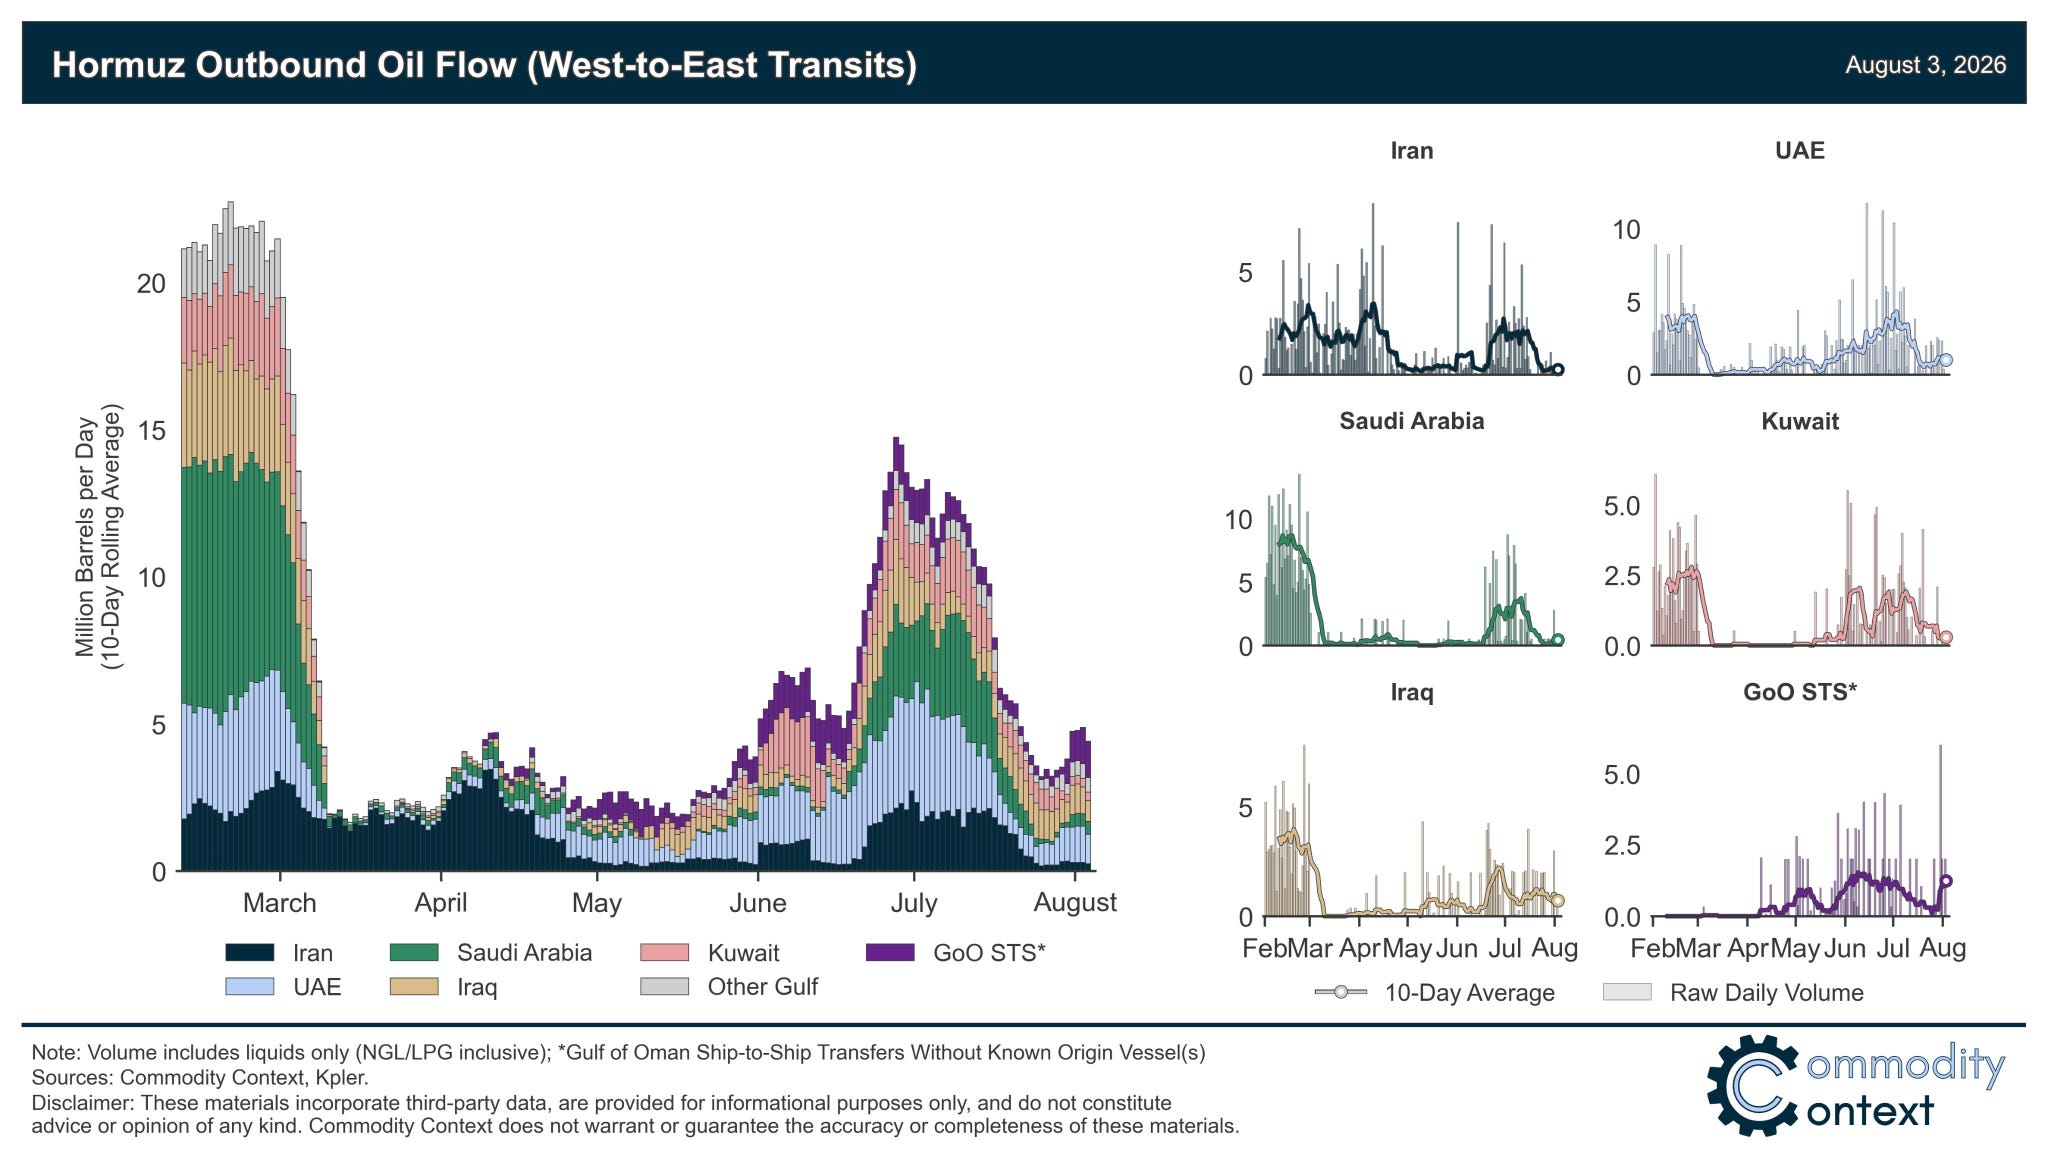
The Hormuz disruption remains firmly in place with total flow running roughly 16mln bbls/d below pre-Iran war levels.
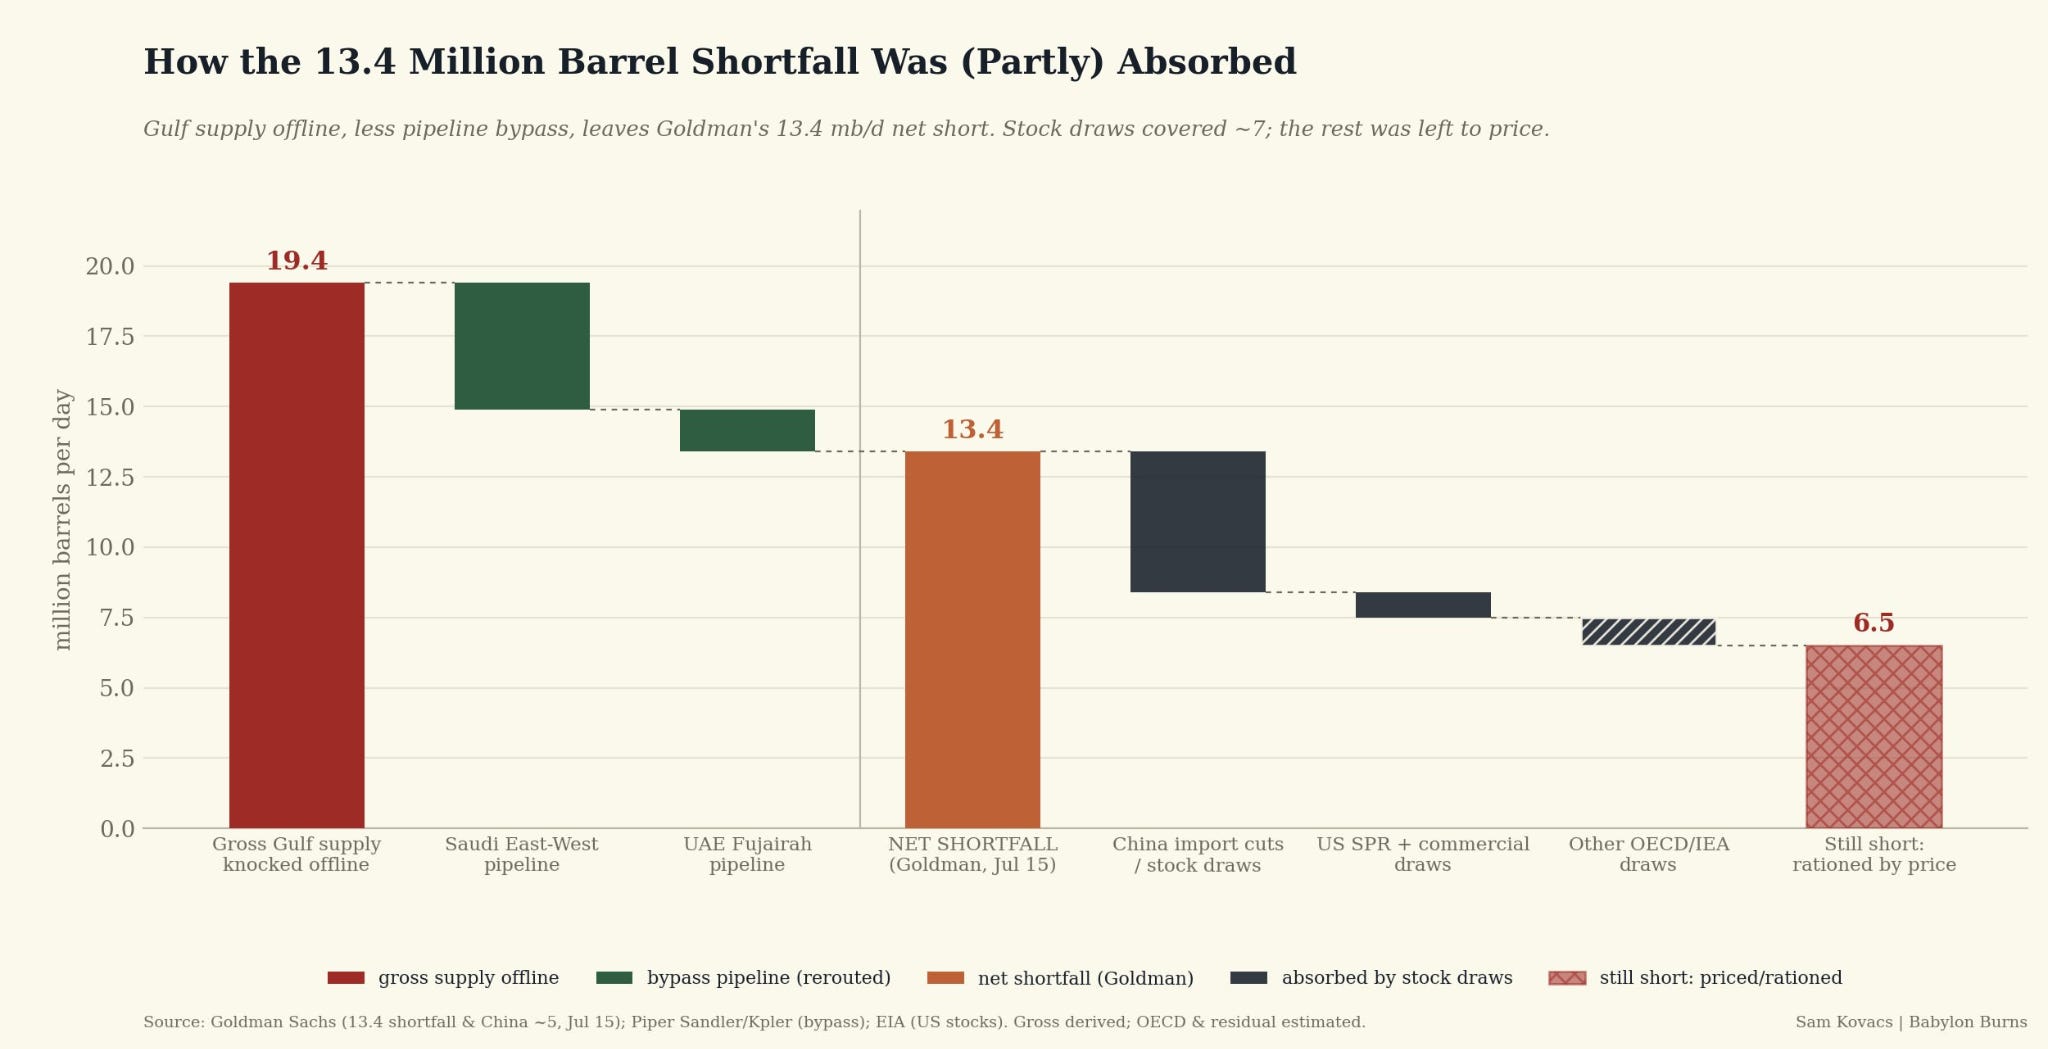
Of course some of the supply disruptions has been partially offset by other efforts, but when you take those into account (middle orange bar) you are still looking at a run rate of roughly 13mln bbls/d of reduced supply relative to pre-Iran war levels.
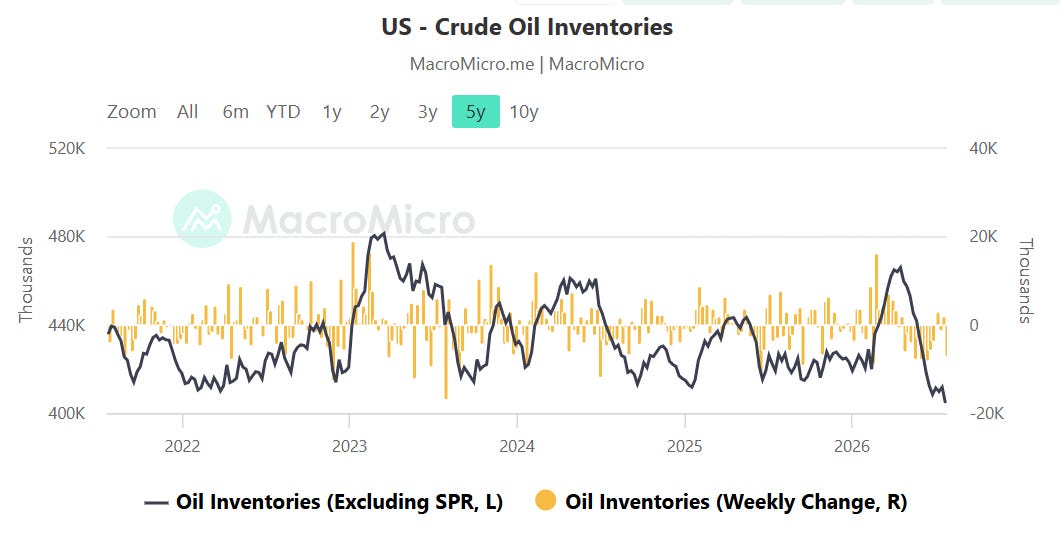
A drawdown in US stocks has helped cushion this reduction in supply. Commercial crude inventories are down about 70mln bbls since the start of the war.
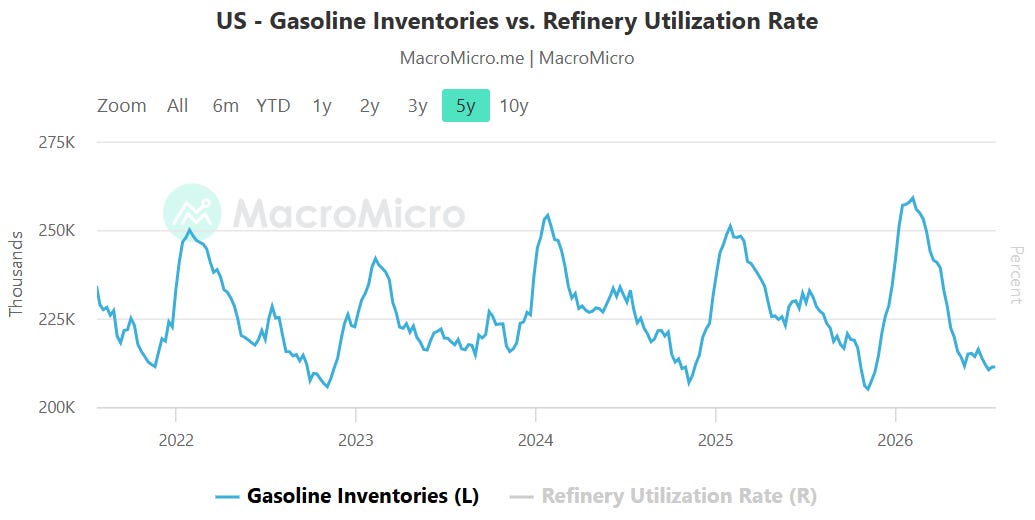
Products stocks are also down about 80mln bbls.
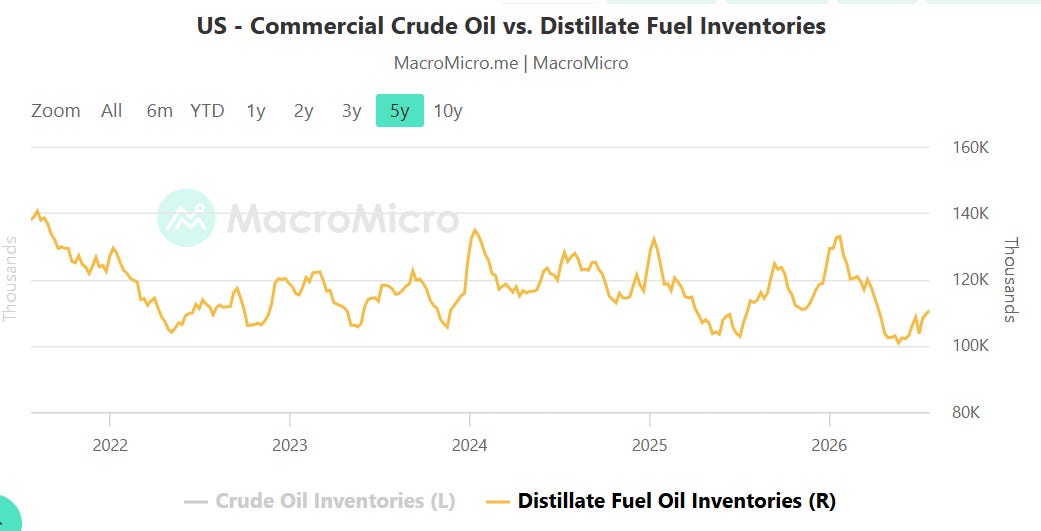
Add in another roughly 100mln bbl drawdown of the SPR and you’ve got the US cushion of about 250mln bbls supplied to the market since the beginning of the war.
Much of the rest of the cushion then has to come from Asia. Notably Asia ex-China only saw a brief reduction in their crude imports during the height of the conflict. Whether it was demand destruction or inventory drawdown it was pretty modest, amounting to roughly 1.5mln bbls/d over 3 months or just over 100mln bbls in total.
The rest has to be cleared by China. As the chart shows, there was a complete collapse in imports from China since the start of the war. In June the figure was down nearly 7mln bbls/d relative to pre-war levels. Thats a 200mln bbl reduction in just one 30d period!
And yet the China observed stocks since the start of the war are down less than 75mln bbls in *total.* Really?
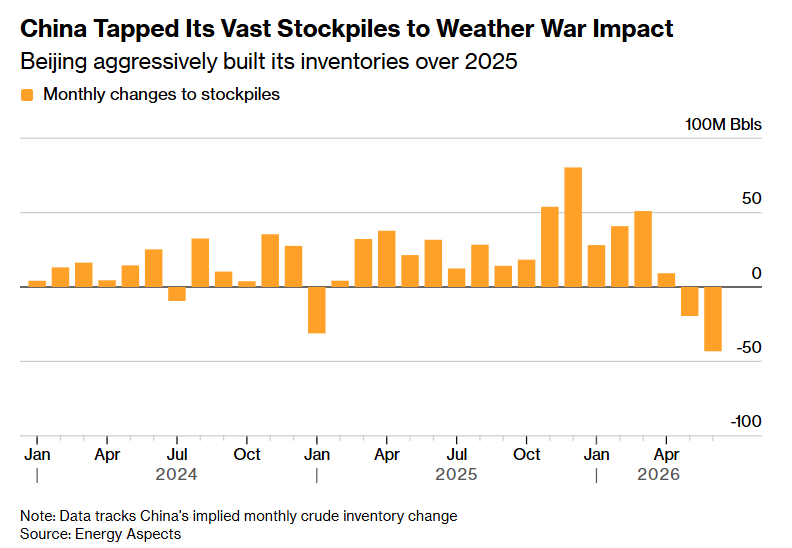
That suggests that despite the single greatest oil supply disruption in the post-war period, China has seen a reduction in stockpiles that is barely noticeable relative to normal seasonal volatilities.
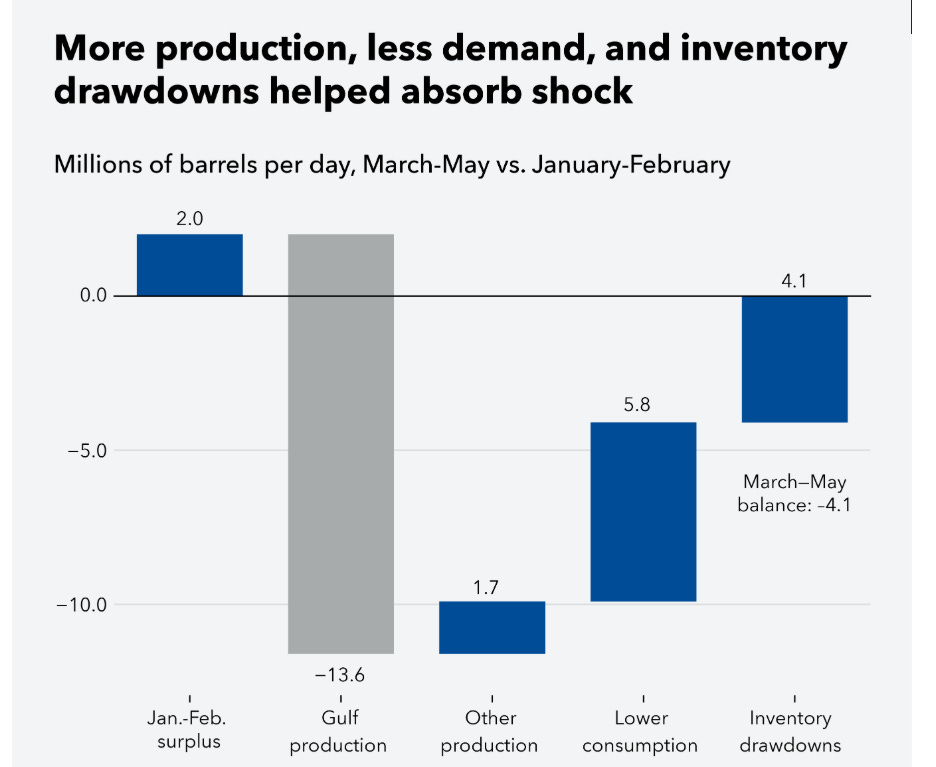
If that is the case then basically the only way to balance the market would have been to experience a significant reduction in consumption - amounting to a 6mln bbl/d run rate give or take. If you are a Western economist (like those at the IMF below) that’s basically how the numbers have to work out. And for what its worth this is assuming a 2mln surplus coming in.
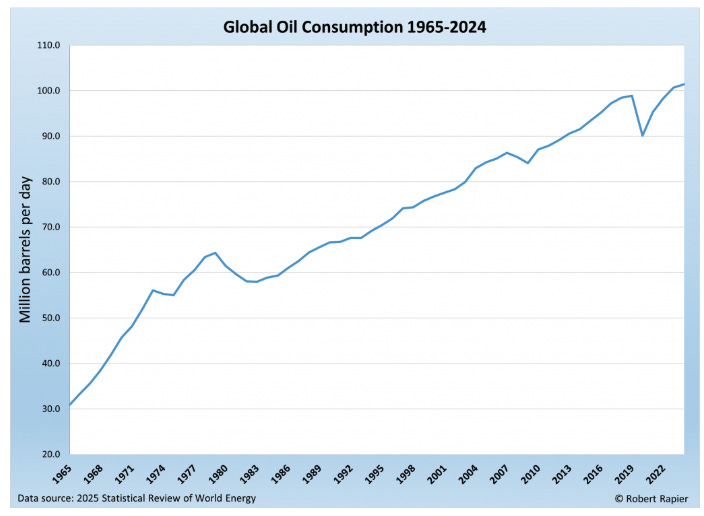
But putting that supposition into any historical context suggests it lacks credibility. If you look at the post-war period a 6mln bbl/d reduction in demand (or about 6% of global demand) would be an extraordinary outcome. About double the GFC. Not all that far from ‘20 during covid. And even in the ballpark of the 70s cut in demand when oil prices went up 5x in short order.
Bottom Line
Many folks are arguing that the reason there has been so little price pressure since the start of the war is because there has been extraordinary demand destruction. Of course that is plausible, but it sure seems hard to believe in historical context.
It seems more likely that stocks have been drawn down more than measured, leaving far less cushion available for continued disruption than the bears would suggest.
Comments
Nothing yet. Say the first thing.
Sign in to join the conversation.