
Disclaimer
The data and information presented here are for informational purposes only and are provided “as is” without any warranty. This report is not intended or offered as financial, legal, regulatory, tax, or investment advice. References to particular assets or protocols are not recommendations or solicitations to engage with said asset or protocol. SKY voters and Sky Governance retain full control over parameter changes and are free to use or disregard this information as they see fit. This post does not constitute financial or investment advice. For financial advice, consult a professional advisor.
Introduction
Our market overviews aim to keep the Sky community informed and to provide context regarding our decision-making process, particularly in relation to our parameter proposals in the Sky Ecosystem. In this market update, we examine recent trends in legacy finance, the cryptoasset landscape, and the Sky Ecosystem from June and July 2025. Note that all market commentary and data is updated as of July 24, 2025.
Legacy Finance Conditions
US Trade Policy
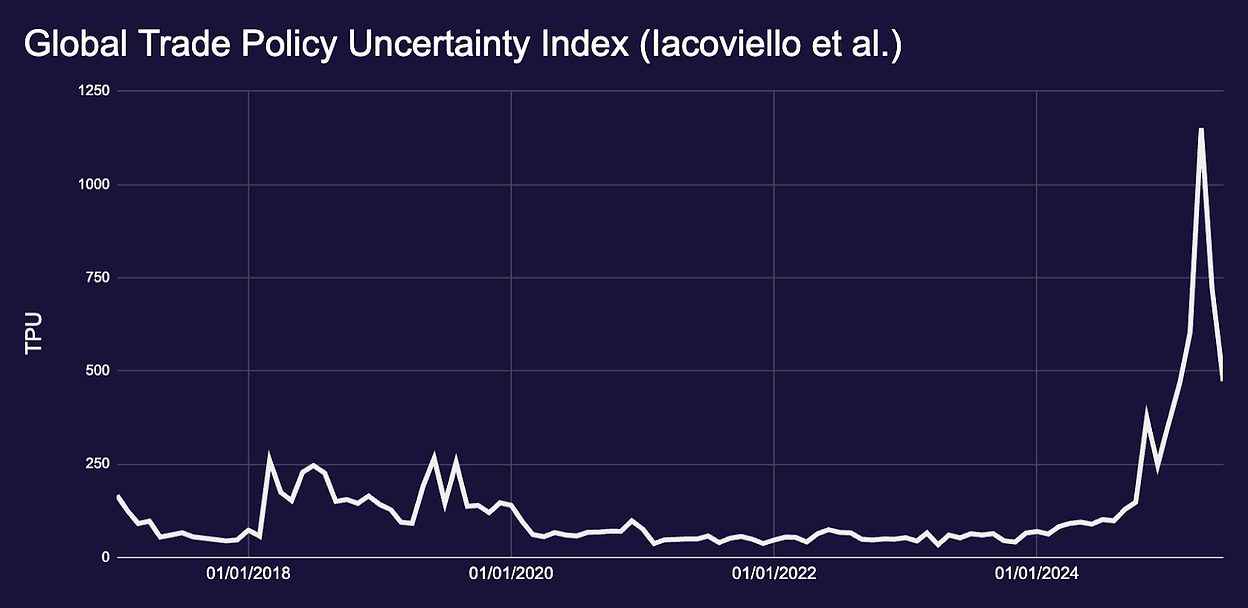
US tariff announcements sparked a surge in trade policy uncertainty throughout H1 2025. The consensus view was that the increased uncertainty would negatively impact investments, jobs, and economic activity in countries exposed to tariffs. However, according to Goldman Sachs Research, despite policy uncertainty spiking, overall activity has mostly followed prior trends since late 2024. They provide three main reasons for why trade uncertainty has not been more tangible as of yet: (i) trade-exposed investments by manufacturing firms account for a relatively small share of GDP in most countries, (ii) global financial conditions have eased since the start of the year, which may have dampened the drag from trade policy uncertainty, and (iii) uncertainty measures may have overstated the initial shock following “Liberation Day”. Trade policy uncertainty as measured by the Global Trade Policy Uncertainty Index by Iacoviello et al. has now started to pull back from April highs.
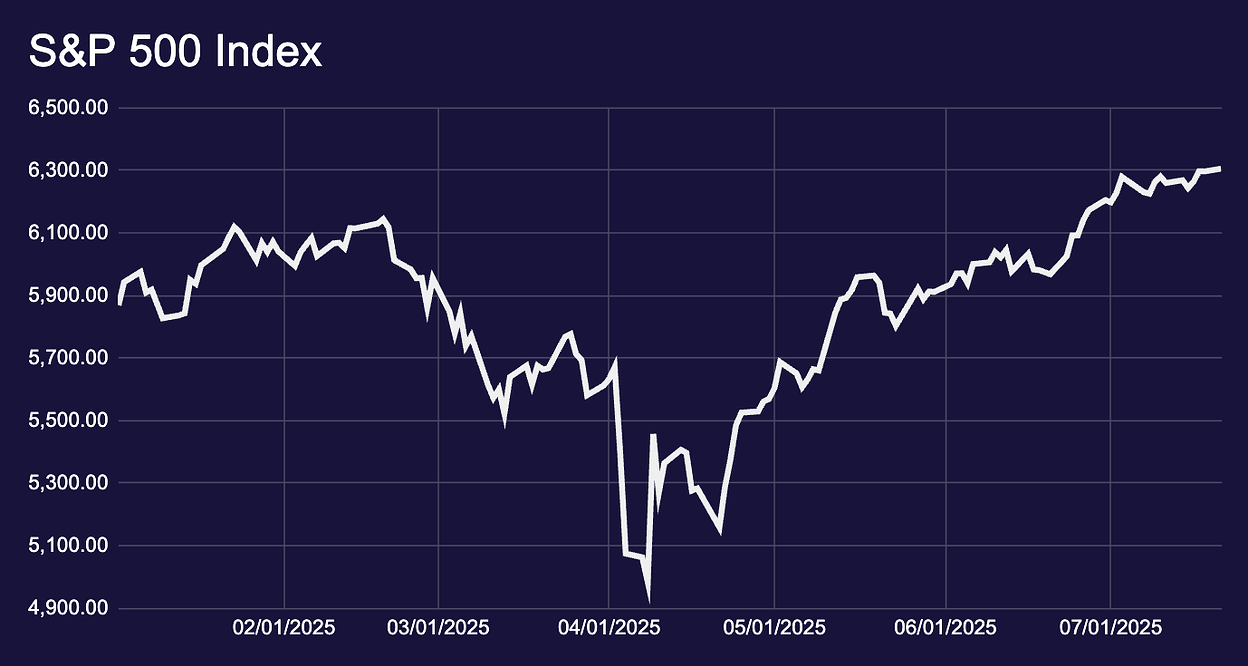
While a number of questions remain about tariff burdens, such as who will ultimately shoulder the cost of tariffs, how US companies will be affected longer term, and the longer term inflation outlook, market sentiment has turned decisively positive, perhaps in part because the Trump administration is getting a number of trade deals across the finish line, including with Japan, Indonesia, Philippines, and potentially the EU in sight. This is reflected in the swift v-shaped recovery in the S&P 500 since April lows, now back at all-time highs.
US Fiscal Policy
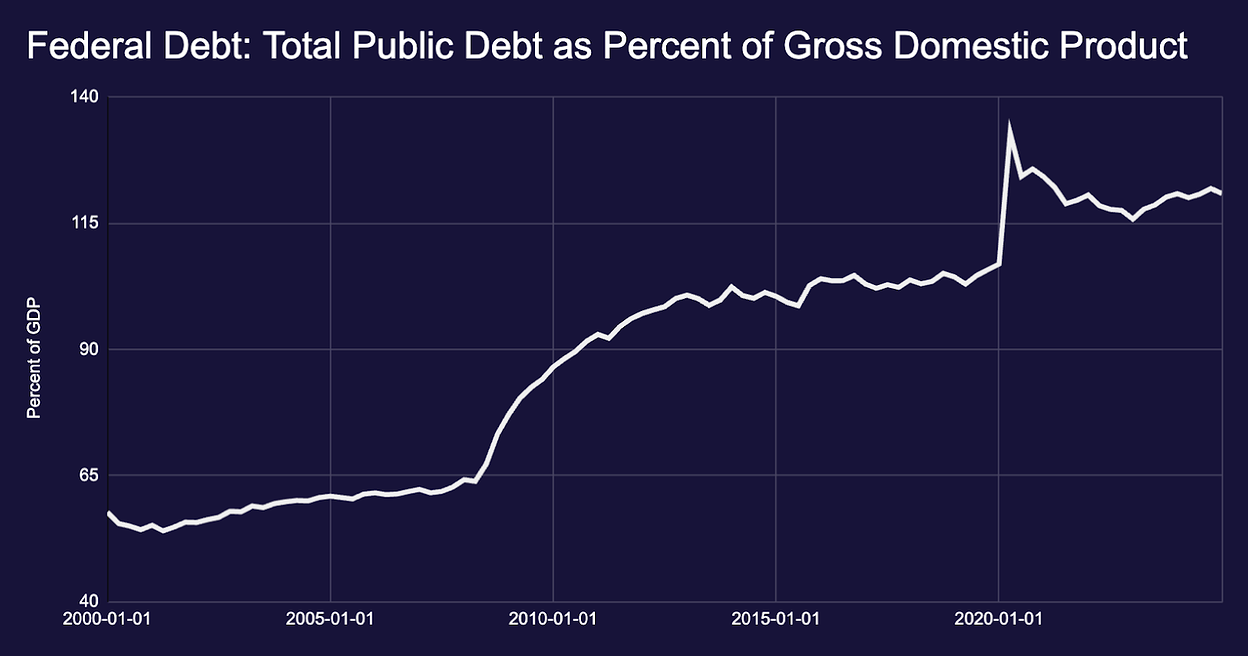
On the back of the Trump Administration’s “One Big Beautiful Bill Act” being signed into law, US fiscal concerns surged, sustaining elevated yields of long-dated bonds. Some concerns stem from the US debt-to-GDP ratio remaining at its historically highest levels outside of a crisis period, where the new bill would further add to the deficit. Meanwhile, debt servicing costs are at record highs.
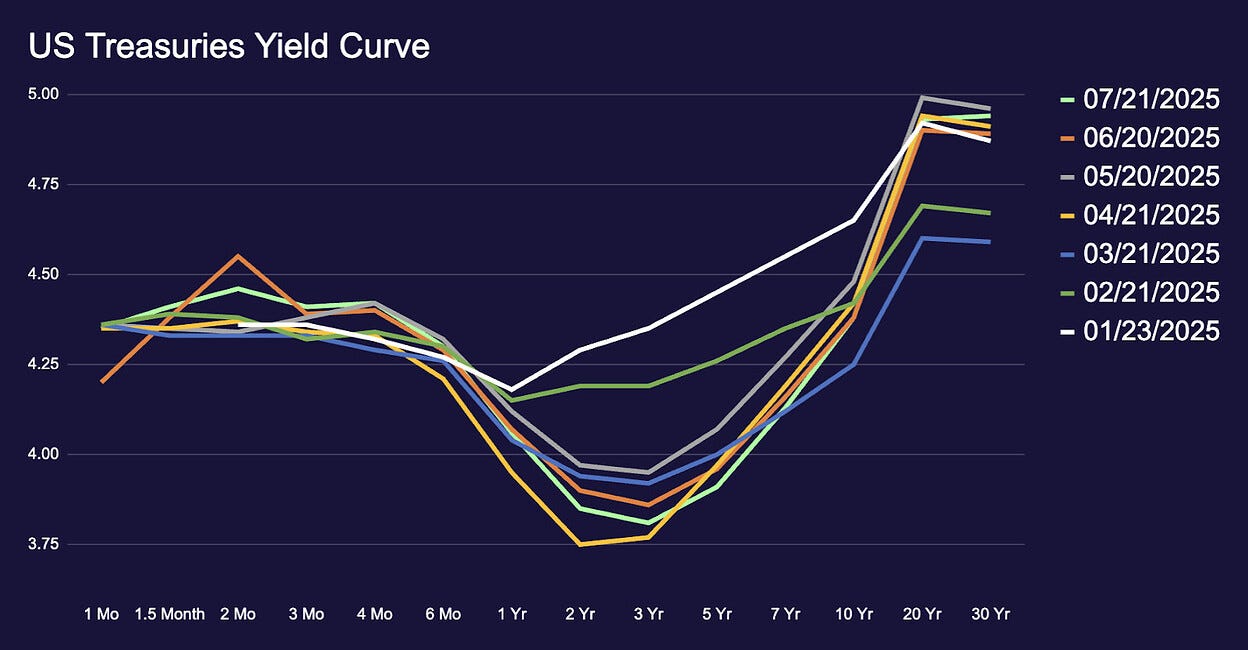
In recent interviews, Treasury Secretary Scott Bessent has acknowledged concerns over spending and the nation’s elevated deficit-to-GPD. He emphasized the administration’s goal of reducing the debt-to-GDP by focusing on economic growth that should ultimately outpace the rise in federal deficits. He reiterated that the effort will rely on the “three-legged stool” fiscal strategy: public-sector deleveraging, renewed private sector leveraging, and tariff revenues (learn more about the three-legged stool fiscal strategy in Market Overview: February - March 2025).
US Monetary Policy
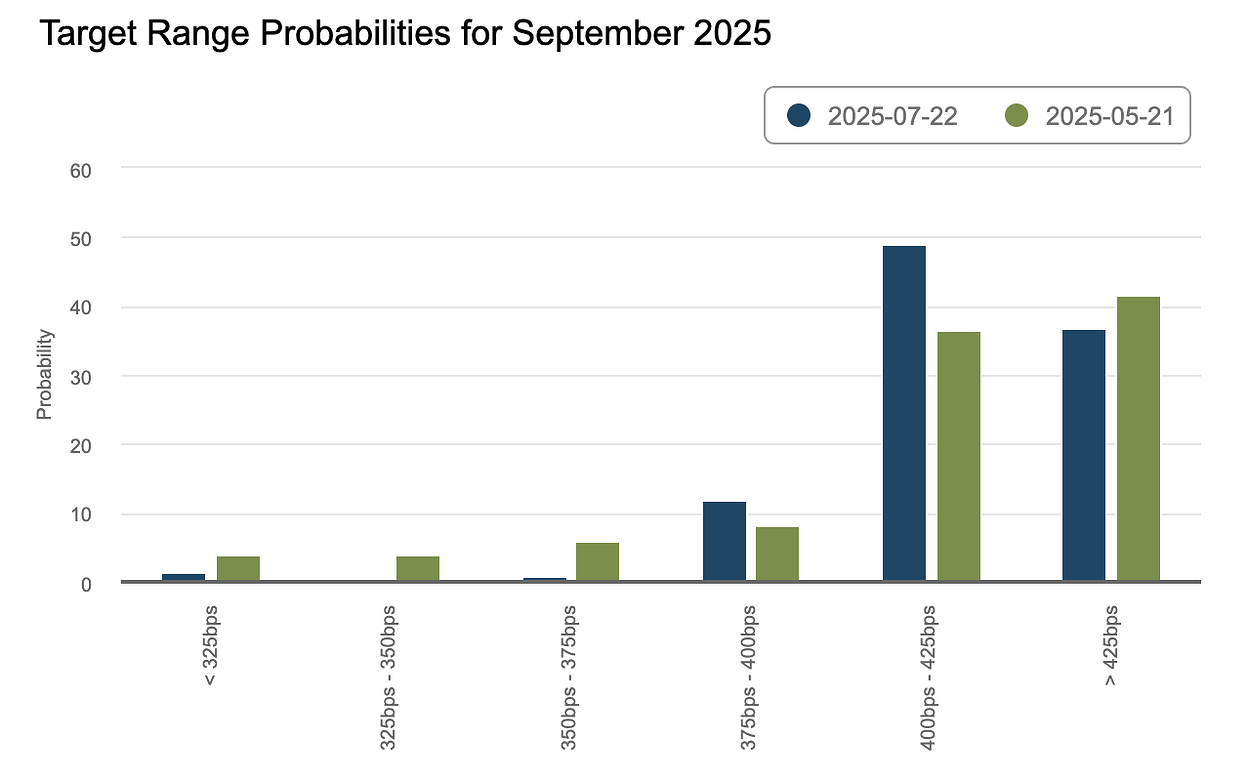
In the June Fed meeting, the FOMC decided to hold the target range for the federal funds rate steady at 4.25% - 4.50% for a fourth straight meeting. Speaking on July 1 at the ECB’s Sintra Forum, Fed Chair Powell explained that the committee paused further rate cuts after they saw the size of the tariffs and when all inflation forecasts for the US went up materially as a consequence of the tariffs. Nevertheless, he also noted that a solid majority of the FOMC participants expect it will be appropriate to resume easing later this year.
Crypto Market Conditions
Stablecoin Summer
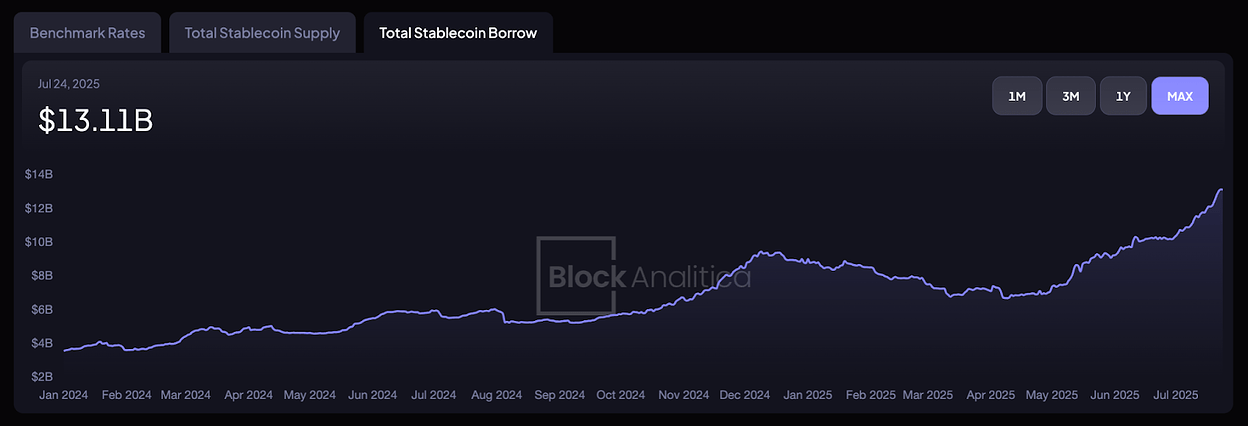
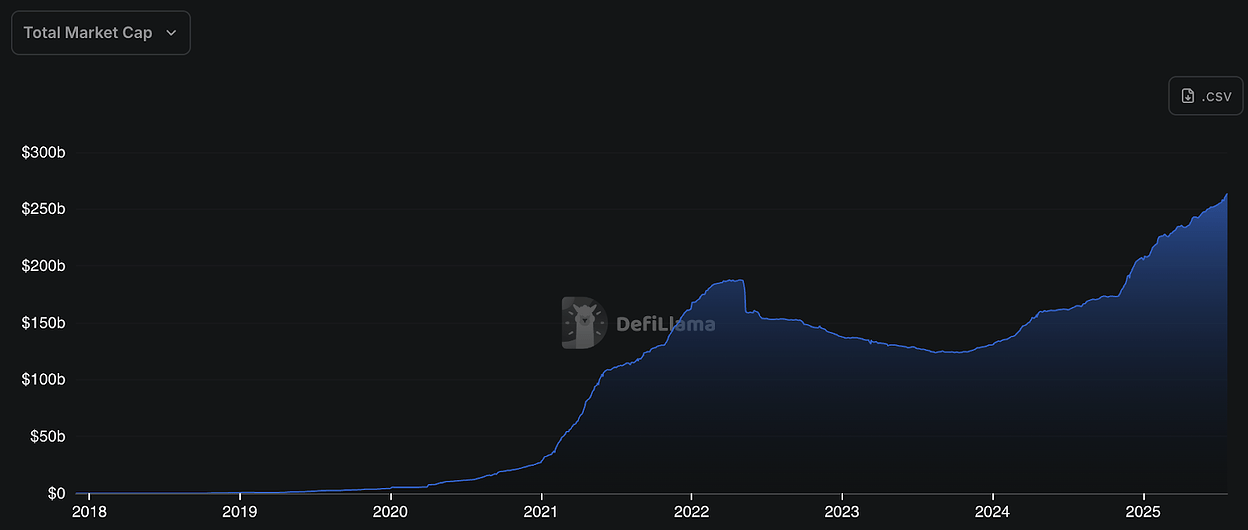
Anticipation of the GENIUS Act has increased interest in stablecoins across both tradfi and crypto. Signs of that momentum included strong demand for Circle’s IPO, Stripe’s acquisition of Privy, J.P.Morgan’s Kinexys platform launching JPDM on Base, and Coinbase’s plan to bring USDC as collateral for US futures markets. Onchain stablecoin activity has accelerated as well: Sphere’s “Total Stablecoin Borrow” metric has reached a record high of $13.11 billion, while DeFiLlama shows the total stablecoin market cap setting new highs on almost a daily basis, currently at $263.86 billion.
Ethereum Gas Limit Scaling
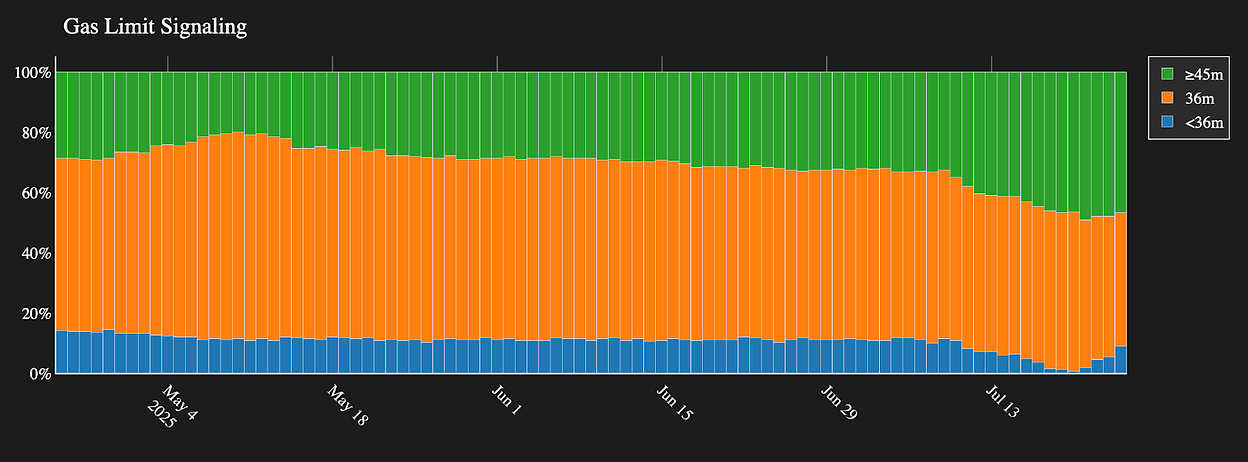
As first noted in our last market overview, an effort to increase the Ethereum Mainnet gas limit is currently underway. While the plan is to go further in the future, core developers initially signalled that a 45 million gas limit is safe for the L1. On July 21, the first 45m gas limit block was proposed on Mainnet. This rapid adjustment is encouraging: the L1 gas limit remained fixed at 30m for more than three years, whereas the incremental rise to 36m lasted only about five months.
Crypto ETFs
Recent months have seen a notable surge in demand for crypto ETFs. Regardless of whether this activity reflects long exposure, basis trades, or other strategies, this momentum serves as a good proxy for increased institutional adoption.
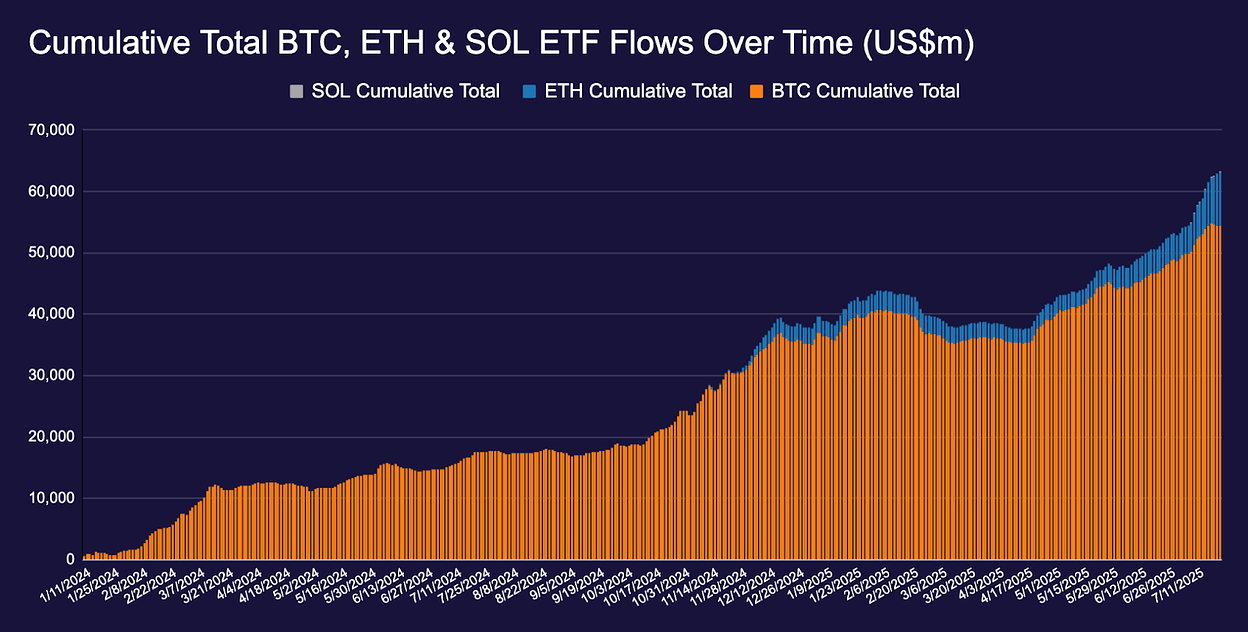
Since launch roughly 18 months ago, Spot Bitcoin ETFs have amassed more than $54.4 billion in net inflows, with roughly $10 billion of net flows recorded since 1 June, 2025.
As a group, US spot ETH ETFs have taken in over $8.7 billion since launch about 12 months ago, $5.5 billion of which (77.8% of total net flows) since June 1, 2025.
It is also worth noting BlackRock’s amended filing for the iShares Ethereum Trust, which if approved, would allow the fund to stake its ETH holdings. Several other ETH staking ETF applications are already in the books, with final decisions on the earliest filings due in October. BlockRock’s submission, however, will not reach its own final deadline until roughly April 2026, according to Bloomberg analysts. They nonetheless anticipate that staking approval could arrive as early as Q4 2025.
On July 2, 2025, the first US spot SOL staking ETF went live (REX-Osprey SOL + Staking ETF - ticker SSK). So far, the product has seen $105.4 million of net flows.
Benchmark Rates
With market sentiment improving, the Sphere Funding Benchmark has jumped to roughly 11.67%, a sharp increase over the past few weeks.
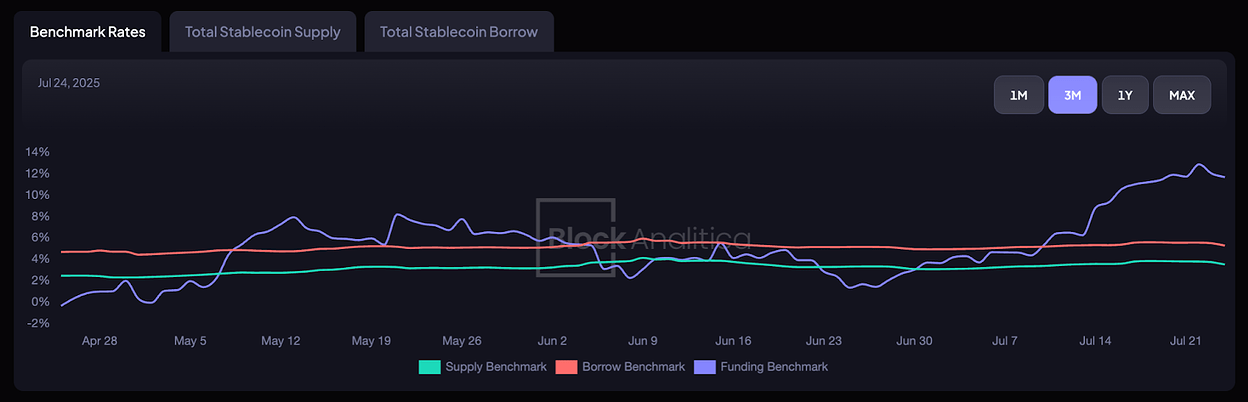
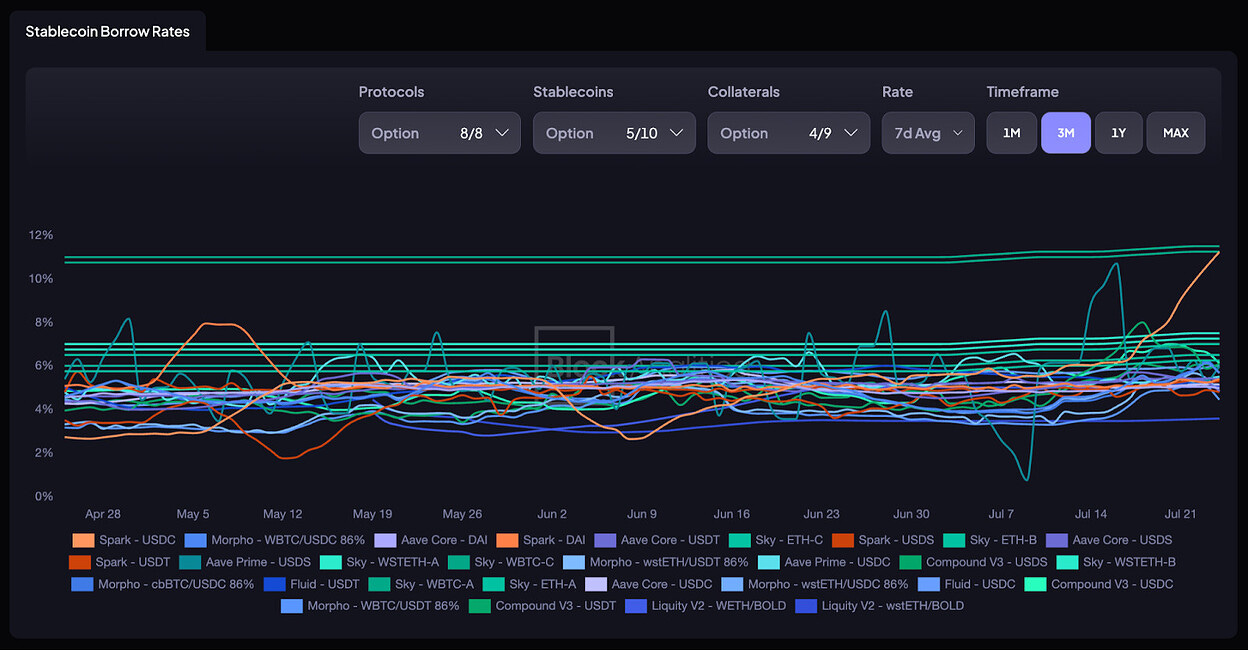
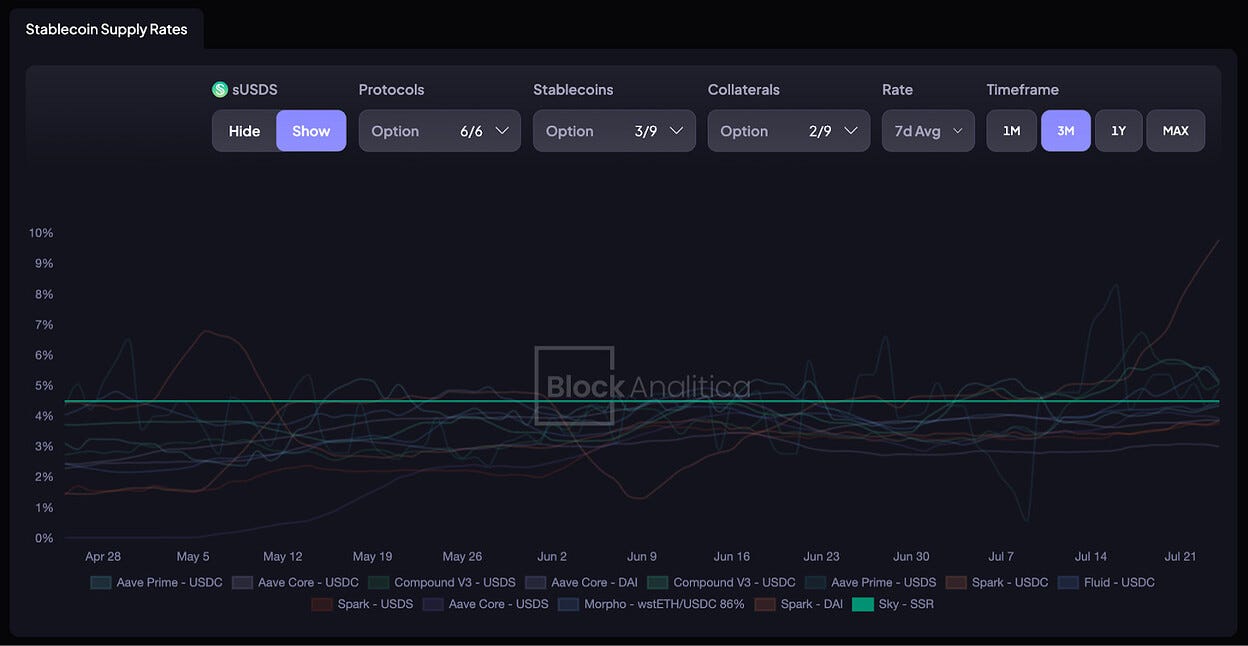
Throughout June and July, a number of notable rate trends emerged. On June 10 we noted that total stablecoin borrowing had begun accelerating sharply, setting new all-time highs almost daily, even as the Sphere funding benchmark hovered near 4%. By July 16, funding rates had begun to climb as stablecoin supply and borrow continued to expand. Yet, Sphere’s supply and borrow rate benchmarks remained largely unchanged. Because DeFi lending rates tend to lag funding costs, sustained elevated funding rates will likely push onchain lending rates higher as well.
Sky Ecosystem
Stablecoin Supply & Collateral Exposures
Since our last update, two additional networks have been added to the Sky Ecosystem via the Spark Liquidity Layer: OP Mainnet and Unichain. A summary of USDS supply across supported networks is shown in the chart below.
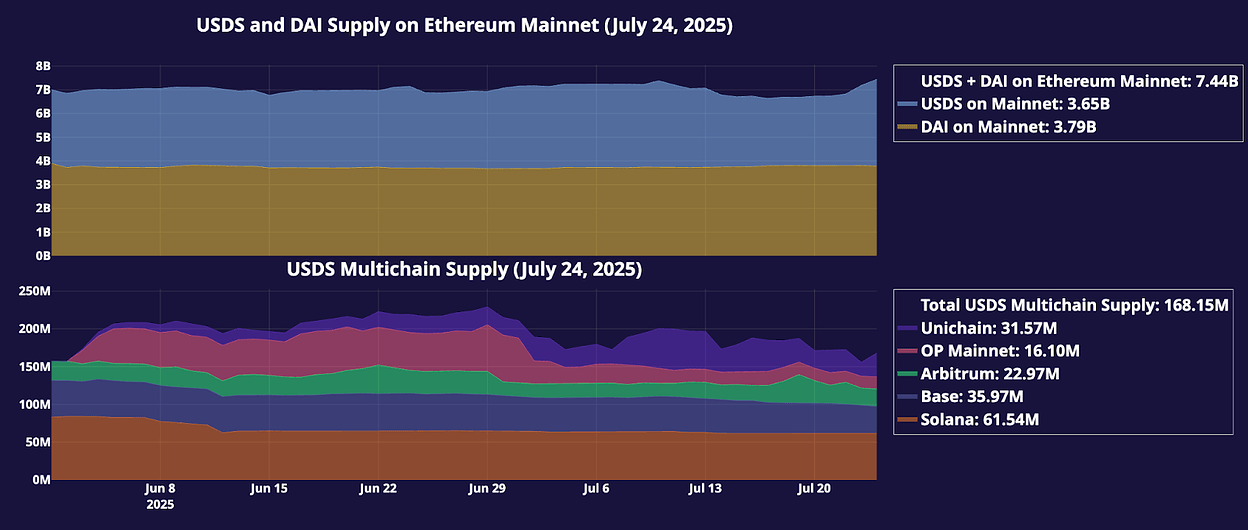
Total DAI & USDS supply has increased by approximately 440M since June 1.
Seal Engine debt is now 0, replaced by the Staking Engine.
Core Vault exposure has increased slightly despite recent stability fee increases (1, 2). Most likely as a result of the recent bullish BTC and ETH price developments.
Stablecoin exposure has contracted somewhat as a result of the external market environment heating up and more exposure consolidated into Spark. Nevertheless, the Actively Stabilizing Collateral (ASC) ratio remains at a healthy 31.17%.
Spark
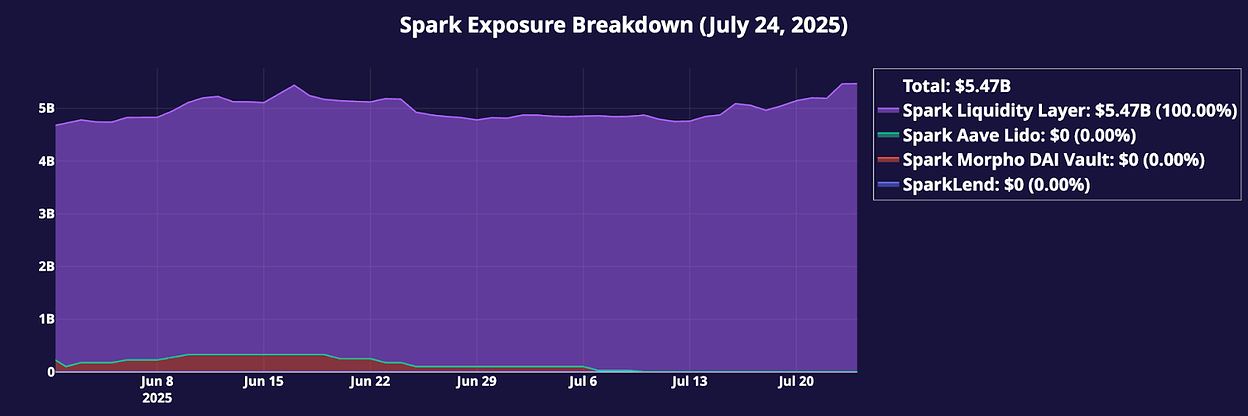
All direct deposit modules (D3Ms) associated with Spark have been fully unwound, leaving all remaining Spark exposure consolidated in the Spark Liquidity Layer (SLL).
Spark Liquidity Layer
Current Spark Liquidity Layer (SLL) allocations are summarized below.
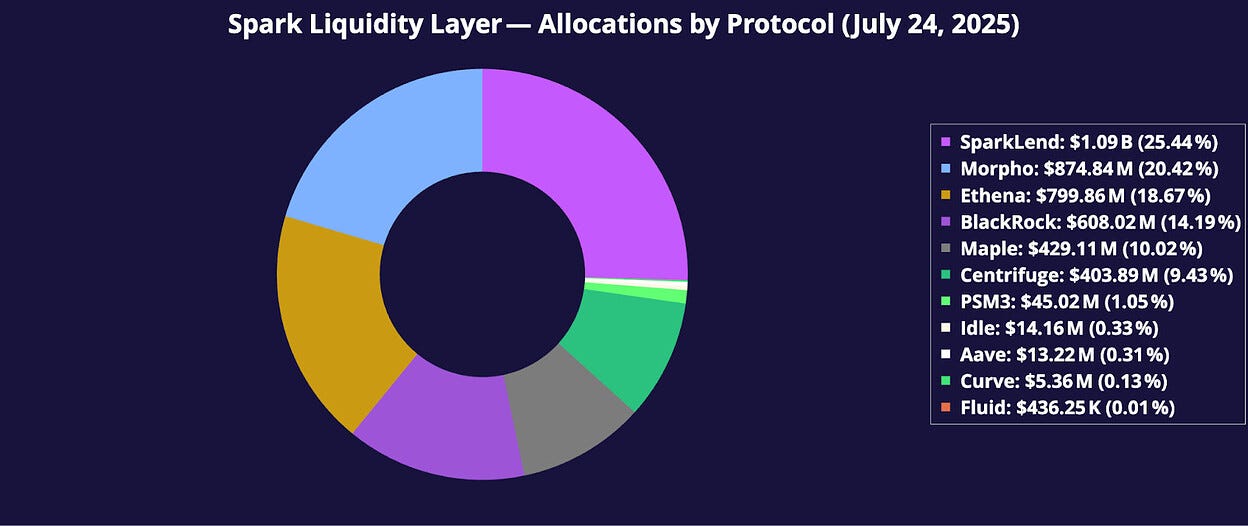
SparkLend: Previous D3M allocations to SparkLend, Morpho Spark DAI Vault, and Aave Prime have been replaced by the SLL. As such, roughly 25.44% of SLL allocations are currently allocated to SparkLend via Spark USDS, Spark DAI, Spark USDT, and Spark USDC.
BlackRock and Centrifuge: Today, Spark Tokenization Grand Prix RWA strategies represent roughly 23.62% of all SLL allocations ($1.01B). On July 10, Grove, the newest Sky Star focusing on integrating RWAs in DeFi, published a new proposal Tokenized T-Bills Transfer from Spark to Grove. The proposal will transfer BUIDL and JTRSY to Grove, helping streamline the oversight of these assets, leveraging Grove’s expertise in RWAs. It should be noted, however, that Spark will retain the flexibility to acquire additional tokenized t-bills at their discretion.
Morpho: The SLL allocates roughly $874.84M to Morpho. $273.02M is allocated to the Morpho Spark DAI Vault on Ethereum Mainnet, replacing the function of the now unwinded DIRECT-SPARK-MORPHO-DAI direct deposit module. The remaining assets are allocated to the Morpho Spark USDC Vault on Base.
Ethena: Spark currently allocates $799.86M to Ethena, evenly split between $399.92M in USDe and $399.94M in sUSDe.
Maple: Spark allocates USDC to syrupUSDC, a tokenized representation of investment into offchain collateralized loans organized via the Maple Finance platform.
Other: Other active strategies include Aave (Aave Prime and Aave Base USDC) and Curve (sUSDSUSDT).
To learn more about the Spark Liquidity Layer, visit the Spark Data Hub.
Savings Rates
Savings utilization has decreased in recent weeks. In our last update, total supply (SSR+DSR) hovered around $3.25B (46.31% utilization), which has now come down to $2.43B (32.69% utilization).
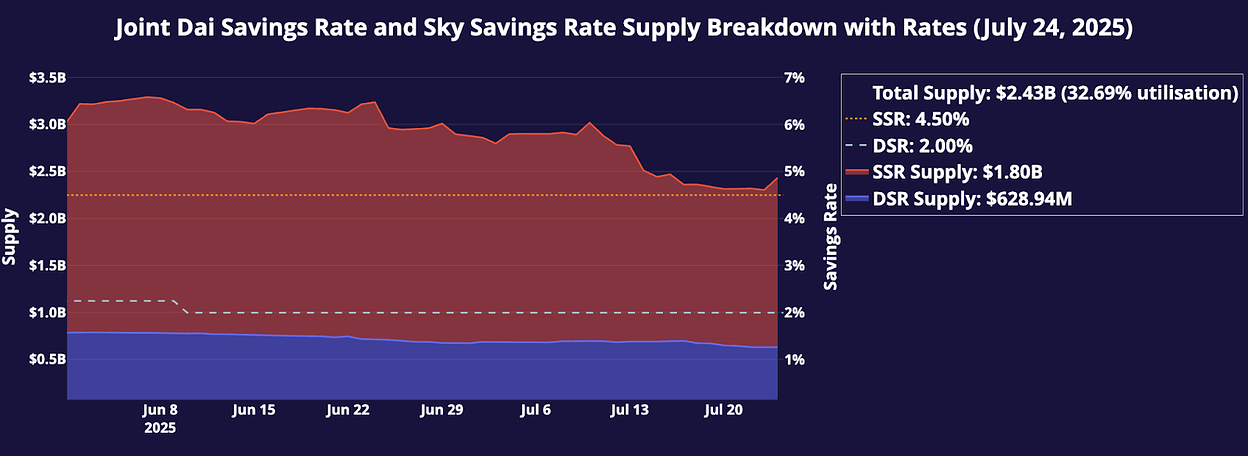
Since June 1, about 154.88M of the overall decline came from DSR withdrawals, likely in part due to the DSR being lowered from 2.25% to 2% over the same period. The DSR has been reduced in order to comply with section A.3.2.2.4.1 - Dai Savings Rate Modification in the Atlas, which states that the DSR must gradually be reduced to 0% over time. BA Labs, advising the Stability Facilitator on SP‑BEAM updates, has proposed reductions in small increments, tracking user behaviour after each change. We have proposed a number of pauses to avoid sudden unwinds that could potentially lead to bad user experience.
The SSR has remained at 4.5%. This rate remains competitive compared to other lending venues. However, funding rates on perp exchanges have been climbing. At the time of writing, Ethena is reporting a sUSDe APY of 12%. If these elevated rates persist, the cost of capital on other lending venues will likely rise as well.
Revenue
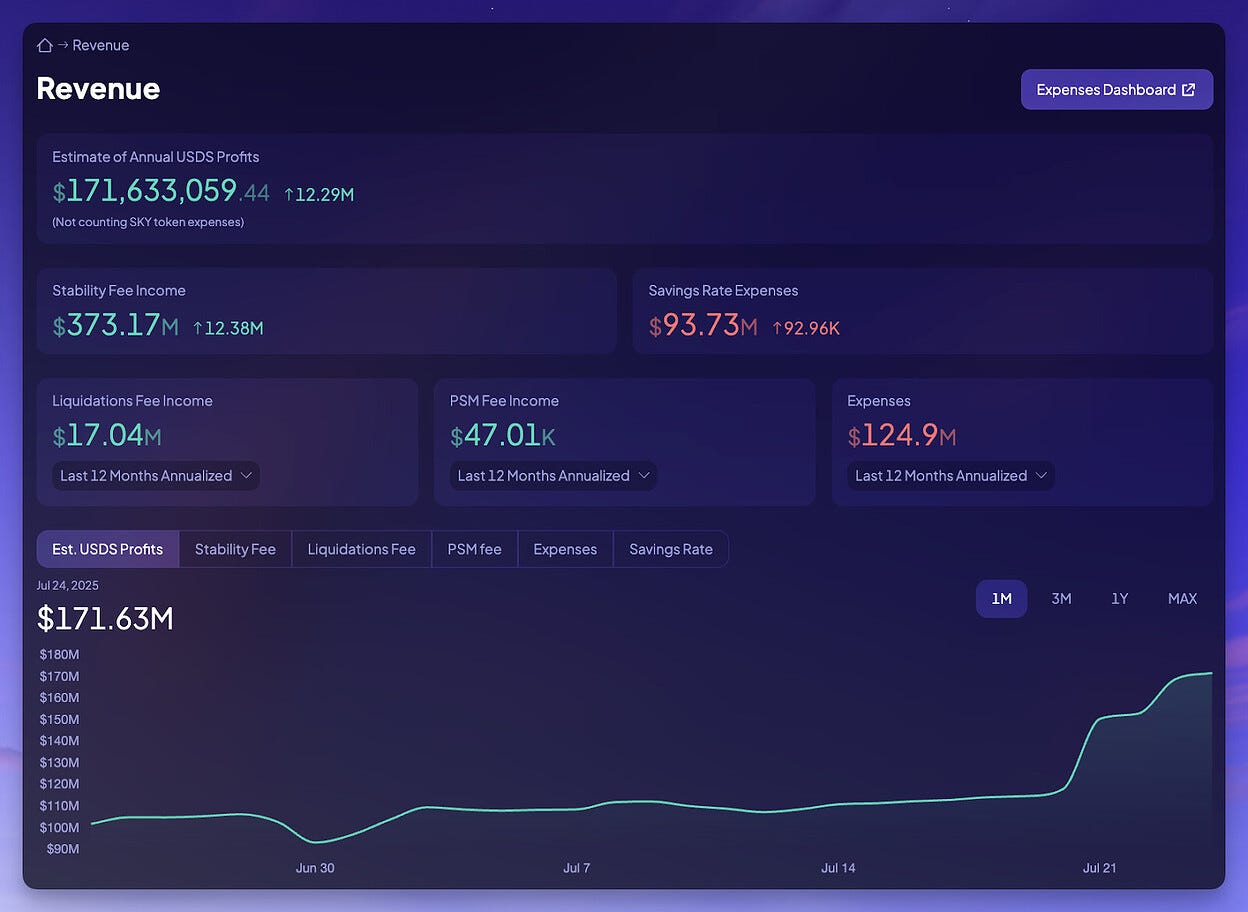
Sky’s estimated annual USDS profits have steadily increased throughout June and July. The main drivers are higher stability fee income from Core Vaults, higher stability fee income from Spark, as well as lower savings rate expenses due to recent unwinds.
Treasury
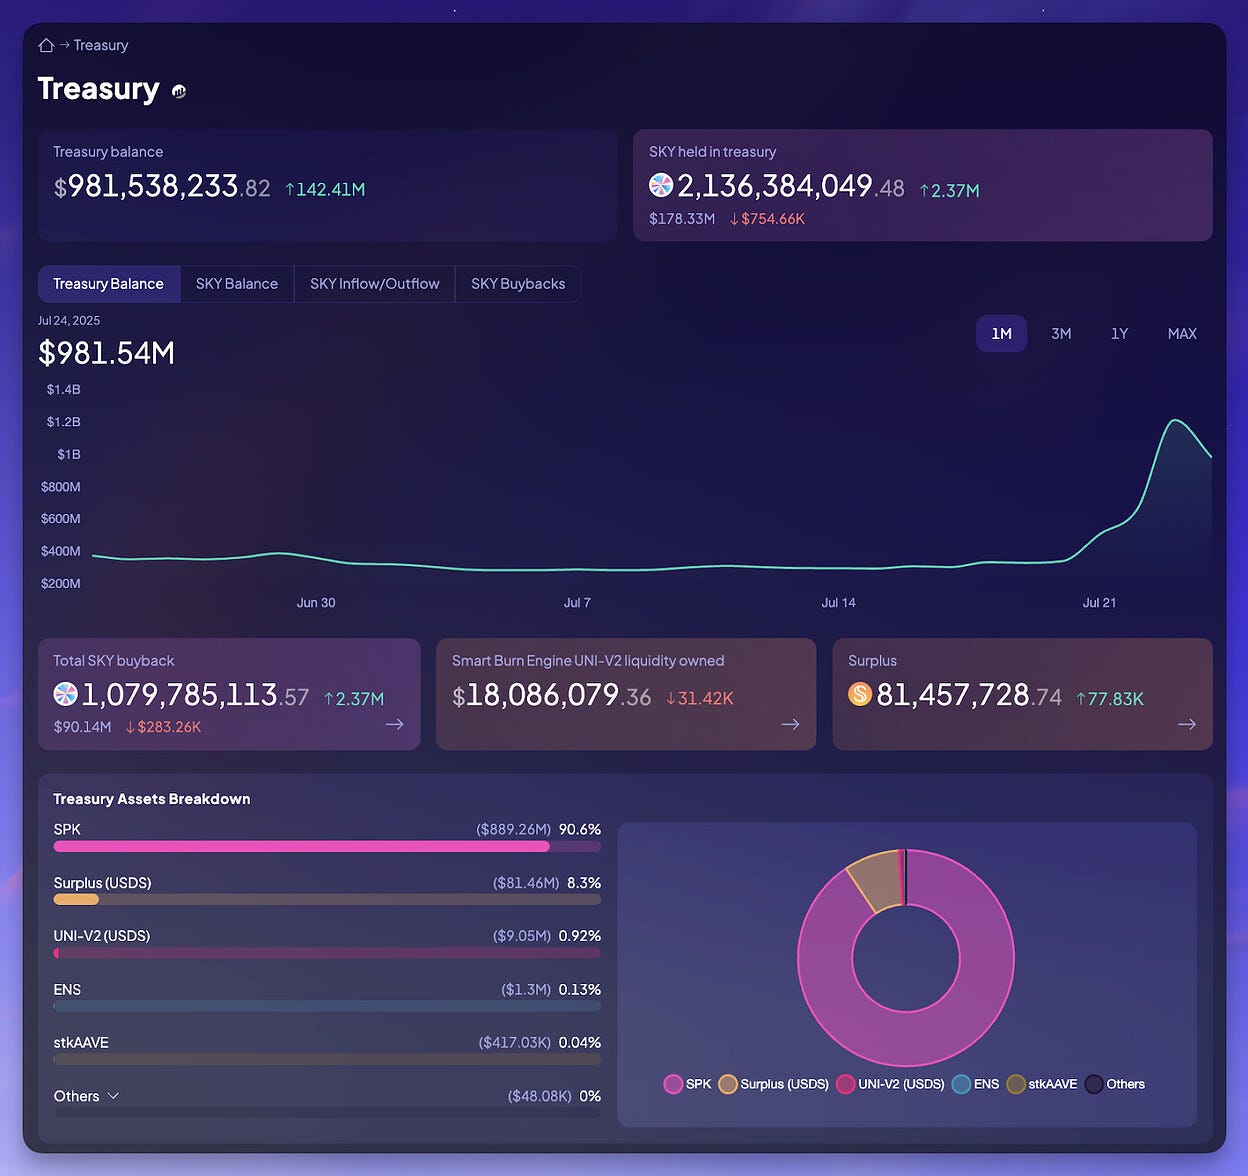
Sky has been buying back tokens steadily since the reactivation of the Smart Burn Engine on February 24, 2025. Total SKY buyback now stands at 1.08 billion (roughly $90.14 million at the time of writing). Sky’s buyback activity can be tracked in detail using the Treasury page on the Sky Risk & Analytics Dashboard.
It is also worth noting that with the launch and subsequent price increase of SPK, the Sky treasury has increased considerably in size, now standing at $981.54 million.
Reference Parameters
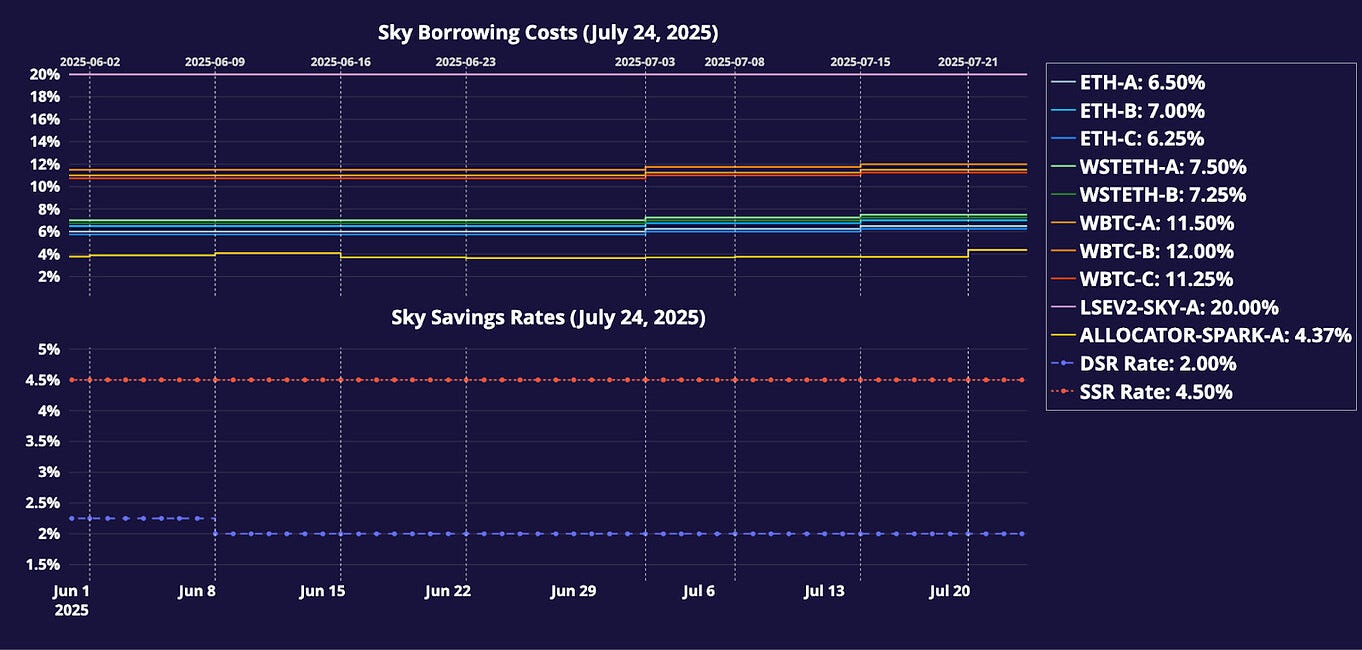
Since the beginning of June, stability parameters have been adjusted on eight occasions using the SP-BEAM.
The stability fee of ALLOCATOR-SPARK-A has been regularly adjusted in order to reflect revenue accumulation and to offset the sUSDS and sDAI idle liquidity effect on the Surplus Buffer.
Sky Core Vault stability fees have been increased by 50 bps across the board in order to comply with section A.3.8.1.1.2.3 - Stability Fee in the Atlas, stating that stability fees must be gradually increased over time to incentivize users to migrate to SparkLend and other borrowing platforms offered by Star Agents.
The DSR has been decreased by 25 bps in order to comply with section A.3.2.2.4.1 - Dai Savings Rate Modification in the Atlas, which states that the DSR must gradually be reduced to 0% over time.
Thanks for reading Block Analitica Research! Subscribe to receive new posts.
Comments
Nothing yet. Say the first thing.
Sign in to join the conversation.