
Revenue Starts the Show… But Spending Determines the Ending
The basic premise of balance sheet success for most independent retail operations is the same… Tally your costs for goods that are sold (COGS), add up the sum of your operating expenses (OPEX) – and optimize the revenue remaining (if any) after those totals are paid. It’s that simple.
And it’s that hard.
Sure, we can add sophistication with accounting methodologies. And we can finesse seasonal considerations through payment terms and procurement routines. But we must, ultimately, ensure our revenue outpaces the fierce financial bedfellows of COGS and OPEX.
In a recent meeting, I was reminded that we may have key Team Members or partners who are unaware of such sensibilities. And I do not mean this unfairly or ugly. We, simply, get to the business of service… and we forget about the overall impact these pesky operational expenses have on the enterprise. Moreover, there are many job descriptions within a retailer or restaurant that have no intimate knowledge of margins or costs. “Front-of-House” is a known expression because it so keenly connotes the lack of connection with the “back-office.”
For today, however, let’s remove infrastructural boundaries and consider whether all of the decision-makers on our Team know how to make our business model work. To help do so, we will use “Revenue Ratios,” as they so visibly impact our paramount pursuit of profitability. The term itself is exactly as it sounds, as it identifies an expense that occupies a specific or planned percentage of total revenue. If my “Payroll-to-Revenue Ratio” is .20:1 (or 20.0%), either statistic will illuminate the amount of the other. Said differently, if my annual revenues are $100MM, we also know payroll is $20 million (20/100). However, if I spend $24 million on payroll, I know my Revenue Ratio for this expense is no longer .20 or that I am planning to generate $120MM in revenue.
It’s no different for leasing, marketing, employee benefits, charitable donations and everything else. And for most businesses, there is lots of “everything else!” But whether the roster of expenses is long or short, make no mistake: each of these expenses absorbs a percentage of total revenue - - and there is only so much revenue to absorb. Where is the absorption happening the most? Or most surprisingly? Or altogether unexpectedly? Group these expenses for the sake of efficiency, if you like. Or use the same classifications you use on your P&L, if preferred. But harness them all to determine the profitability of your business and firmly grasp its direction and sustainability.
Let the Fireworks Begin!

To more fully set up a forthcoming example, I will state the potentially obvious: our Revenue Ratios cannot cumulatively exceed 1:1. Not for long, anyway. Equally apparent, perhaps, the smaller the numbers preceding the colon (:) in Revenue Ratios, the higher the probability that there will be some net profit to celebrate.
Together Forever: Gross Margin and Cost-of-Goods Sold 💕
As financial evaluations normally suggest, let’s start with the hungriest line items. In most retail-related companies, these are COGS, Payroll and Occupancy (in that order). As the first and most formidable, COGS travels with a trusty sidekick: Gross Margin. MBA students notwithstanding, the inextricable link between gross margin and cost-of-goods sold is not universally considered. And so that none may be left behind, here’s the headline: On the other side of your gross margin percentage is a COGS percentage that will bring the total of both elements to 1.0. As an example, if I sell a 20-pack of sparklers from my roadside fireworks stand for $2.00 – and I paid $1.00 for this same package to the firecracker wholesaler in Alabama (isn’t that where all fireworks’ wholesalers are located?) – my Gross Margin is 50%. Because of the inverse relationship with Gross Margin, this makes my COGS the same. If, as an alternative to round numbers, the wholesale cost for the package of sparklers was $.85 (and my sale price was still $2.00), my Gross Margin becomes 57.5, while my COGS are 42.5 (or .425). Again, the elements of Gross Margin and COGS will always combine to equal 1.0. As gross margin percentages climb, so must the percentages associated with COGS fall - - and vice versa.
As a worthwhile footnote, there will always be debates on which accompanying costs should be included in the final COGS figure (shipping, tariffs, handling fees, finance charges, etc.). Let the debate rage and differences from retailer-to-retailer persist. What matters most is that these ancillary (and sometimes overlooked) costs are captured. Somewhere. Anywhere. To again reference my primary business, we do NOT include shipping costs in our COGS or Gross Margin. Instead, we have a separate “Inbound Shipping” line item. In addition to enabling an independent Revenue Ratio, this approach makes it easier for us to spot changes or see trends in this volatile line item. Again, this is my example; it is not my recommendation for everyone.
You’re All But Done at 1:1
Whether as an individual item for resale or across every offering for a specified period of time, attentiveness to gross margin is a great start… BUT it is only the beginning. To steward a scalable (even sustainable) enterprise, we must also have the operating expenses – or be able to accurately forecast the percentages of revenue these expenses will consume.
To further depict the importance, let’s return to my roadside retail efforts. As a ratio, the COGS-to-Revenue where we left off was .425 to 1. After all, my accounts payable for the product sold will require payment of 42 and a half cents of every $1.00 made.
Let’s further assume that Payroll is a commission of 25% of sales (Mom and Dad don’t work cheap!), while leased space in our neighbor’s lawn is 10% of the total haul. We also have a standing commitment to put 30% of sales into a July Fourth block party for the kids (T&E!) and participate in One Percent For The Planet to offset the adverse effects of our product sales on the environment.
With this more complete insight, how do you believe my pyrotechnic emporium will fare?
If you said anything but “very poorly,” you are trying too hard not to hurt my feelings. At the same time, please complete the basic arithmetic to ensure comprehension: .425 (COGS) + .250 (Payroll) + .10 (real estate) + .30 (T&E) + .01 (charity) = 1.085.
You already know that 1.00 would be breaking even. As such, and in this scenario, we are currently losing 8.5 pennies with every dollar earned.
As such, we must go to work on expense management or margin enhancement. Or both. Of course, increasing revenue will also unlock important improvements in those Revenue Ratios that are variable… My Utilities-To-Revenue ratio fluctuates with revenue swings, as the cost for air conditioning is mostly the same, regardless of whether we serve fewer guests than ever before or enjoy an all-time sales record. On the other hand, my payroll expense is more static, as the amount may rise or fall congruently with any increases or decreases in sales volume, keeping the To-Revenue-Ratio largely fixed.
Lighting a Fuse at the Fireworks Firm
Now back to our failing venture… I’ve called Mom and Dad to let them know we’ve changed their commission to 15%; I’ve also told my landlord-neighbor that I’ll pay the Ten Percent of Sales, but not starting at the first dollar. Instead, I’ll begin to do so after we eclipse $2k in sales. Lastly, I’ve capped the block party slush fund at the same percent as Mom and Dad’s commission and added a 5-cent increase to the price of sparklers.
Although these steps are not easy with my most endeared constituents, the potential of this business reappears. More specifically, the COGS are reduced to .421, while all other expenses now only absorb no more than another .41, combining for a total of .831 (instead of 1.085). Presuming $10,000 in sales, here are how the two (2) different scenarios present themselves:
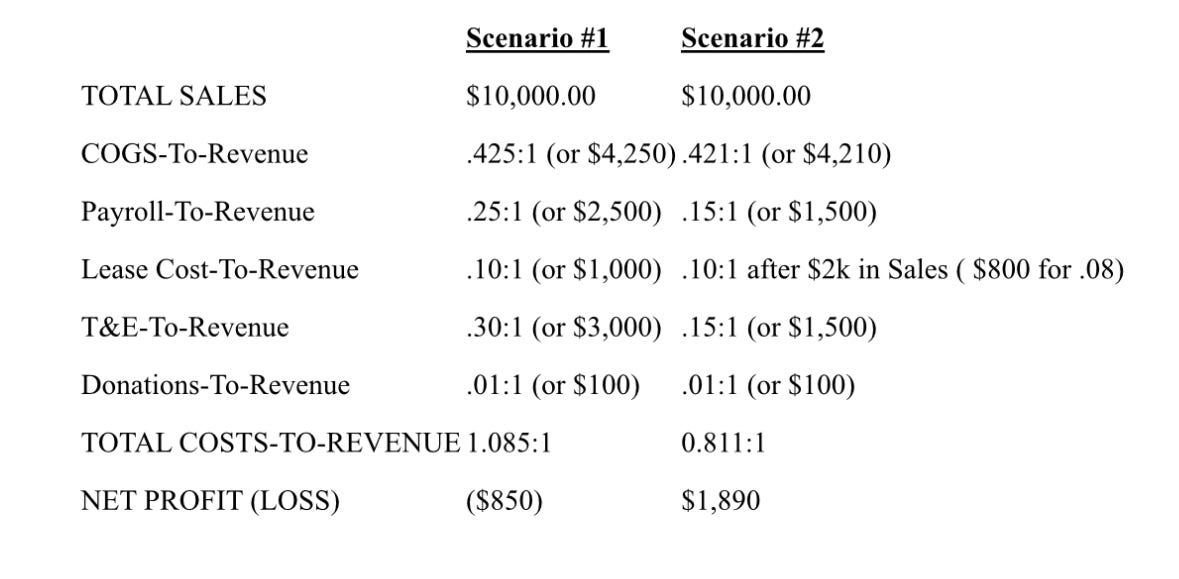
To know where and to what degree specific expenses are ingesting income is crucial awareness for the committed leader. Such insight is as helpful with strategic planning as it is in any financial review. And to be sure, the strong recommendation to know your Revenue Ratios is not encouragement to shrink each expense. Some line items are worth every cent and percent, while others may even be worth increasing. I’ll work landlords hard at every renewal, with the stated intent to put achieved savings on my lease rate into payroll. You can only spend each percentage point (or 1/10 th of a point!) of revenue once… Come to know your Revenue Ratios well so you can spend each percent of revenue even better!
Build it strong, y’all!
______________________________________________________________________
______________
To learn and consider other important retail industry metrics, including Open-to-Buy budgets, GMROI and inventory turn rates, you can purchase my book, It’s Not the Bricks, It’s the Mortar: Optimize Your Retail Business for Lasting Success https://itsthemortar.com/product/advance-copy/
July 2026
For easy access to past installments of The Monthly Mortar, please use this link (https://itsthemortar.com/monthly-mortar/).
No posts
Comments
Nothing yet. Say the first thing.
Sign in to join the conversation.