
Now that we’ve talked about finding the right time of day to trade, the next easy step is understanding Top-Down Analysis.
Don’t let the name confuse you, it’s just the practice of looking at the big picture before you zoom in on the smaller details. Think of it like using Google Maps, you zoom out to see what city you’re in before zooming in to find a specific house.
When you open up a chart for the first time, it’s super easy to get lost in all the little 1-minute or 5-minute candles. If you only look at a tiny slice of time, a quick jump in price can look like a huge rally, even if the stock is actually dropping like a stone on the bigger scale.
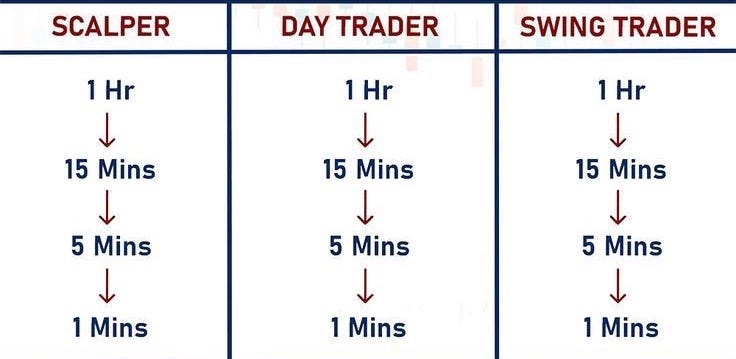
This is why traders look at multiple timeframes before making any decisions.
It’s as simple as checking three different views:
The High-Level View (Daily or 4-Hour Chart): This is your main compass. You look at this chart to see the overall trend. Is the price climbing up a mountain or sliding down a hill? You always want to trade in the same direction as this big trend.
The Story View (1-Hour Chart): This is where you look for key levels like strong floors, ceilings, or gaps where the price previously reacted. It gives context to the big picture.
The Detailed View (15-Minute or 5-Minute Chart): This is where you zoom in to look for your actual setup and find a clean entry.
If the daily chart shows the market is in a strong uptrend, you only want to look for buy setups on your smaller chart. Trading against the big picture is like swimming upstream, it takes a lot of effort for very little payoff.
Taking two minutes to zoom out first keeps you on the right side of the road.
The Homework: The Zoom Check
Step 1: The Big View
Open a chart and set the timeframe to Daily (1D). Is the overall price moving up, moving down, or just bouncing sideways?
Step 2: The Medium View
Switch the chart to 1-Hour (1H). Mark down the highest peak and the lowest valley you see on the screen.
Step 3: The Detailed View
Switch down to 15-Minute (15M). Notice how those big moves on the 1-hour chart are actually made up of lots of tiny candles.
Step 4: Post Your Map
In the comments, share your view: “On [$Ticker], the Daily chart trend is [Up / Down / Sideways], so on my 15-minute chart, I’m only looking for [Buy / Sell] opportunities.”
No posts
Comments
Nothing yet. Say the first thing.
Sign in to join the conversation.