
The market doesn’t need another bad headline to fall.
It only needs buyers to stop defending the same levels one more time.
Retail traders are still asking where to buy the dip. Meanwhile, corporate insiders—the executives and directors who understand their businesses better than anyone—are buying far less aggressively than normal.
At the same time, technology leadership is weakening, growth funds are losing money, oil is surging and some of the market’s biggest companies are about to report earnings.
That doesn’t guarantee a crash.
But it does tell me this is not the time to trade without a plan.
Friday’s selloff wasn’t caused by one broken stock.
The weakness spread across technology, semiconductors, communication services, financials and higher-beta consumer names.
NVDA fell 2.21%. META dropped 2.79%. GOOGL lost 2.17%. TSLA fell 2.61%. HOOD dropped 5.72%, while NFLX got crushed by more than 7%.
That is broad de-risking—not an isolated earnings reaction.
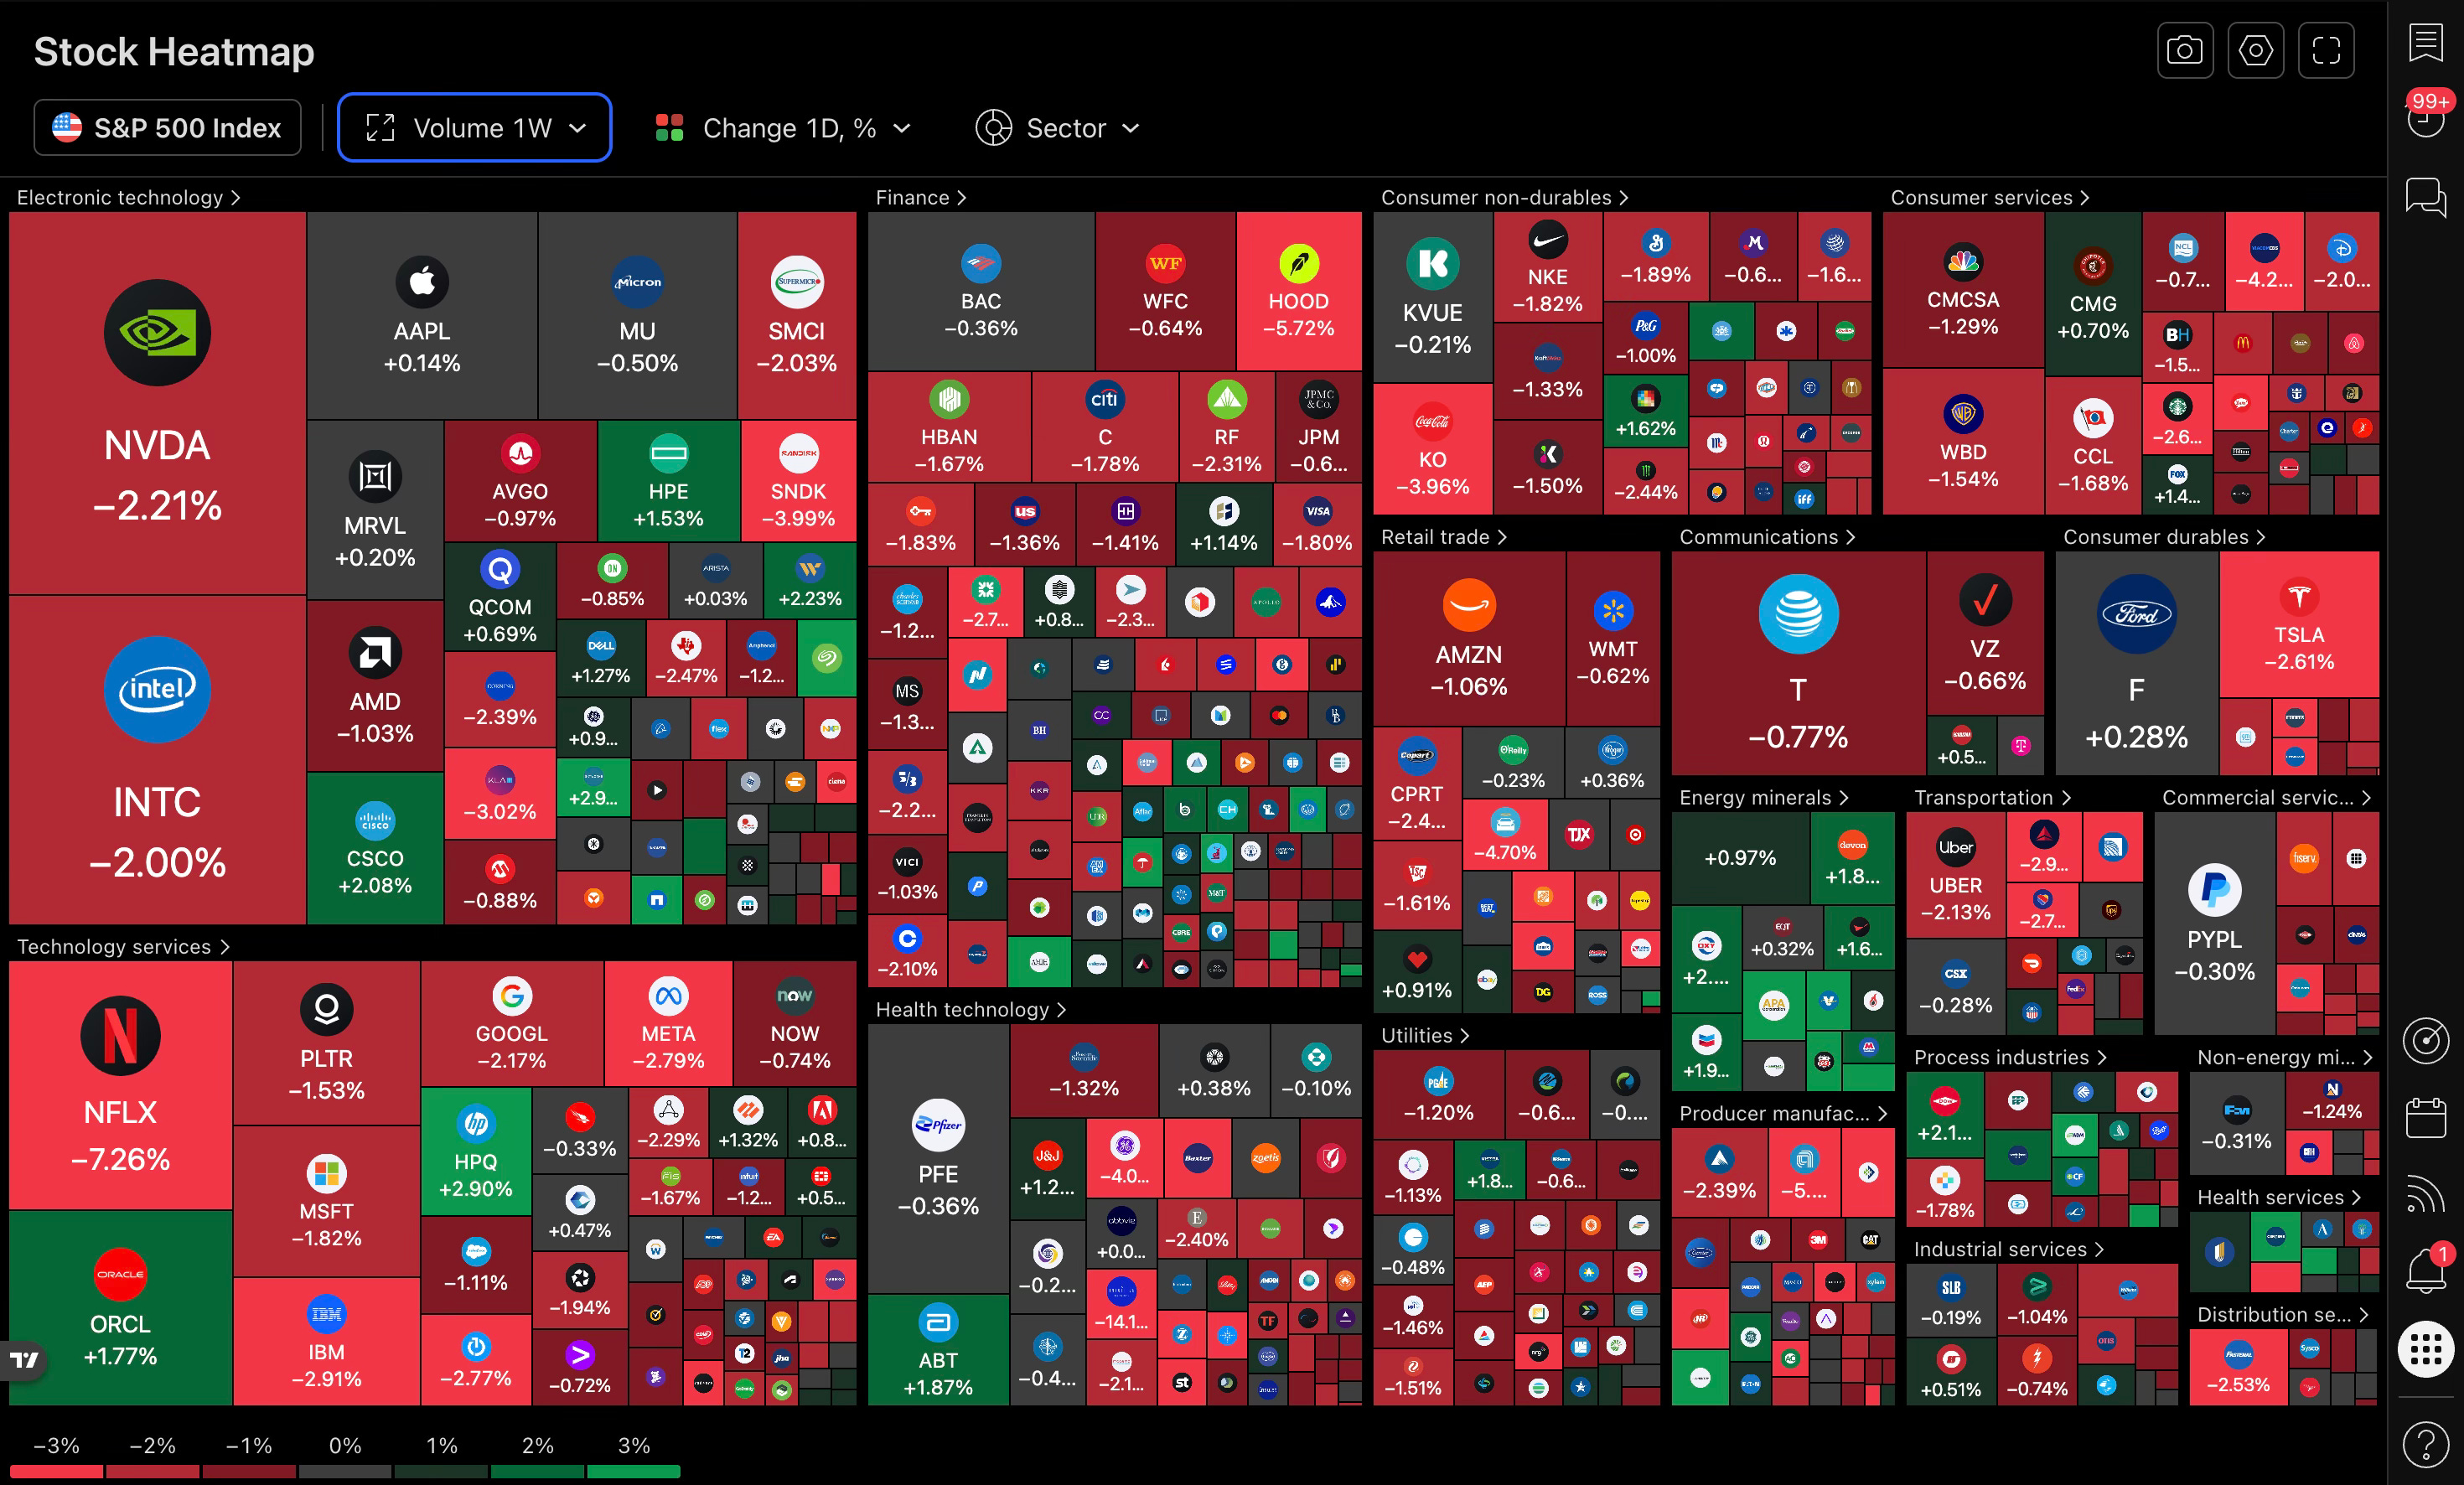
Friday’s heatmap shows selling concentrated in technology, communication services and higher-beta names.
The fund-flow data supports what we’re seeing on the screen.
Growth funds recorded approximately $7.18 billion in weekly outflows, while value funds attracted about $3 billion. The semiconductor index also lost roughly 8.5% for the week.
The same crowded technology stocks that carried the indexes higher are now being sold together.
That matters.
Corporate insiders don’t always sell because they expect their stock to fall.
They sell for taxes, diversification, estate planning, option exercises and scheduled Rule 10b5-1 trading plans.
So one executive selling shares means very little by itself.
But widespread selling combined with weak buying is different.
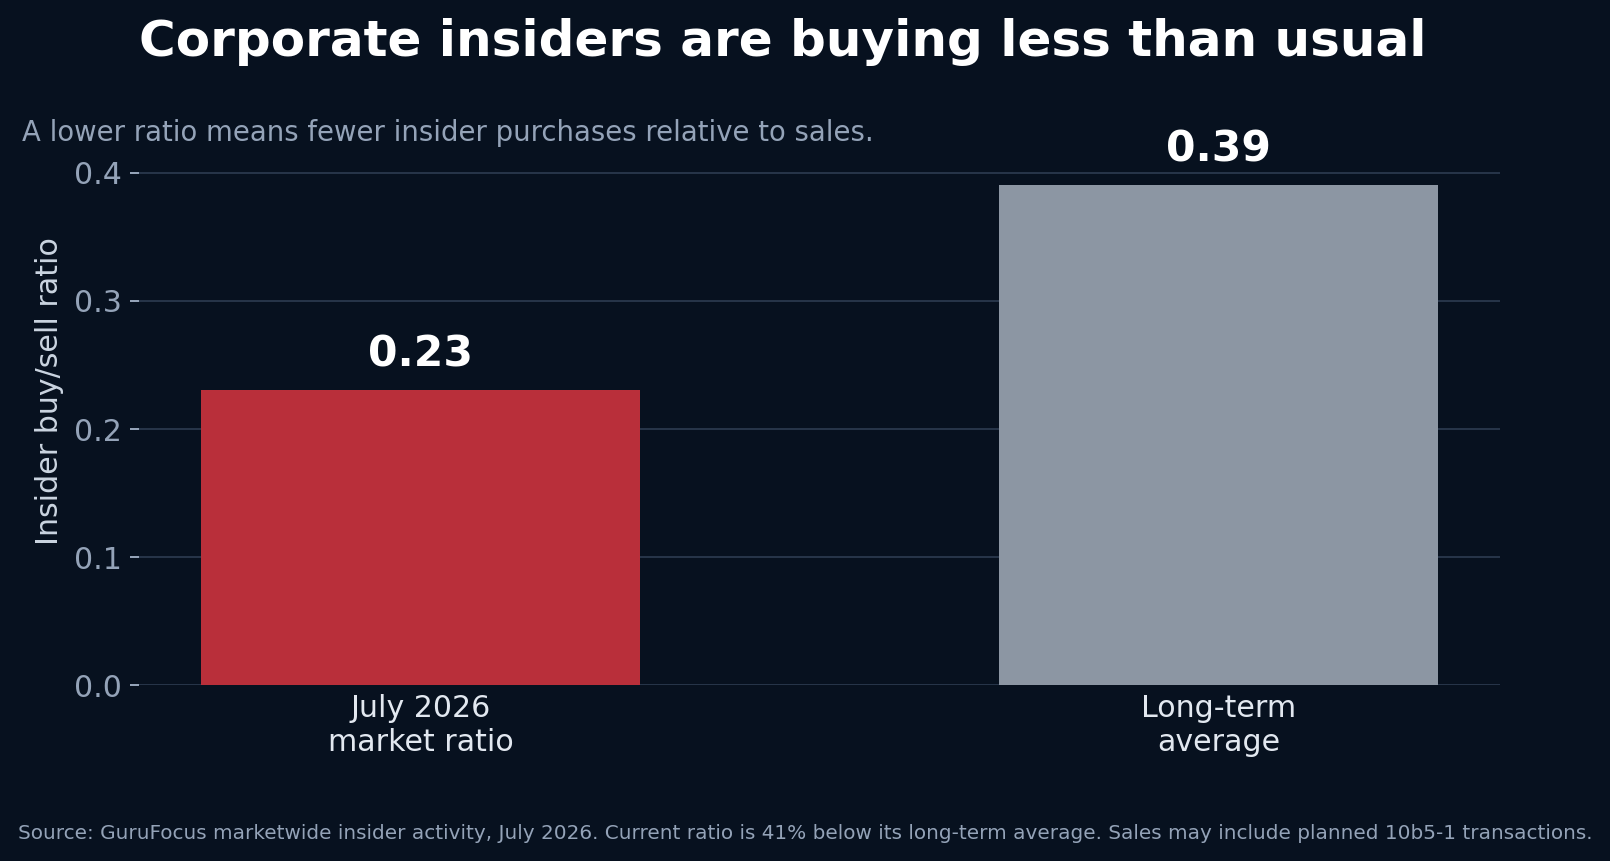
The overall U.S. market insider buy/sell ratio is currently approximately 0.23, compared with a long-term average of 0.39.
That puts the current ratio about 41% below its historical average, meaning insider buying remains unusually weak relative to selling
.Earlier this year, Reuters reported that the seller-to-buyer ratio reached 4.2—its highest level in 20 months.
During that period, there were 2,260 recorded instances of insiders selling versus only 543 instances of buying. The estimated value of shares sold was approximately $6.6 billion.
Those datasets use different methodologies, but they point in the same direction:
That is not a perfect market-timing signal. Insiders can sell for many personal reasons.
But insiders normally buy shares with their own money for one main reason: they believe the stock offers value.
When the market is near record highs, insiders are selling, growth funds are experiencing outflows and retail traders are still chasing—it deserves attention.
Most insider transactions must be publicly reported through SEC Form 4 filings, generally within two business days.
The insider activity I pay closest attention to is:
Multiple executives selling around the same time
Large discretionary open-market sales
Selling that accelerates after a major rally
Executives reducing a meaningful percentage of their ownership
Very little insider buying across the same company or sector
Sales not clearly connected to taxes, vesting or an existing 10b5-1 plan
Insider selling doesn’t tell us exactly when the market will drop.
But it can tell us that the people closest to these companies may not consider current prices attractive enough to buy.
I believe the market still has room to bleed more.
But I’m not blindly buying puts and predicting a crash.
I need confirmation from price.
SPY 740 and QQQ 686 are the two trapdoors.
If buyers defend them, we could see another squeeze higher.
If daily candles begin accepting below them, the next downside zones become real—not just dramatic numbers drawn on a chart.
SPY closed Friday at 743.29 after rejecting below the 760.40 all-time-high zone.
The chart is building lower highs beneath descending resistance, while 740 continues acting as the floor.
This is compression.
Compression normally leads to expansion. The question is which direction breaks first
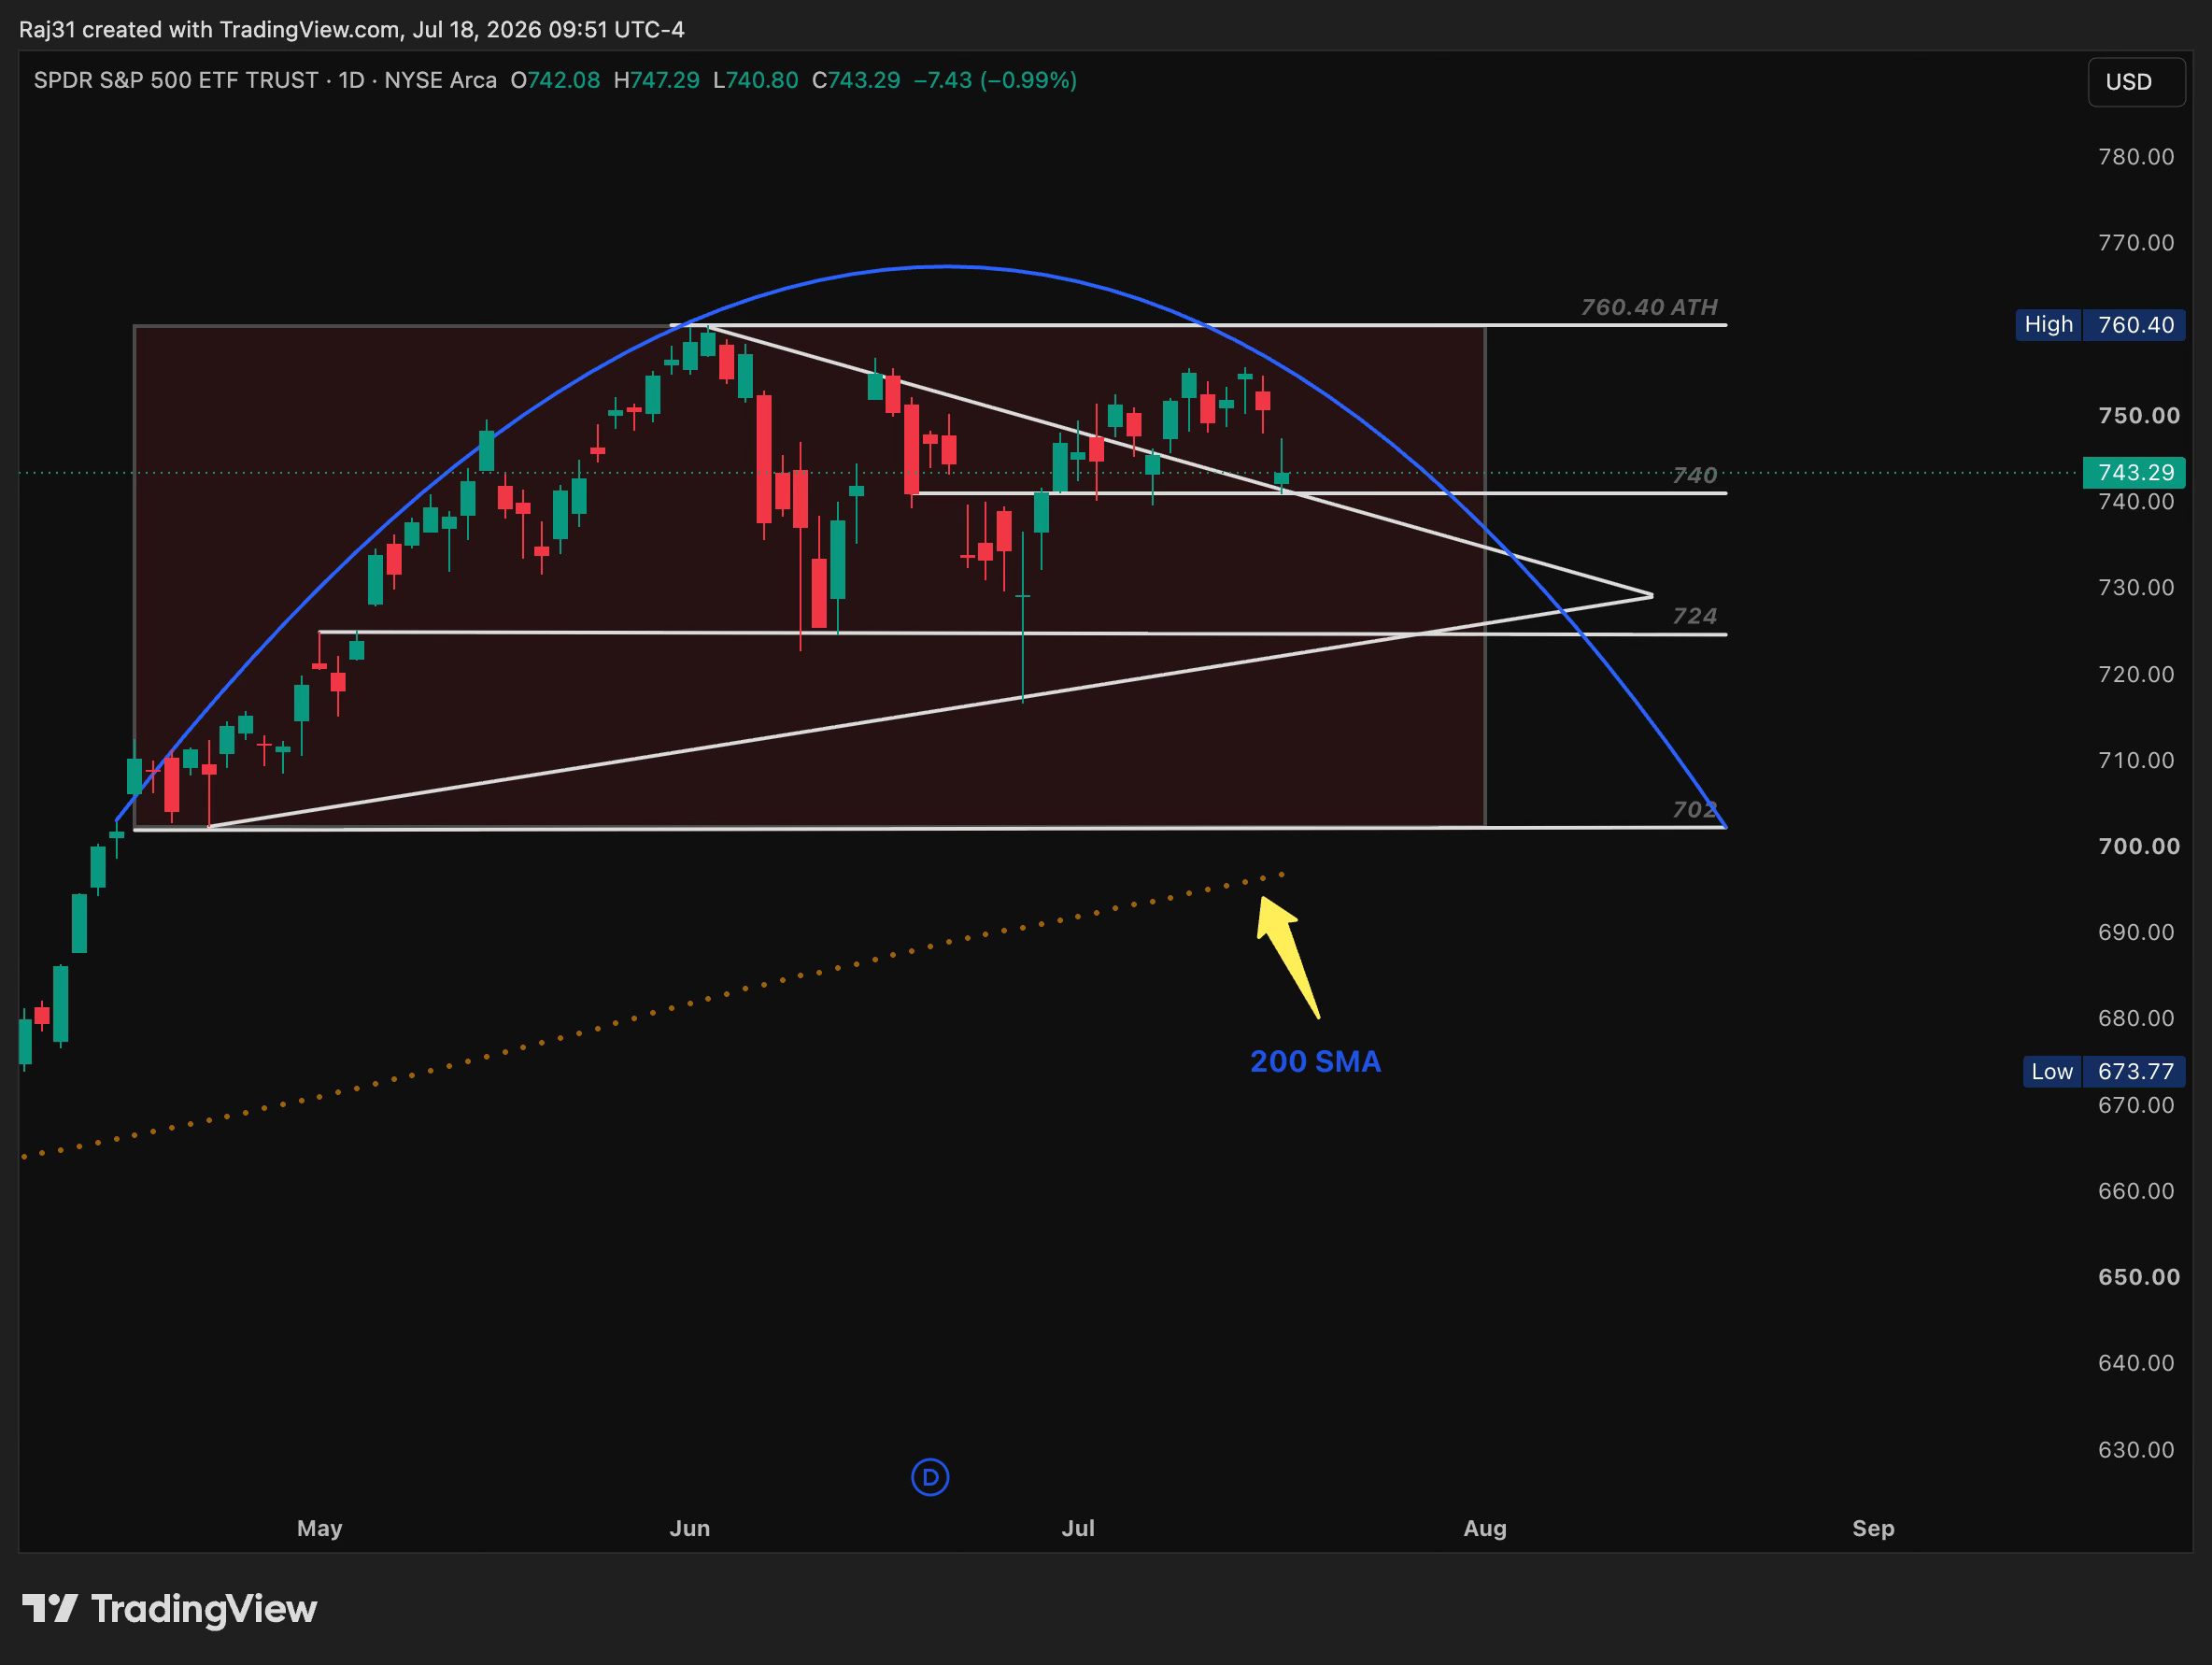
A daily close below 740 would signal that buyers are losing control.
That opens the door toward 724, where horizontal demand meets the rising trendline.
If 724 fails, the entire structure weakens. From there, 702 and the high-690s near the rising 200-day moving average become the larger downside zone.
That doesn’t mean SPY will fall in a straight line.
We could see relief bounces, short squeezes and failed reclaim attempts along the way. Those failed reclaims are what I want to trade.
Bearish confirmation:
740 breaks and becomes resistance → 724 → 702 → high-690s
Bullish invalidation:
Reclaim 750–754 → retest 760.40
For the faster intraday plan, 744.01 is my main decision level.
Above 744.01:
745.33 → 746.60 → 747.36 → 748.72 → 750.24
A rejection brings:
742.57 → 740 → 738 → 736
The level itself isn’t the trade.
The reaction at the level is the trade.
QQQ closed at 695.33 after dropping 1.50%.
Technology is already showing more stress than the broader market.
The Nasdaq-100 Volatility Index was 27.34 on July 16, compared with a VIX reading of only 16.73. Tech volatility is elevated, while the broader market still isn’t pricing complete panic.
That leaves room for broader volatility to catch up if support breaks.
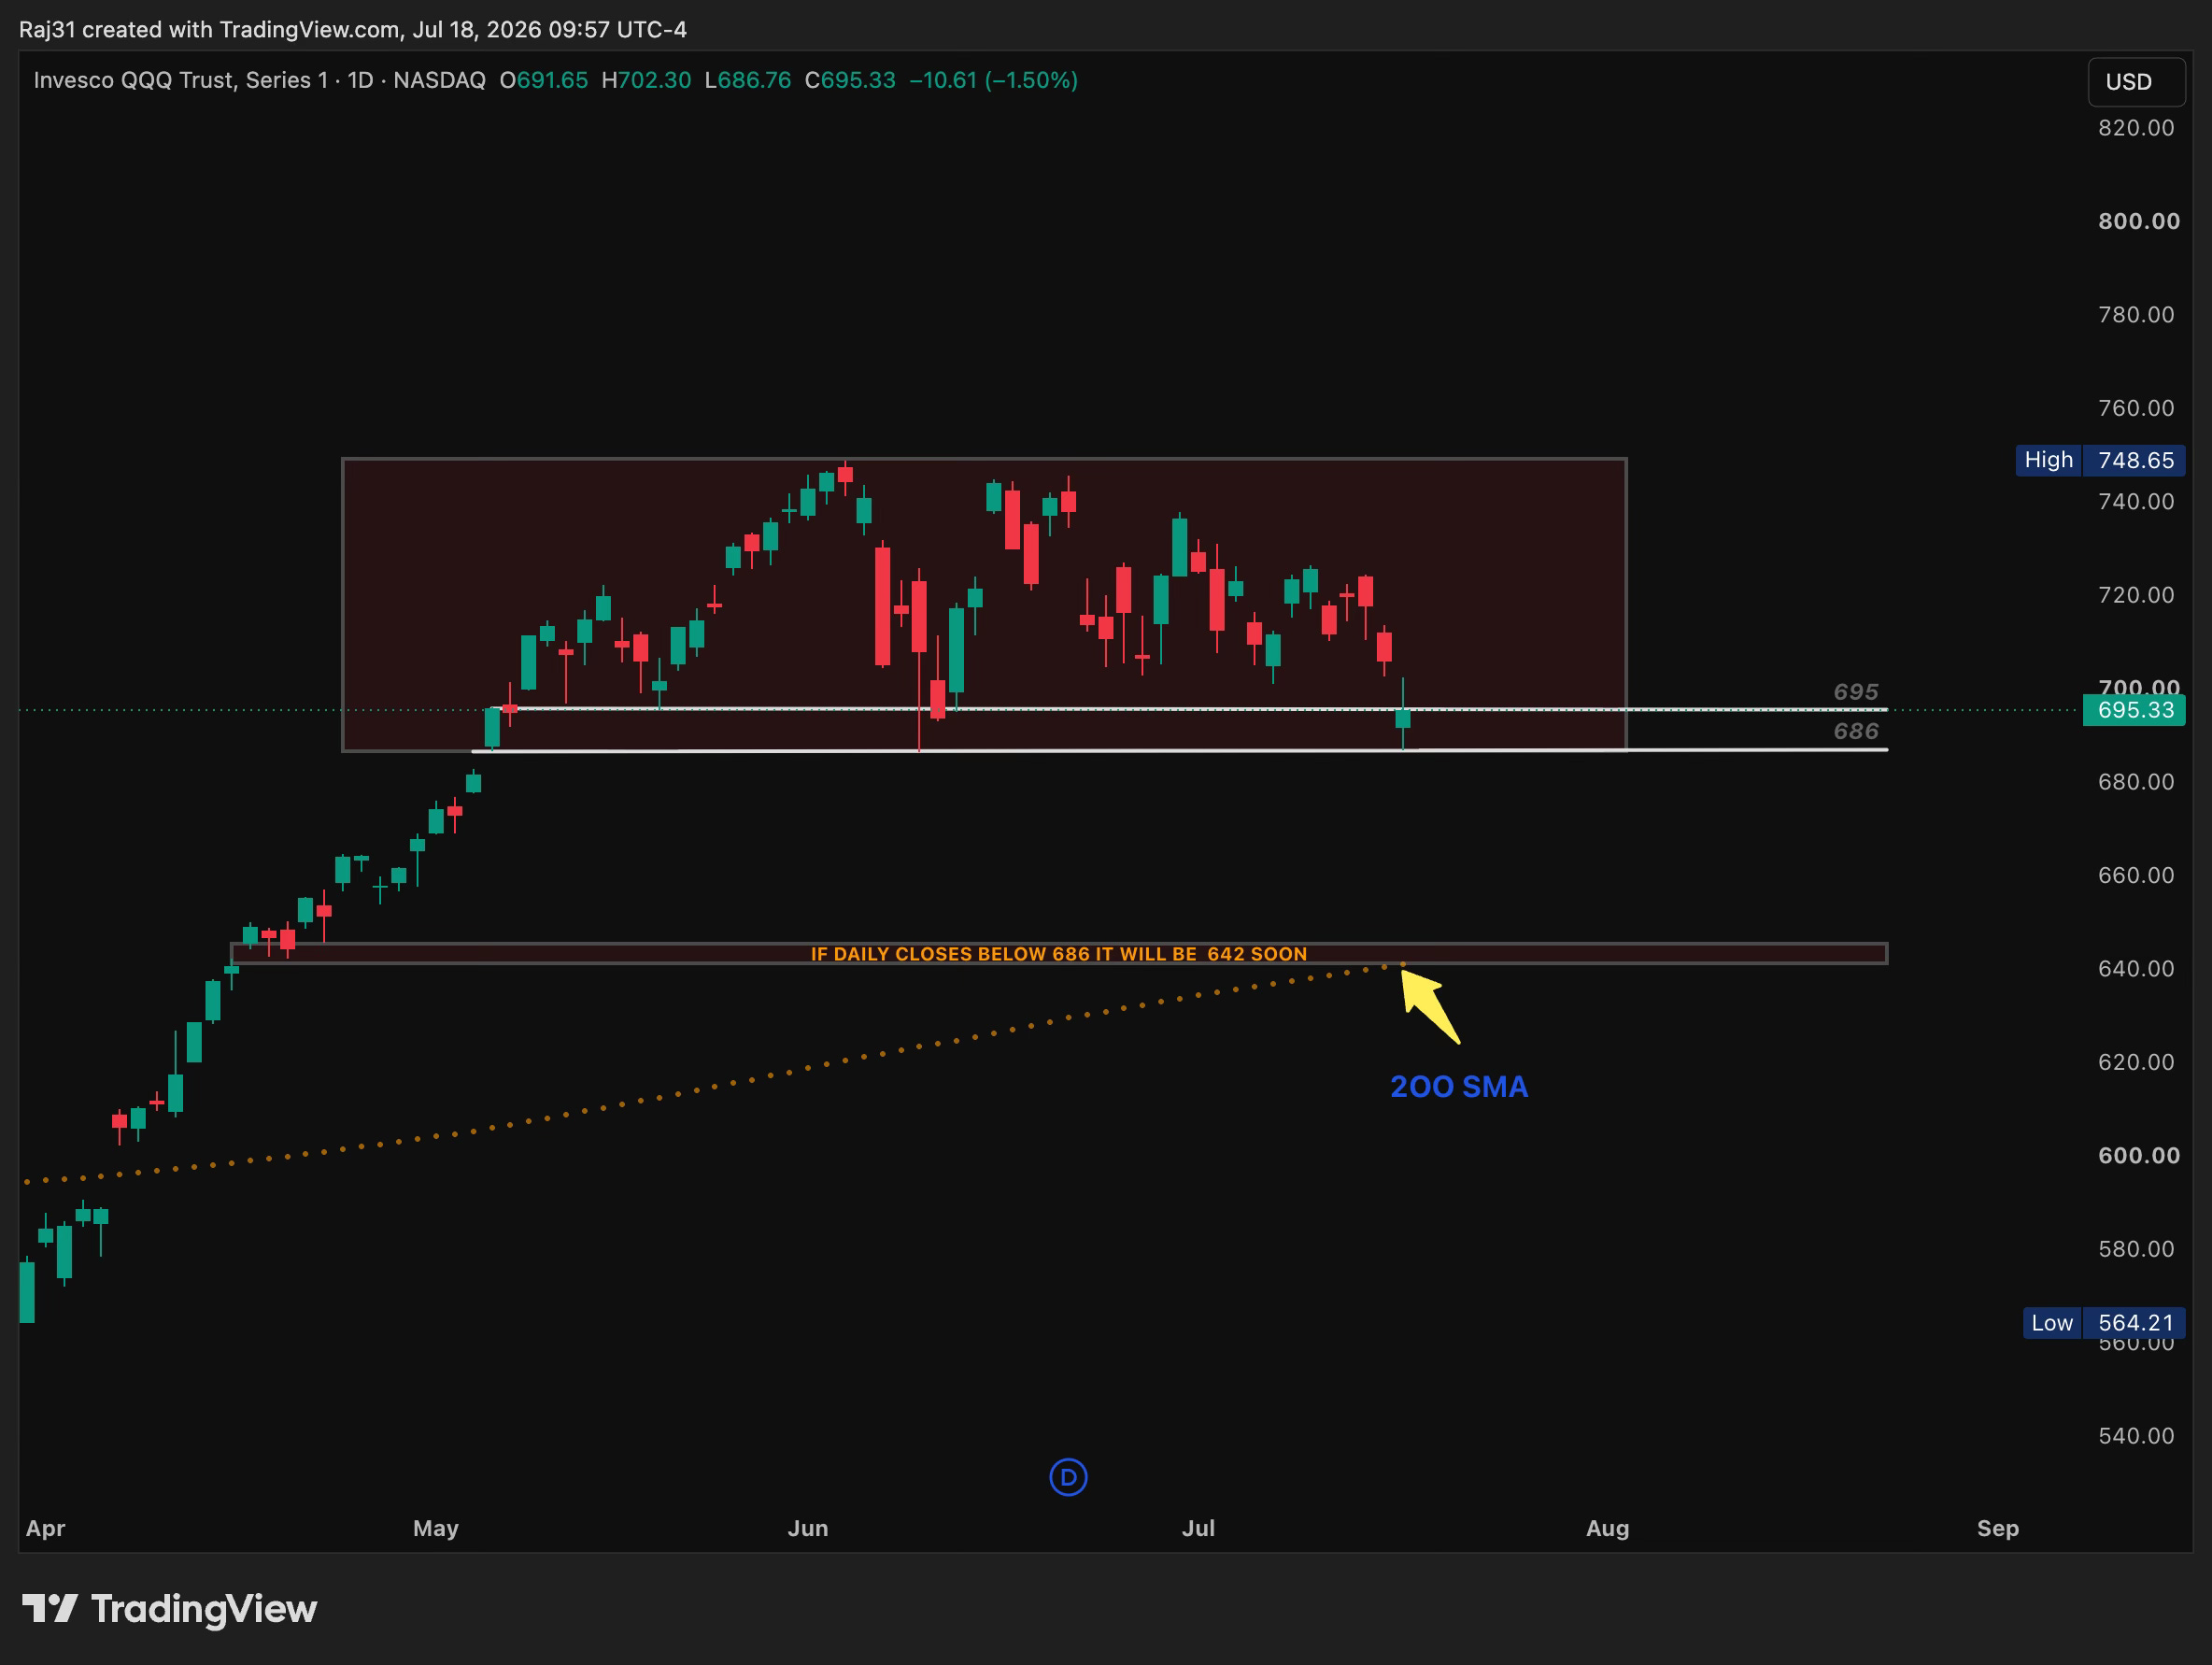
The first QQQ pivot is 695/692.20.
The major structural support is 686.
QQQ has repeatedly found buyers around this area. But every time a support level gets tested, some of the demand sitting there gets used.
A daily close below 686 would turn old support into resistance.
If QQQ then attempts to reclaim 686 and fails, that would provide much stronger bearish confirmation.
Below 686, I’ll watch for reactions around 675–670.
The larger downside area is 650–642, where the rising 200-day moving average is approaching.
I’m not saying QQQ will immediately collapse to 642.
Markets rarely move in a straight line.
We could break 686, bounce toward 690–695, form a lower high and then continue lower.
That is the professional setup:
Break → failed reclaim → continuation
Bearish confirmation:
Daily close below 686 → failed reclaim → 675–670 → 650–642
Bullish invalidation:
Reclaim 700–702 → 715–720
For the faster plan, 692.20 is my pivot.
Above 692.20:
695.34 → 696.44 → 698.28 → 700.94
A rejection brings:
690 → 688 → 686 → 684
This is not a quiet earnings week.
Tuesday brings COF, NOC and SCHW.
Wednesday is the biggest day, with TSLA, GOOGL and IBM reporting.
Thursday brings INTC and NOK, followed by AXP on Friday
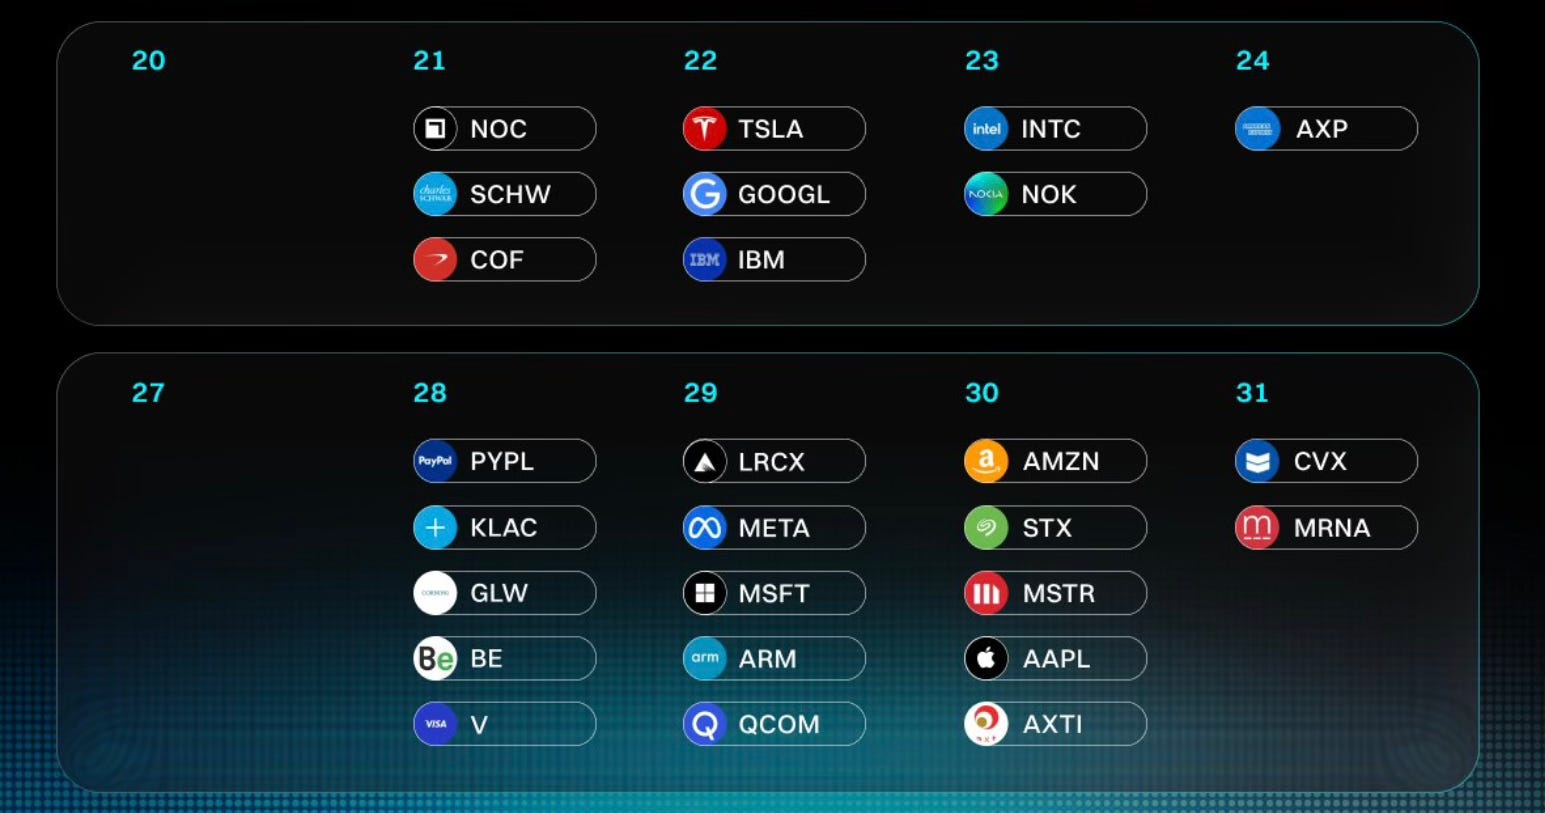
TSLA and GOOGL can reset sentiment across growth stocks.
INTC can influence positioning throughout the semiconductor sector.
COF and AXP will give us more information about consumer spending, credit conditions and potential loan stress.
The following week gets even heavier:
META, MSFT, AAPL, AMZN, ARM, QCOM, PYPL, LRCX and CVX are all on the calendar
That creates two major risks.
That creates two major risks.
First, companies can report good results and still sell off if expectations were already too high.
Second, traders may reduce exposure before the reports, putting additional pressure on technology stocks even before earnings are released.
I’m not interested in gambling through earnings with oversized positions.
I want to trade the market’s reaction after the numbers are released.
The biggest macro risk is the U.S.–Iran conflict and its effect on global energy routes.
Brent crude finished Friday at $88.10, while WTI closed at $82.49. Both gained approximately 16% for the week as the conflict threatened oil flows through the Strait of Hormuz and surrounding shipping routes.
Before the conflict, approximately one-fifth of global oil supplies passed through the Strait of Hormuz.
But war doesn’t affect stocks through headlines alone.
The chain looks like this:
War → supply disruption → higher oil → higher transportation costs → higher inflation → fewer Fed cuts → higher yields → pressure on technology valuationsHigher energy prices raise fuel, freight and insurance expenses.
Companies must either absorb those costs, hurting profit margins, or pass them to consumers, keeping inflation elevated.
If inflation expectations rise, the market may reduce its expectations for interest-rate cuts.
Treasury yields can then move higher, putting pressure on expensive technology and growth stocks.
That is why war can hurt QQQ even when technology companies have no direct connection to the conflict.
Energy companies such as XOM, CVX and OXY can remain strong if crude stays elevated.
Defense companies may attract buyers as governments increase military spending.
Gold can benefit from safe-haven demand.
The U.S. dollar may also attract defensive flows.
Airlines face higher fuel expenses.
Travel companies can weaken if consumers reduce discretionary spending.
Transportation businesses may face higher fuel, insurance and shipping costs.
Technology can struggle if yields rise and investors move away from expensive valuations.
Small-cap companies may experience additional pressure because they usually have less ability to absorb higher borrowing and operating costs.
The next FOMC meeting is scheduled for July 28–29.
The Fed blackout period removes the usual stream of speeches and guidance before the meeting.
That leaves traders reacting more aggressively to earnings, oil, bond yields and economic data.
If oil continues rising, the Fed faces an uncomfortable situation.
Cutting rates could support economic growth—but it could also add to inflation.
Keeping rates elevated could control inflation—but it would pressure housing, consumers and corporate borrowing.
The worst combination for the market would be weaker growth while inflation remains elevated.
That is the stagflation risk traders cannot ignore.
Flash U.S. PMI is scheduled for 9:45 a.m. ET on Friday, July 24.
New-home sales are scheduled for 10:00 a.m. ET.
PMI will give us a faster reading on business activity, hiring, demand and price pressures.
New-home sales will show how consumers are handling mortgage rates and affordability.
Strong growth with controlled inflation would support the market.
Weak growth with lower inflation could increase rate-cut expectations.
But weak growth combined with sticky prices would be the ugliest result for risk assets.
2026 is a U.S. midterm-election year.
Historically, these periods can bring weaker performance before the election and stronger returns after the results become clear.
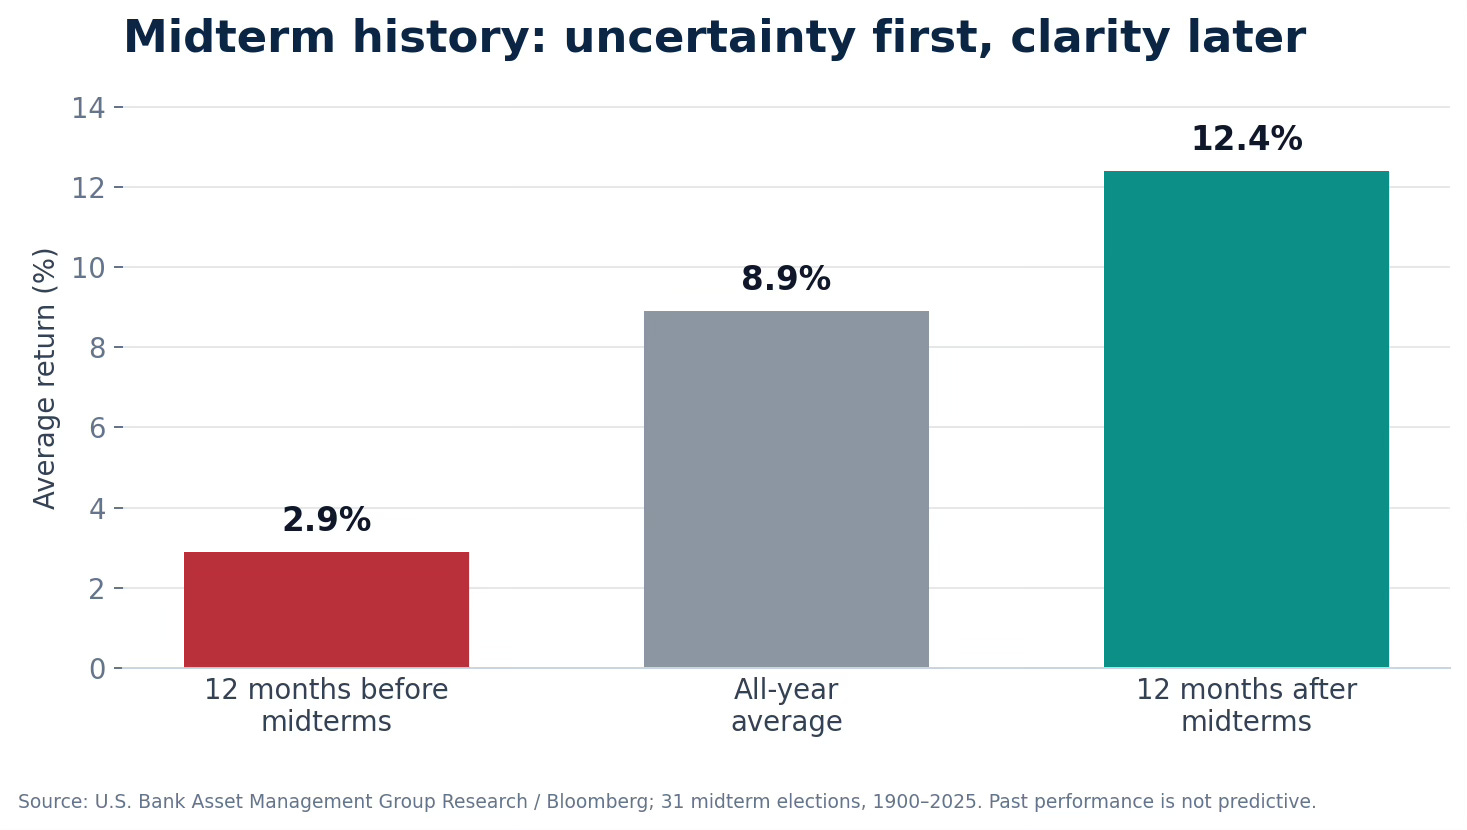
A U.S. Bank study covering 31 midterm elections from 1900 through 2025 found:
Average return during the 12 months before midterms: +2.9%
Average return across all years: +8.9%
Average return during the 12 months after midterms: +12.4%
But there is an important detail.
The study found the election effect was not statistically reliable enough to treat it as a guaranteed trading signal.
Economic growth, inflation, interest rates, earnings, war and financial stress had a larger influence on the weakest midterm years.
My interpretation is simple:
The election can add uncertainty and volatility, but it will not decide the market by itself.
The dangerous part of 2026 is the combination of midterm uncertainty, insider selling, war, higher oil, Fed pressure and weakening technology leadership happening at the same time.
History may rhyme. Price still has to confirm.
My Trading Plan & Watchlist
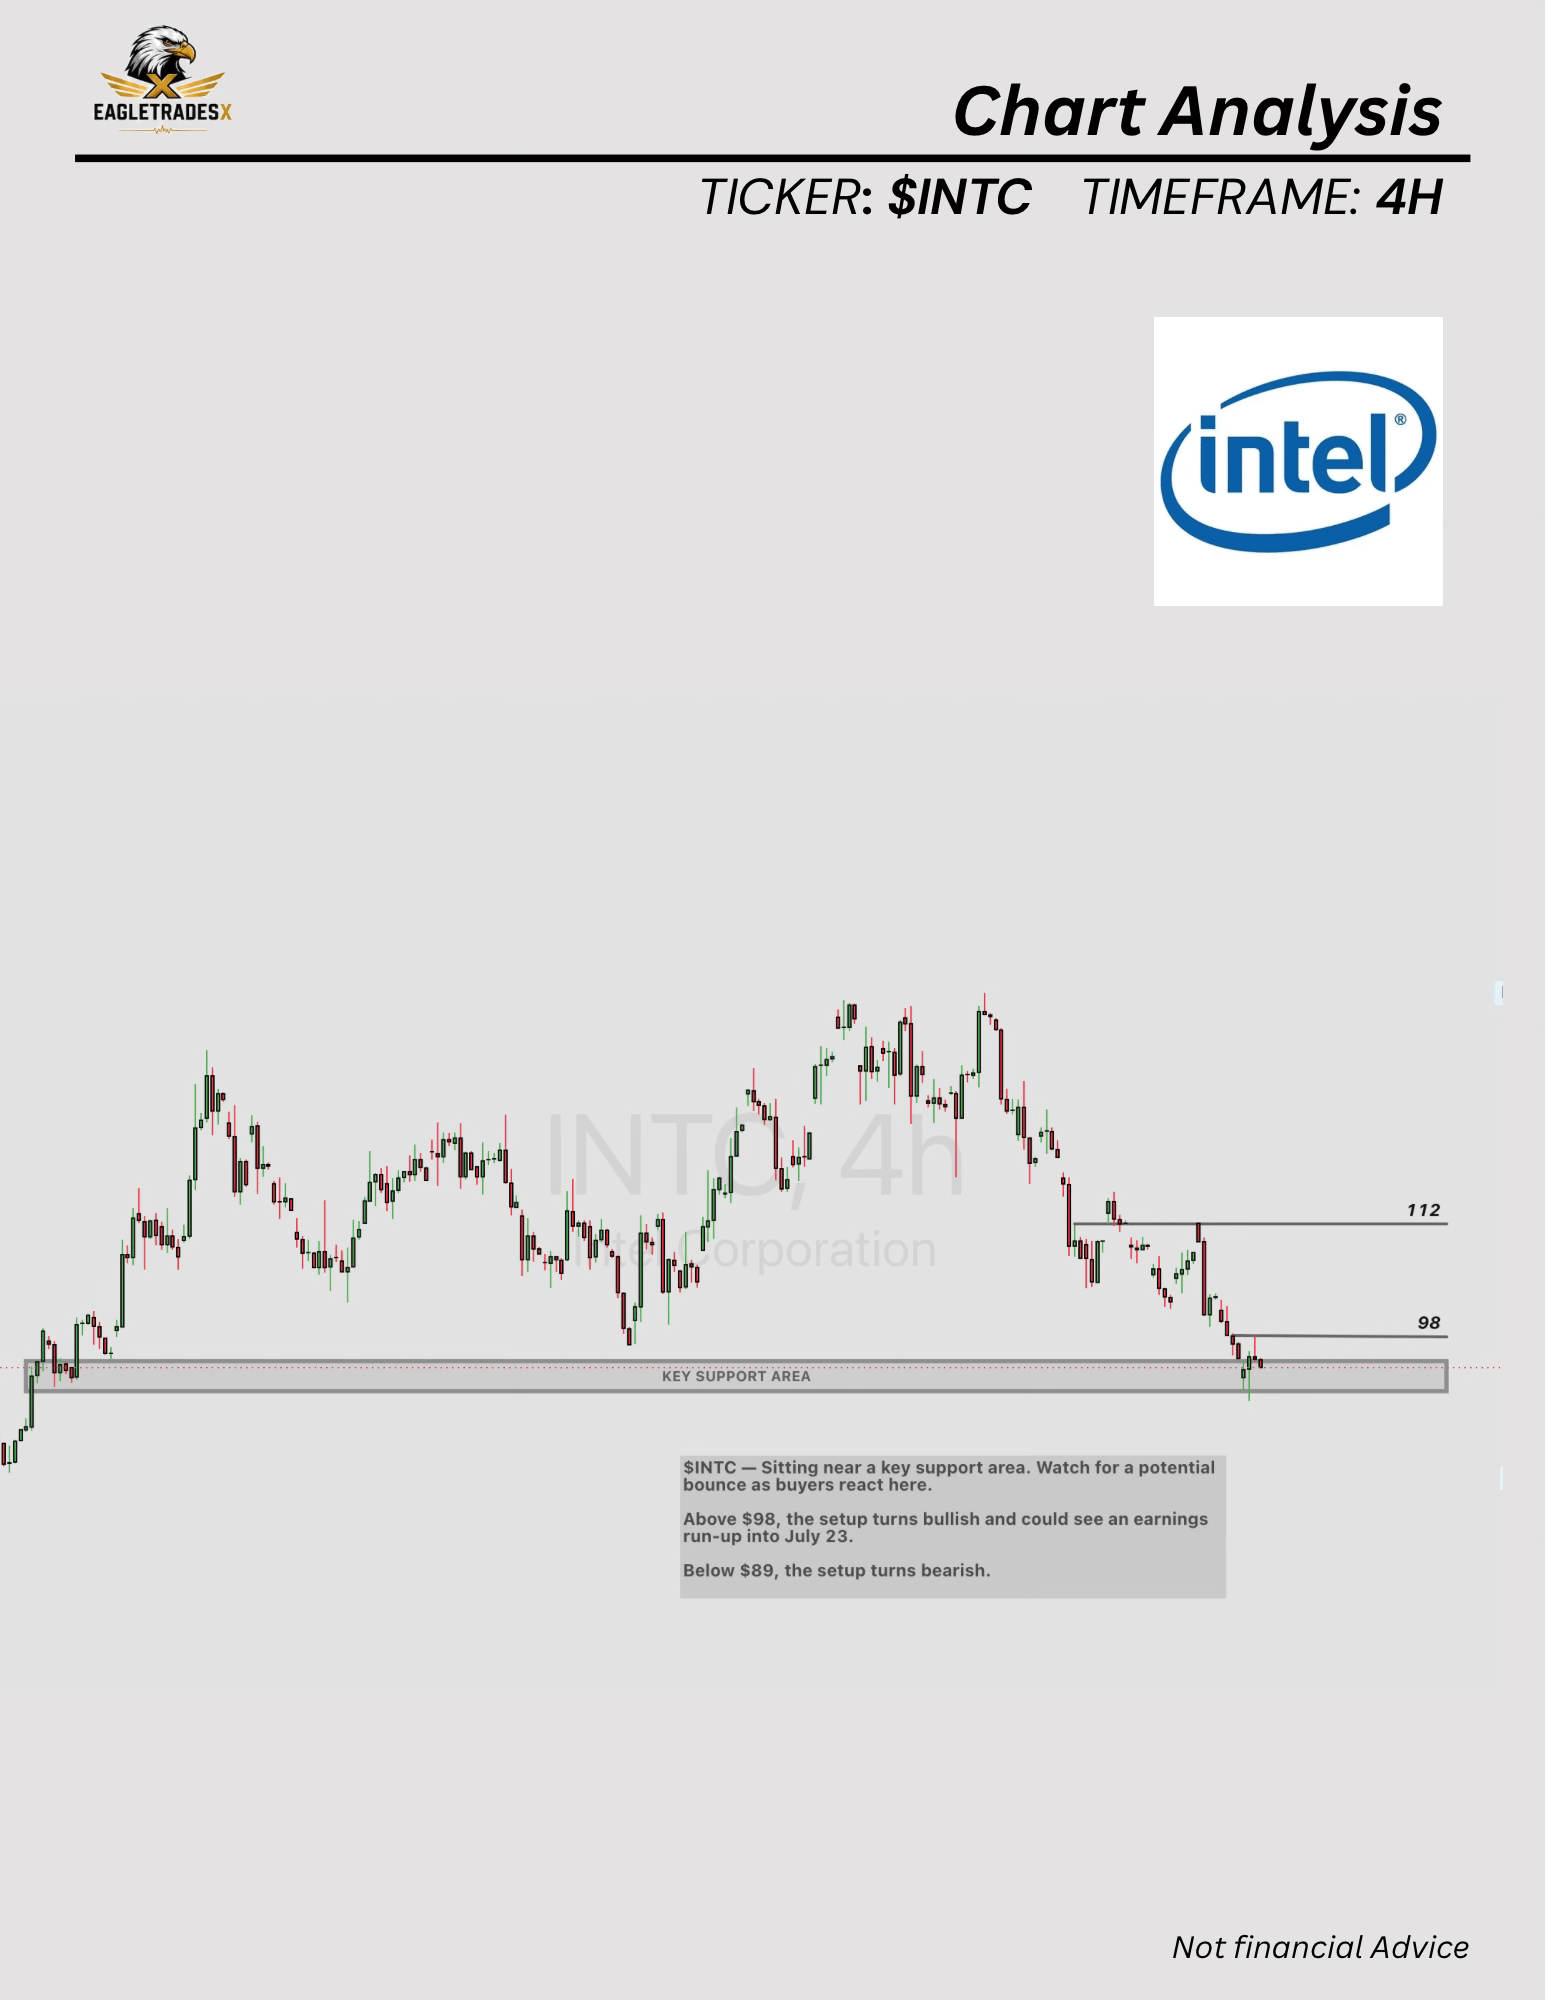
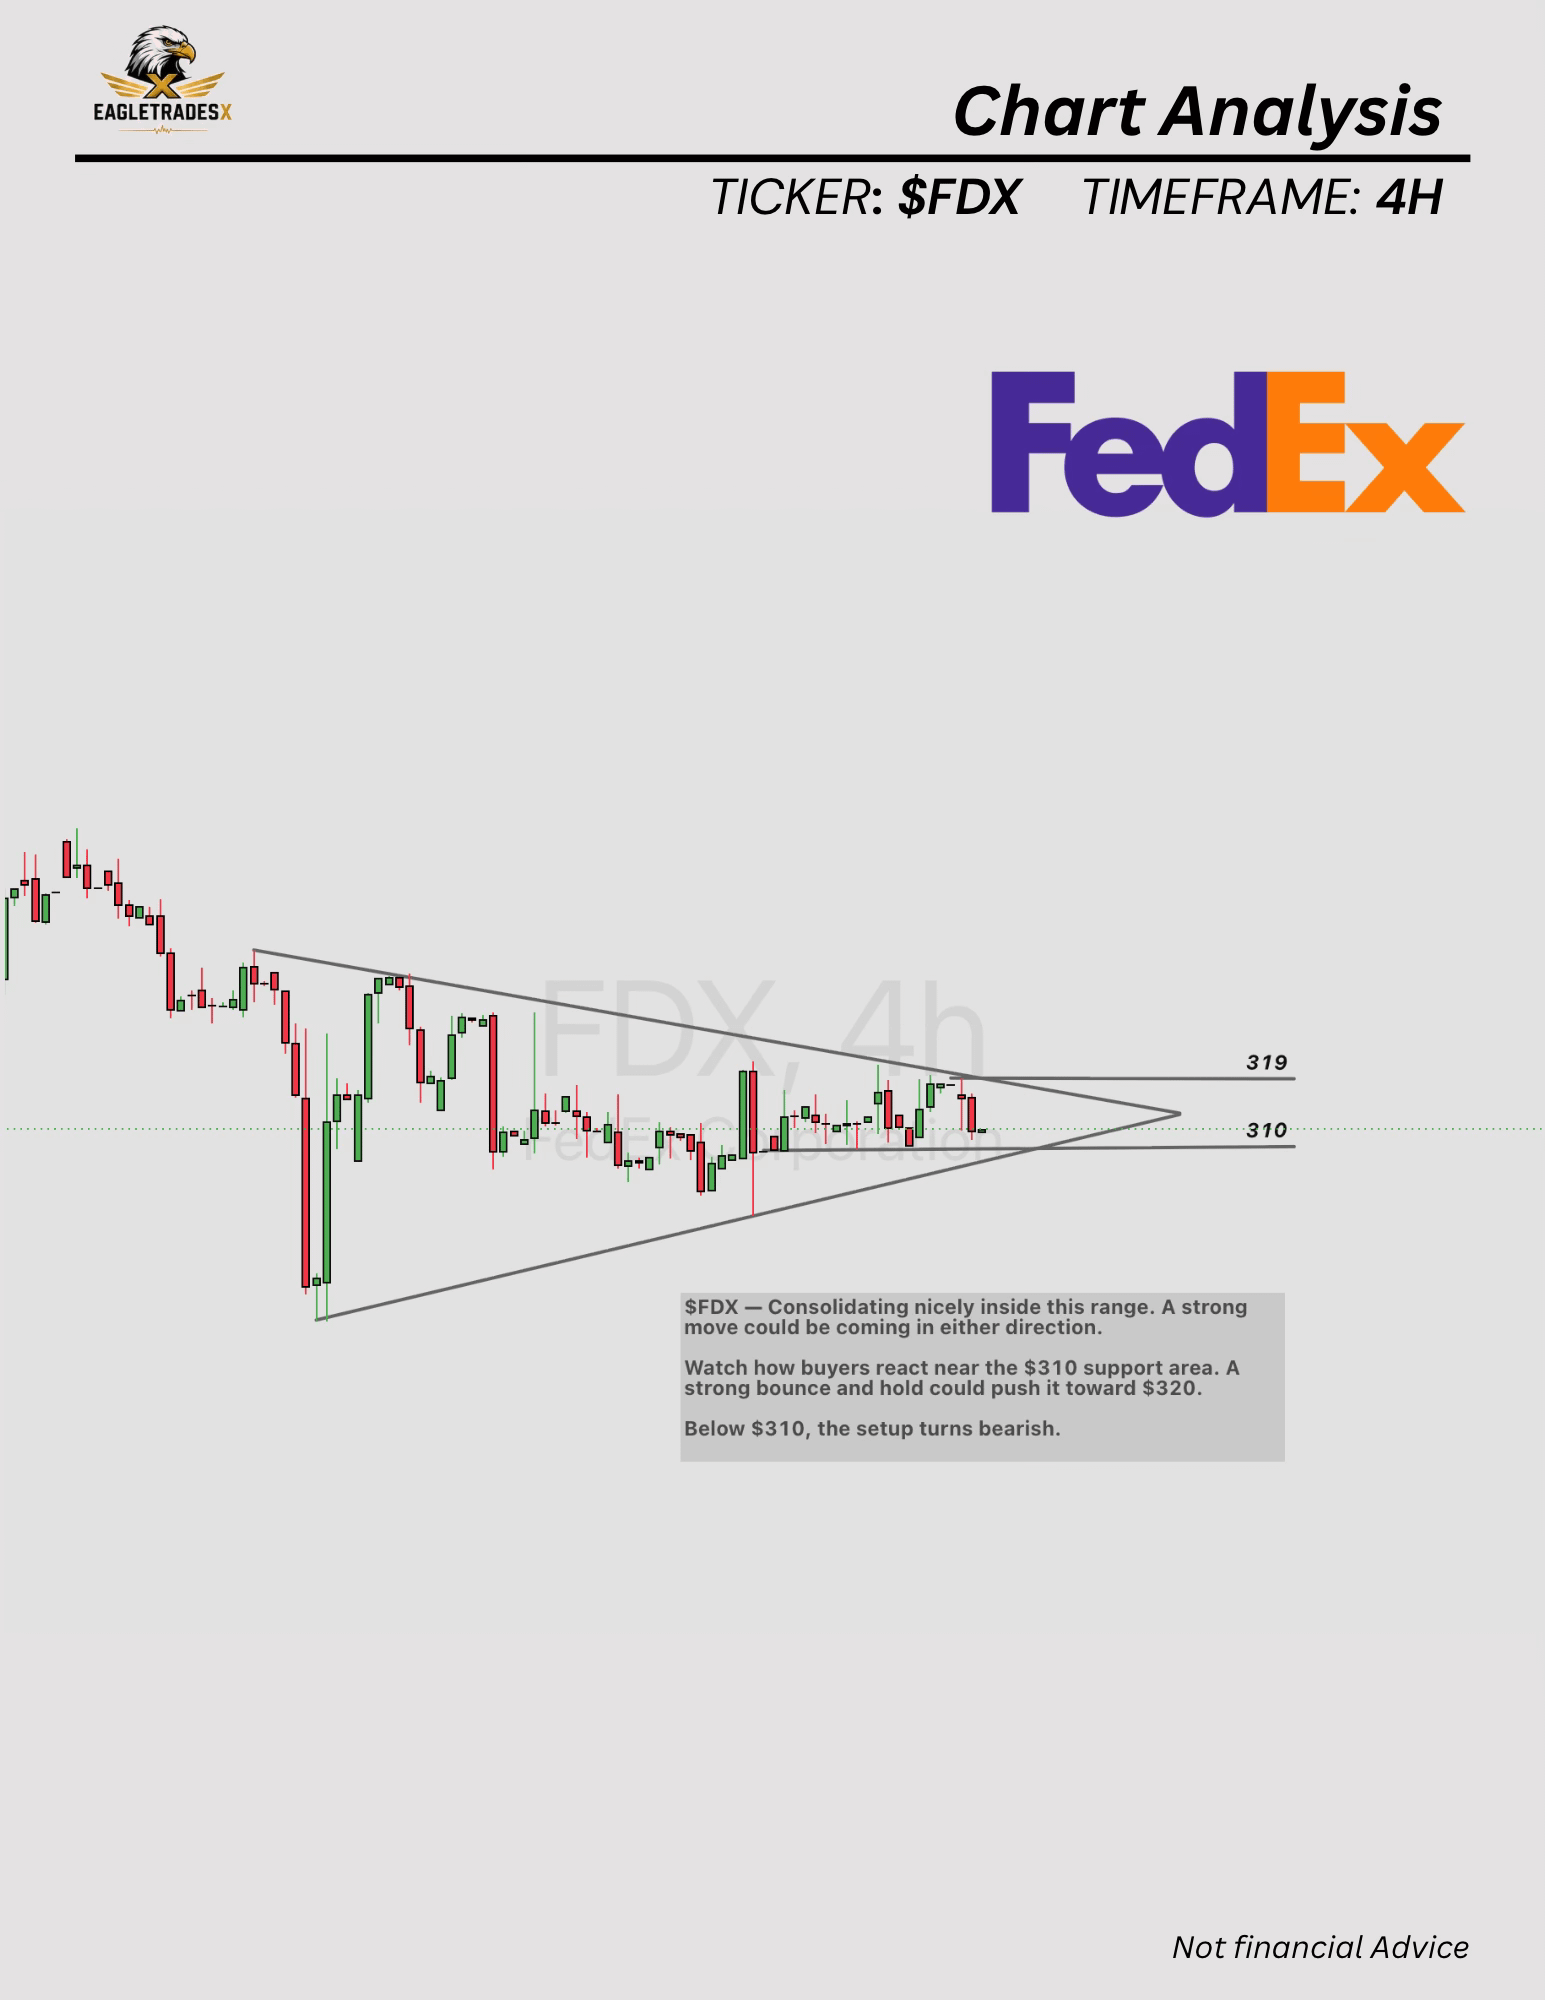
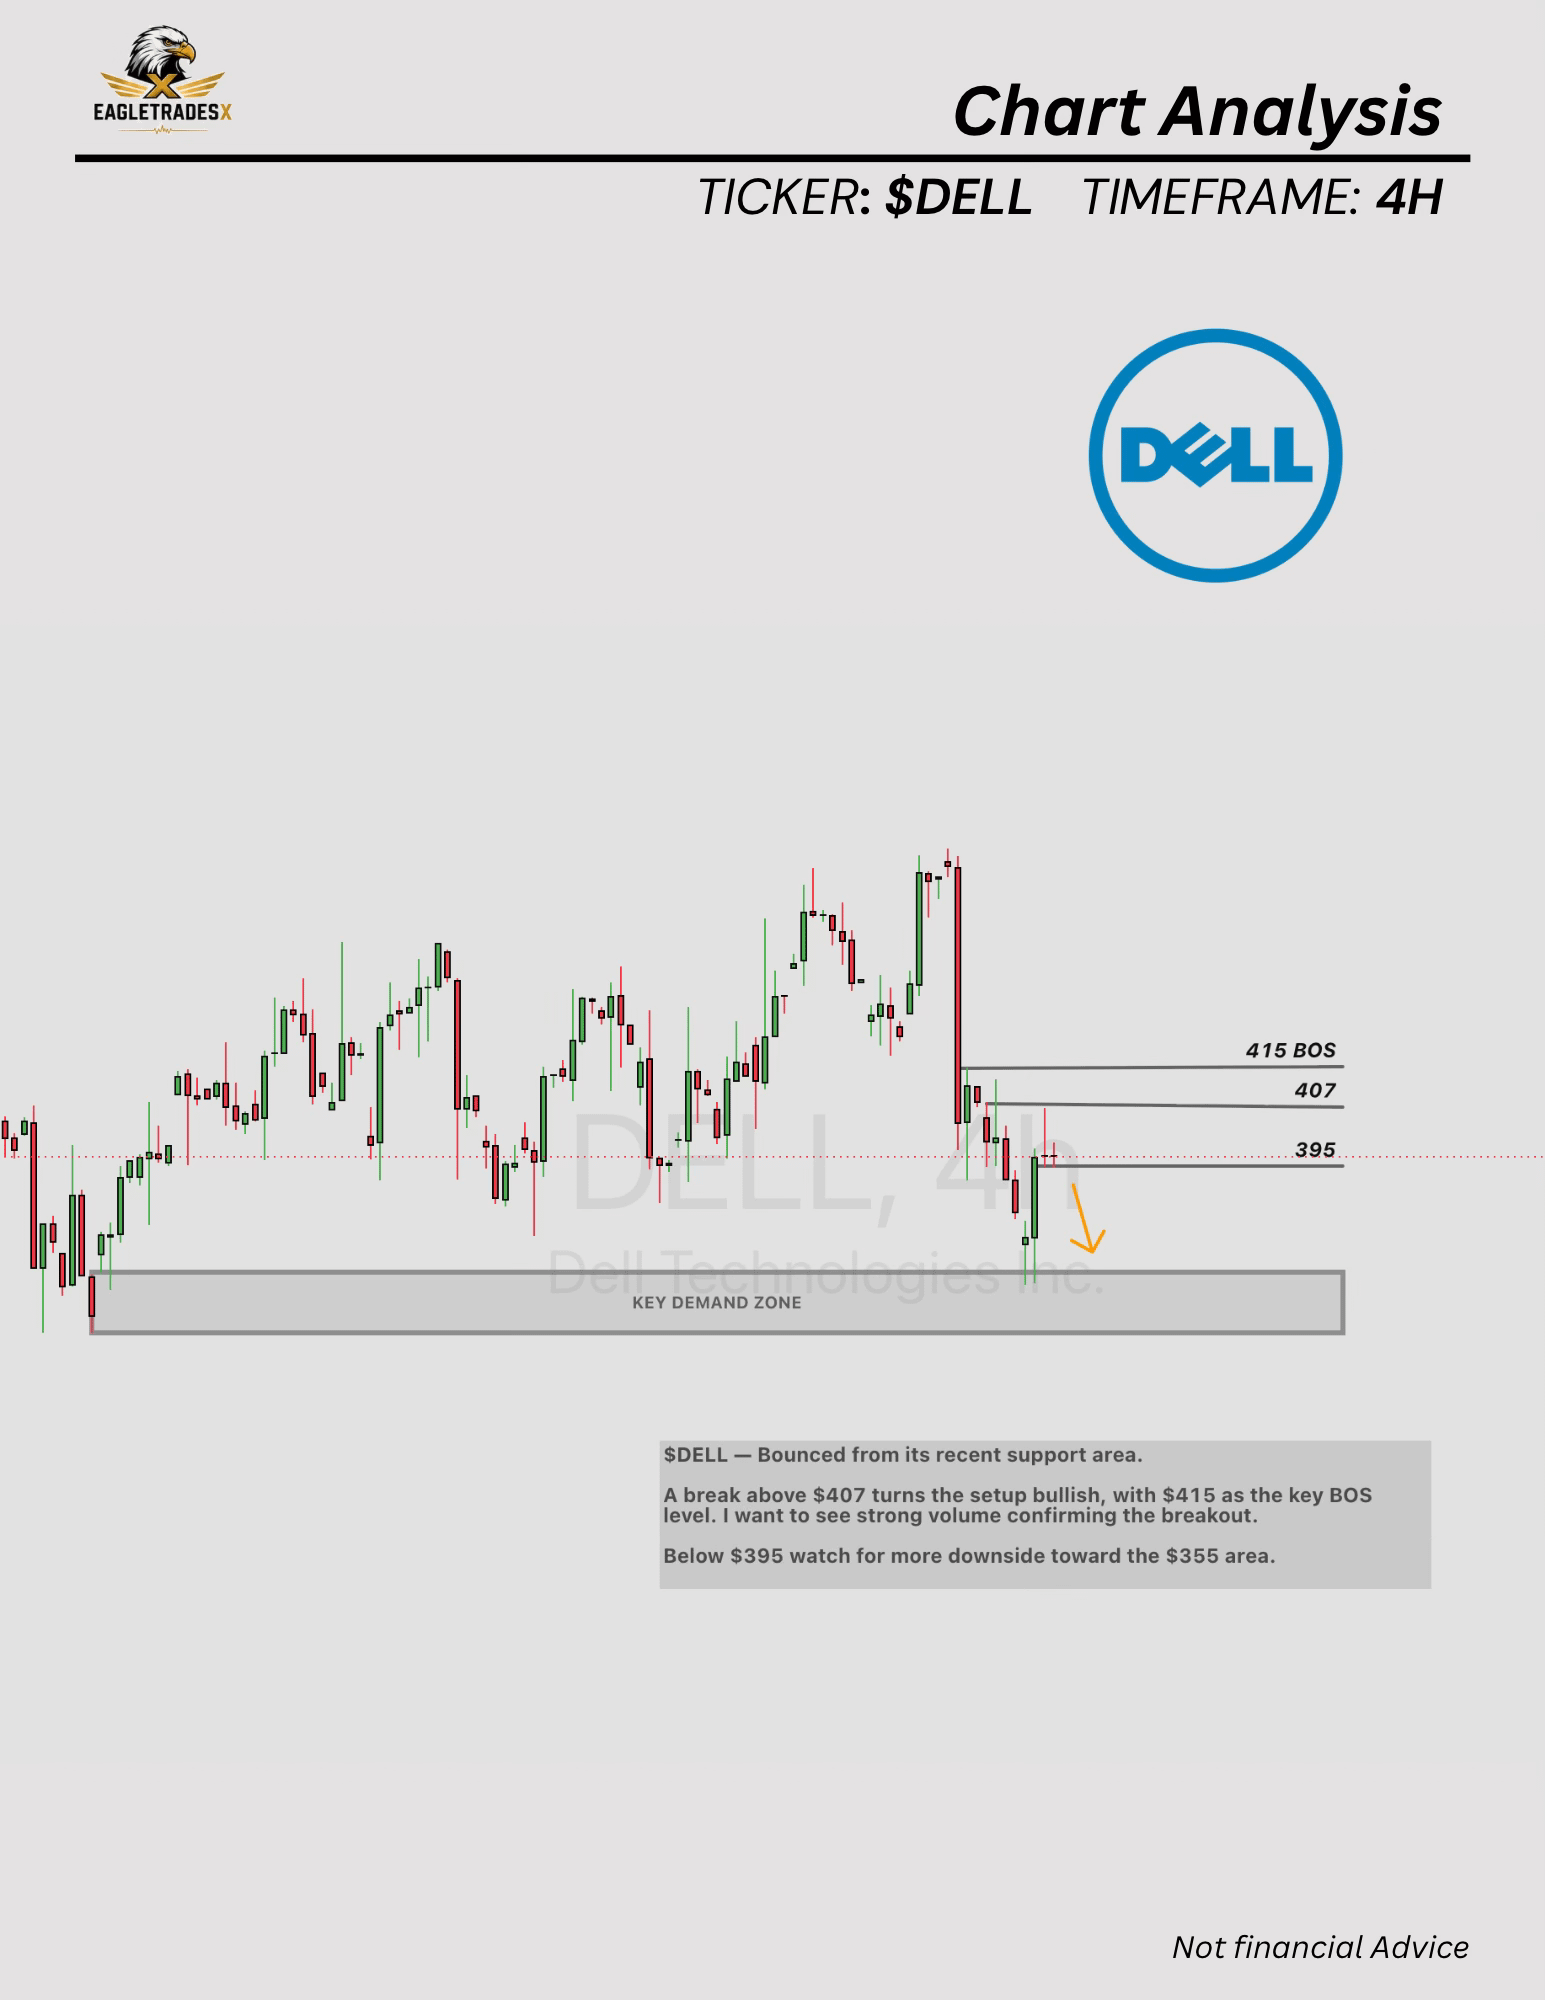
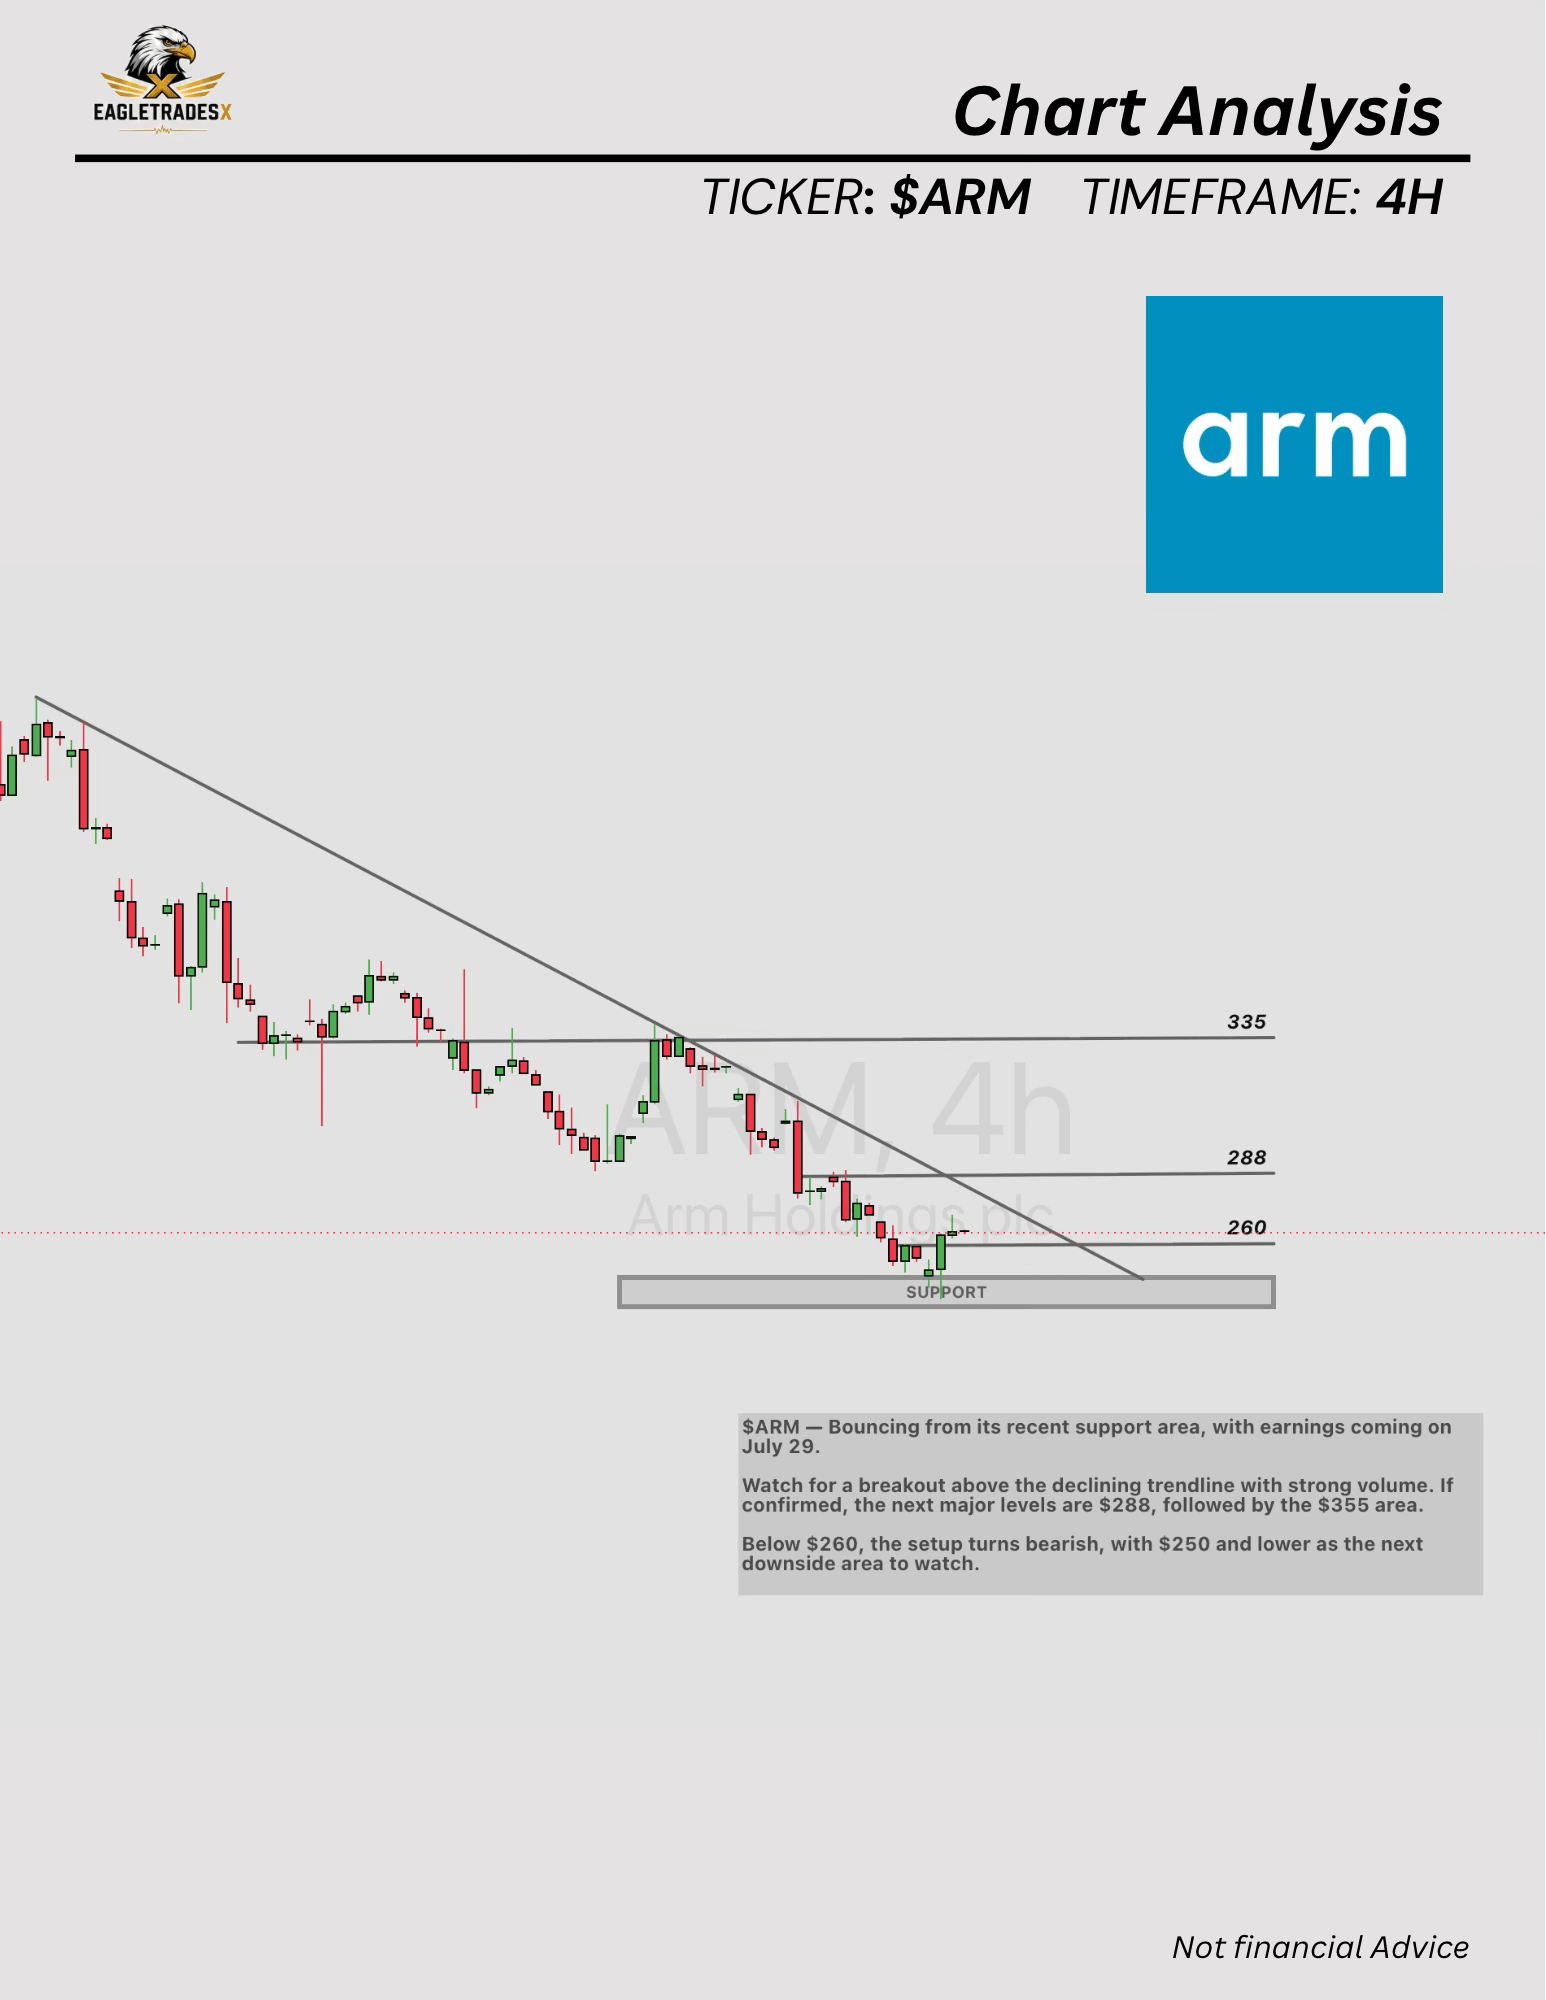
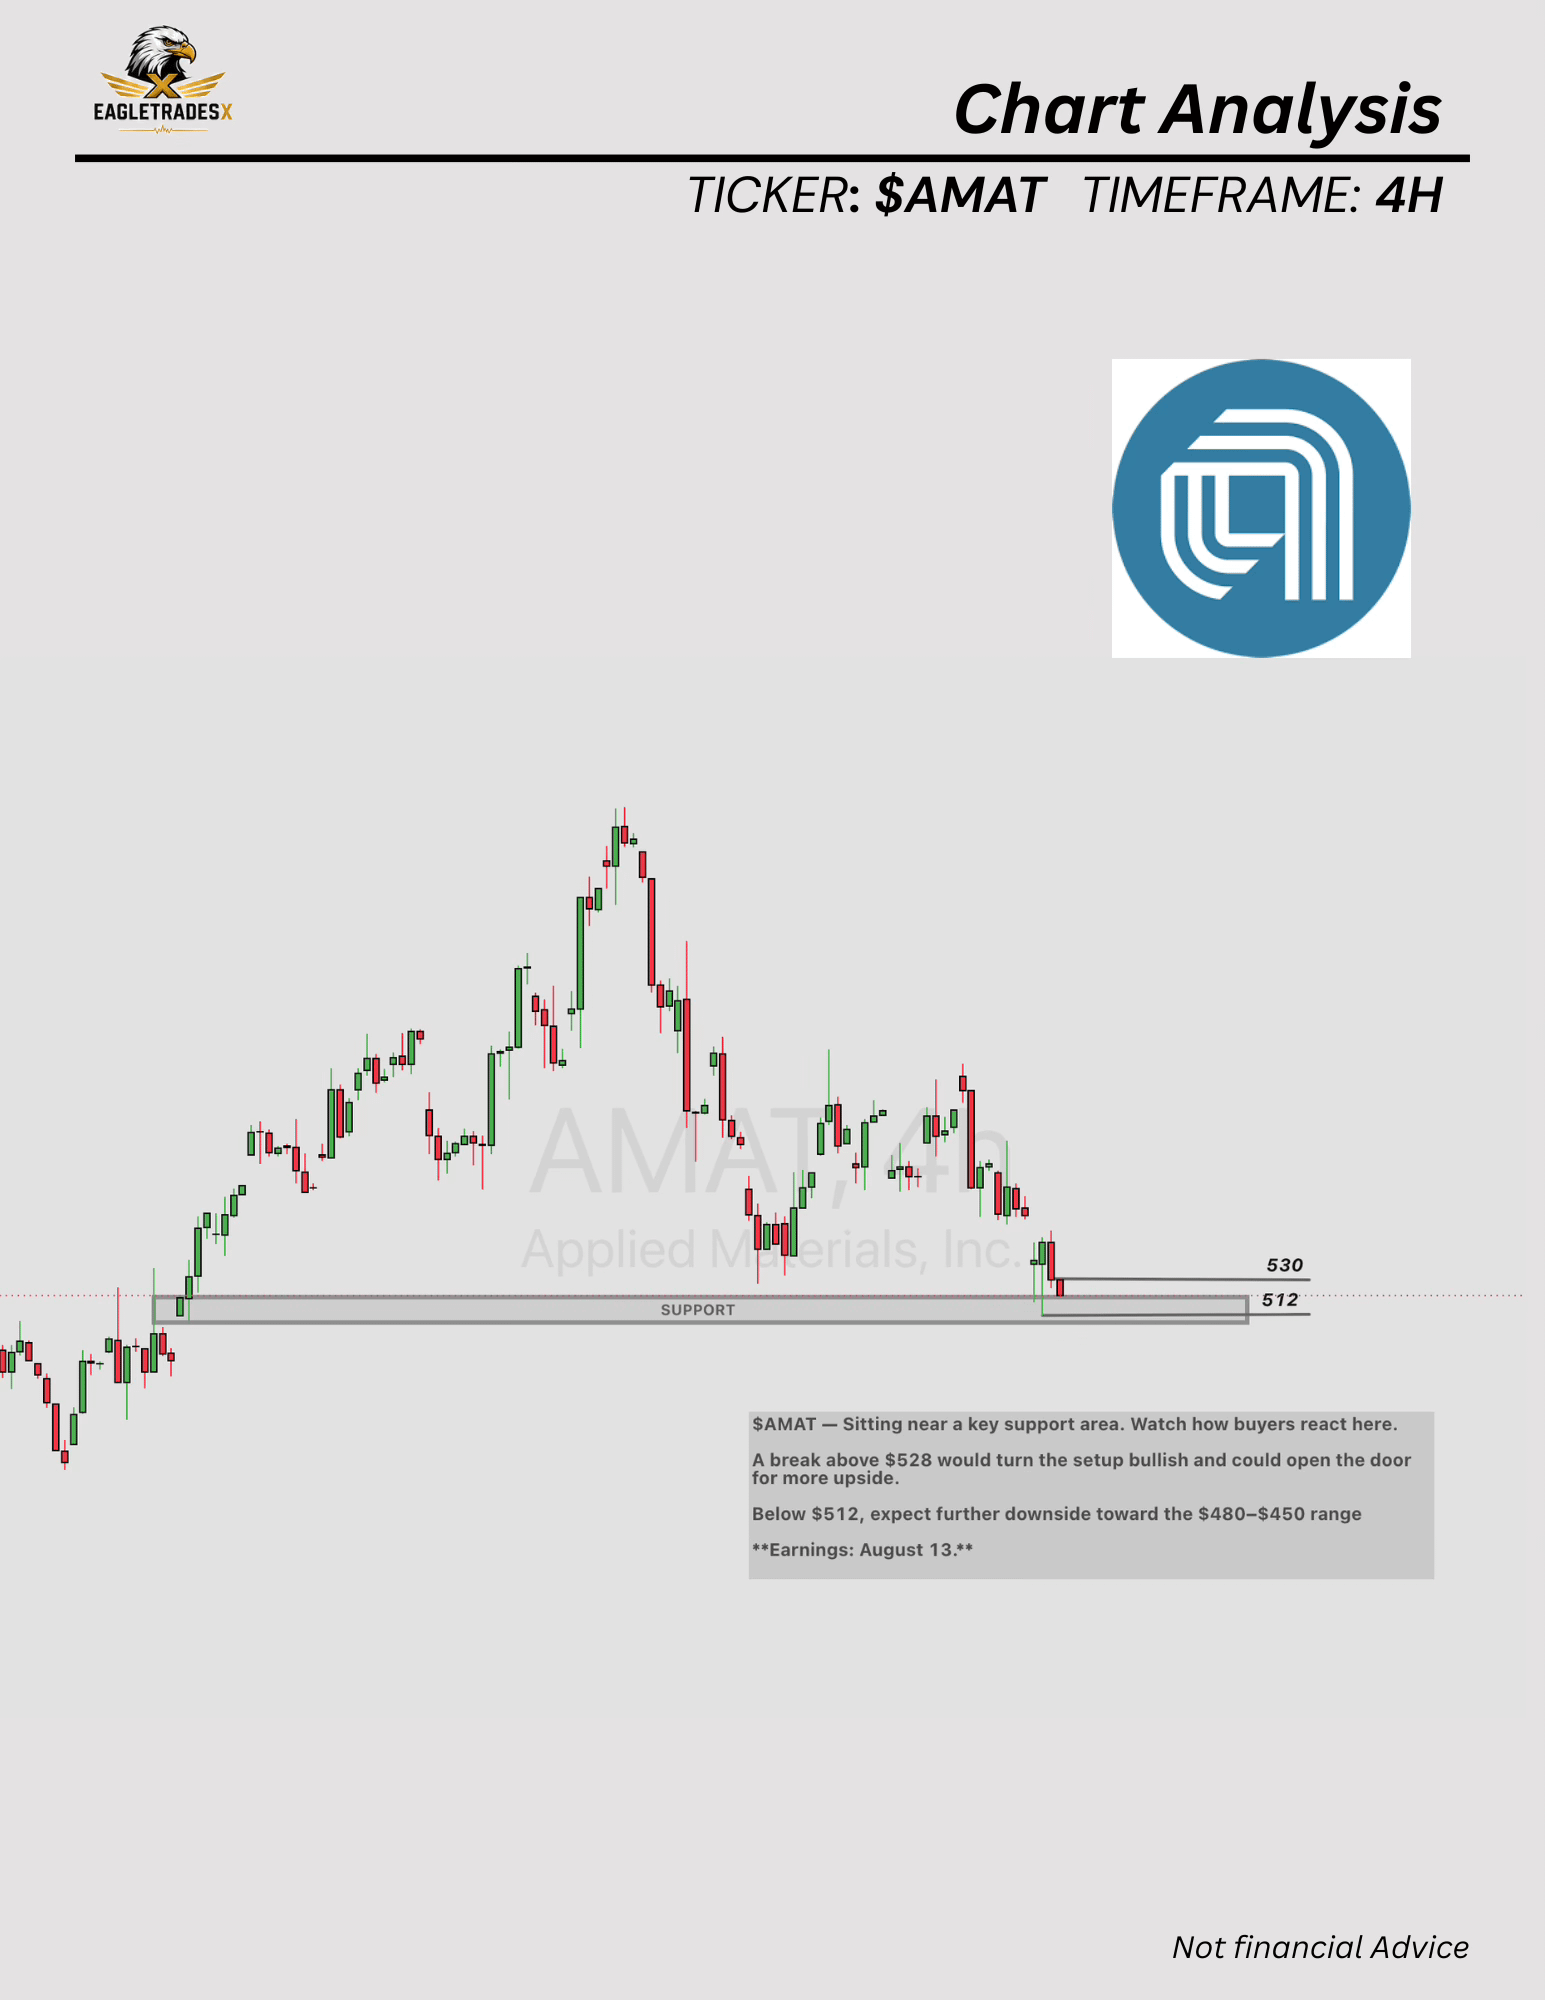
For daily watchlists, updated levels and new chart breakdowns throughout the week, follow EagleTradesX on Instagram:
@EagleTradesX
These weekend charts will be updated as price confirms or invalidates the original setup.
If this analysis helped, subscribe to the newsletter and share it with another trader who needs a plan before Monday’s open.
Educational content only. This newsletter is not financial advice or a recommendation to buy or sell any security. Options involve substantial risk and can result in the loss of the entire investment.
No posts
Comments
Nothing yet. Say the first thing.
Sign in to join the conversation.