
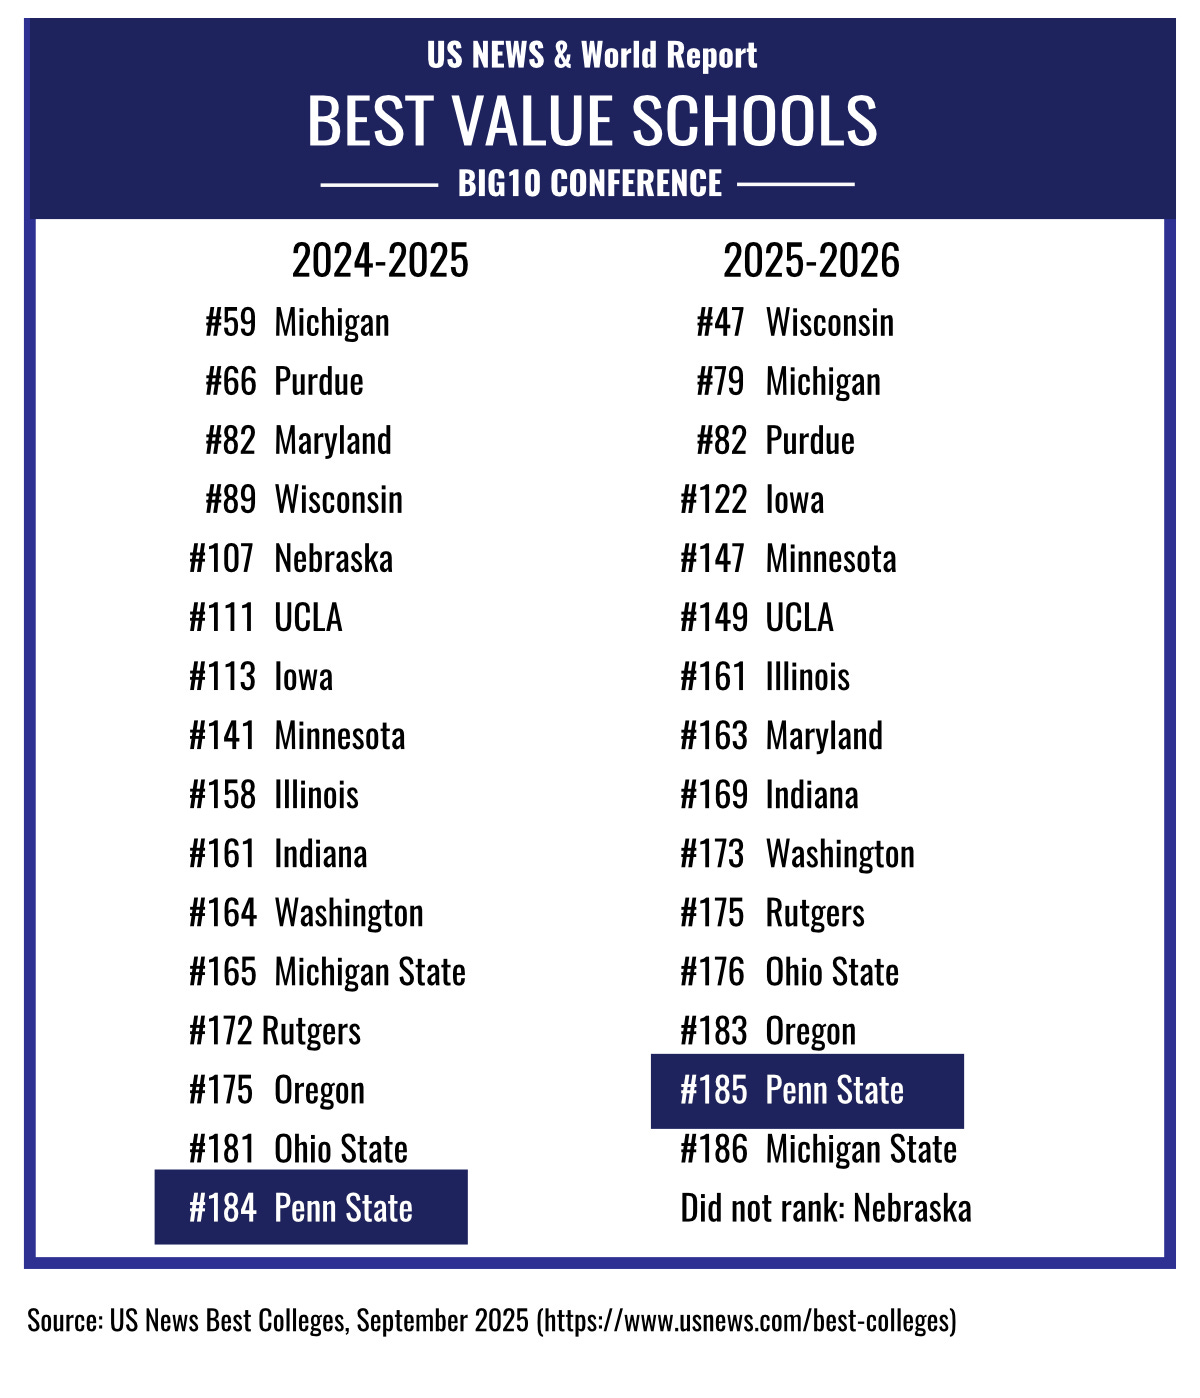
Yesterday, the 2026 edition of the U.S. News & World Report Best Colleges rankings were published and once again Penn State is at the bottom of the pack in the most important metric: Value. This year, Penn State (#185) rates next-to-last among the sixteen Big10 Conference public schools, one spot above last place Michigan State (#186) (Northwestern University and University of Southern California are private).
The Best Value Schools are the universities and colleges that demonstrate high academic quality relative to their cost (after financial aid), also known as ‘bang for the buck’. The Value ranking is frequently cited as the number one metric high school seniors consider when making a final commitment to a university.
Thanks for reading Barry Fenchak For Penn State Trustee! Subscribe for free to receive new posts and support my work.
In Penn State’s case, it’s important to note that University Park is the only campus ranked in the Value metric. Penn State does not include Commonwealth Campuses in its reporting, although all campuses fall under one accreditation. If included, their subpar graduation rates would sink the Value ranking even lower.
How the Rankings Are Determined
Academic quality vs. price (50%): measures a school’s overall quality, as determined by its score in the U.S. News Best Colleges rankings, relative to the actual cost for students with need. Each school receives a 0-100 overall score in the main rankings. This score is divided by a net cost, calculated as total expenses (tuition, fees, food, housing, books, transportation and personal expenses) minus the amount of a school’s average need-based scholarship and grant for students with need.
Percentage of students receiving aid (20%): measures the percentage of all students who receive need-based scholarships or grants. The more students who receive this type of aid, the better the school’s score.
Grant and scholarship aid (20%): Evaluates how much of a school’s need-based financial aid is provided as grants and scholarships, which do not have to be repaid. A school must have awarded need-based aid to at least 10% of its full-time undergraduates to be scored on this ranking factor.
Average discount (10%): measures the average percentage of a school’s total cost that is covered by need-based scholarships, like Pell Grants and other support. A higher discount percentage leads to a better score.
Why is Penn State’s Value ranking so low?
Penn State has consistently ranked near the bottom of the Value list for over the last five years, driven by the highest net cost among our peers, plummeting standardized test scores, and the lowest need-based aid in the Big10. The Big10 public schools also outperform Penn State because of their ability to control costs, lower net costs for students (from low tuition or generous aid packages), and stronger social mobility metrics for low-income/Pell students.
It is important to note that the Value ranking favors schools with strong Pell graduation rates and low debt (like the University of Michigan and Purdue). Penn State’s abandonment of underserved, middle-class, and low-income students, who disproportionately attend Commonwealth Campuses, sinks its Value ranking.
What is Penn State doing wrong?
Penn State’s struggles stem from policy choices that show the administration cannot control net costs and refuse to boost aid. Also, as reported in this year’s ranking data:
High (and rising) tuition: In-state tuition rose 2% for 2025–26 (to $20,644), out-of-state 4% (to $41,790) for the fifth straight year.
Less Generous Need-Based Aid: Penn State provides the lowest level of need-based aid in the Big Ten, $3,417 per eligible student, less than half of the Big10 public school average of $7,059. And fewer and fewer students qualify for any aid at all, as Penn State has largely priced out middle-income students.
Pell graduation rate: Penn State (63%) trails Big10 averages (75–80%), signaling weaker support for low-income students.
Elevated Student Debt: The average amount of Federal loan debt carried by Penn State graduates is $48,037, the highest in the Big10 and nearly double the average of $28,272.
Equity Gaps: Penn State’s social mobility ranking, a measure reflecting a university’s ability to elevate disadvantaged students through an affordable and quality education is, unsurprisingly, near the bottom —16th in the Big10 and 321st among national universities.
How can Penn State improve?
Penn State could vastly expand need-based aid via the Endowment, now at $4.9 billion, or cap tuition hikes across the board. USNews’s increased emphasis on recognizing schools that give powerful support to low-income students, which results in higher graduation rates, hurts Penn State. A disproportionate majority of Pell Grant recipients attend a Commonwealth Campus, and Penn State’s Value ranking would be much lower if it included the graduation rates of Commonwealth Campus students:
There are ZERO Commonwealth Campuses where Pell Grant students have a 50% or better chance of graduating in 4 years.
There are only 3 Commonwealth campuses where Pell Grant students have a 60% or better chance of graduating in 6 years.
At Penn State Harrisburg, which has the best 6-year graduation rate, 32% of Pell Grant students do not have a degree after 6 years. But they still have the accrued debt.

What’s the bottom line?
Evidence clearly shows that even a modest increase in grants to underserved students greatly increases their chances of graduating in six years. Penn State knows this, but has stubbornly refused to prioritize these students success.
It is a fact that budgets show priorities, and Penn State’s reveals theirs:
All the flowery prose and aspirational goals of affordability, student success, and inclusion can be replaced with one phrase: Let them eat grilled stickies.
As a former Penn State alumni-elected trustee, I enjoy sharing my personal observations, concerns, and ideas about Penn State. I invite you to contact me with your opinions so that we can engage in meaningful conversations on those topics: barry@barryfenchak.com.
Thanks for reading Barry Fenchak For Penn State Trustee! Subscribe for free to receive new posts and support my work.
Comments
Nothing yet. Say the first thing.
Sign in to join the conversation.