
Affiliate Disclosure: This post contains affiliate links. As an Amazon Associate and being a part of the eBay Partner Network (and other programs), if you follow these links and make a purchase, I’ll receive a commission (at no cost to you). I appreciate your support!
This is not buying or investment advice. I’m simply reporting the data I’m seeing. Please do your own research and make your own decisions. Just because cards have increased in value up to this point, it doesn’t mean they will continue to do so.
I’m getting all of this data from either the Market Movers or Card Hedge platform. These are not my platforms, I’m simply a user and affiliate of them. If you want to do your own research, you can grab a free trial to Market Movers with code BALLCARDGENIUS. You’d also get 20% off of your membership forever if you wanted to continue once your trial has been completed. You can also grab a free trial for Card Hedge as well.
These tools aren’t perfect; no tool is. I’ve seen instances where a graded card was being included in the raw numbers, which might cause a misleading spike in value. So trust, but verify.
I check Market Movers info on a daily basis.
It’s a great starting point and a fast way to see what’s getting hot before anyone else notices.
You see the results of my checks in my Hot Card Reports.
But with baseball season winding down and other sports picking up, it’s a great time to look deeper, not only at other types of cards, but also at the way we interpret the data.
Here’s the problem with trying to use Market Movers’ Card Movements right out of the box:
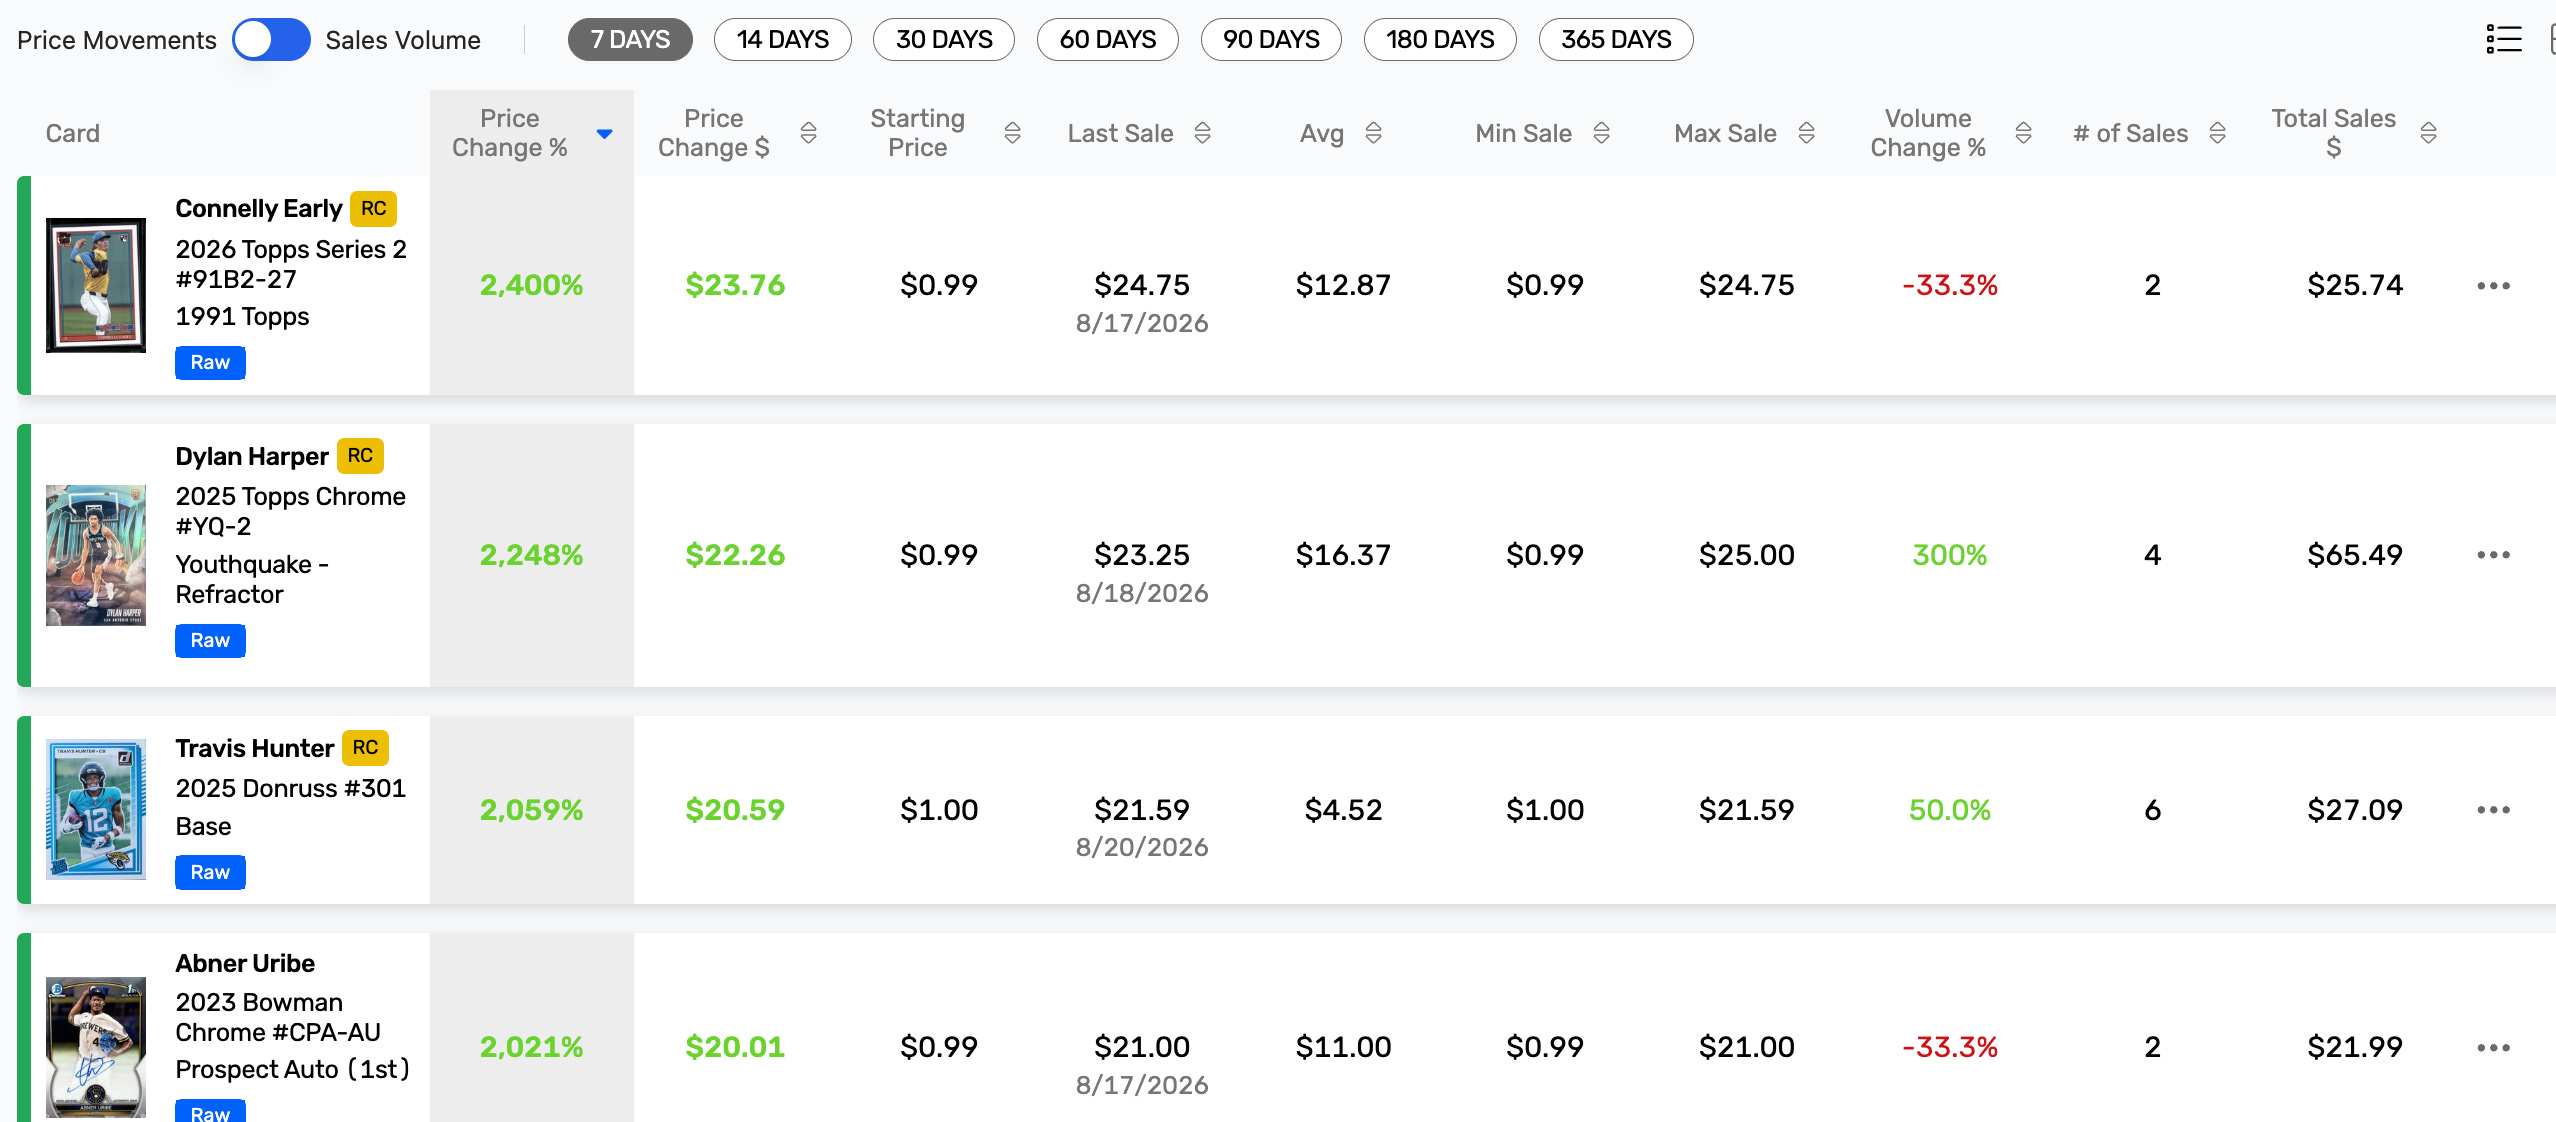
Without any filtering, you’ll see a 2026 Topps Connely Early card as the top riser over the last 7 days, starting that 7-day period at $.99 and “growing” 2,400% thanks to a last sale of $24.75. And because there were two sales over that period, the average is sitting at $12.87.
Thus…
A raw percentage change only tells you part of the story, and it’s often misleading.
How could the above be mitigated?
Filtering helps, but only a little.
When I check Market Movers, I like to apply something like a a ‘Last Sale’ filter with a minimum of $10 to weed out the low-value cards and a “Number of Sales” filter of 10 to weed out “one-off” sales.
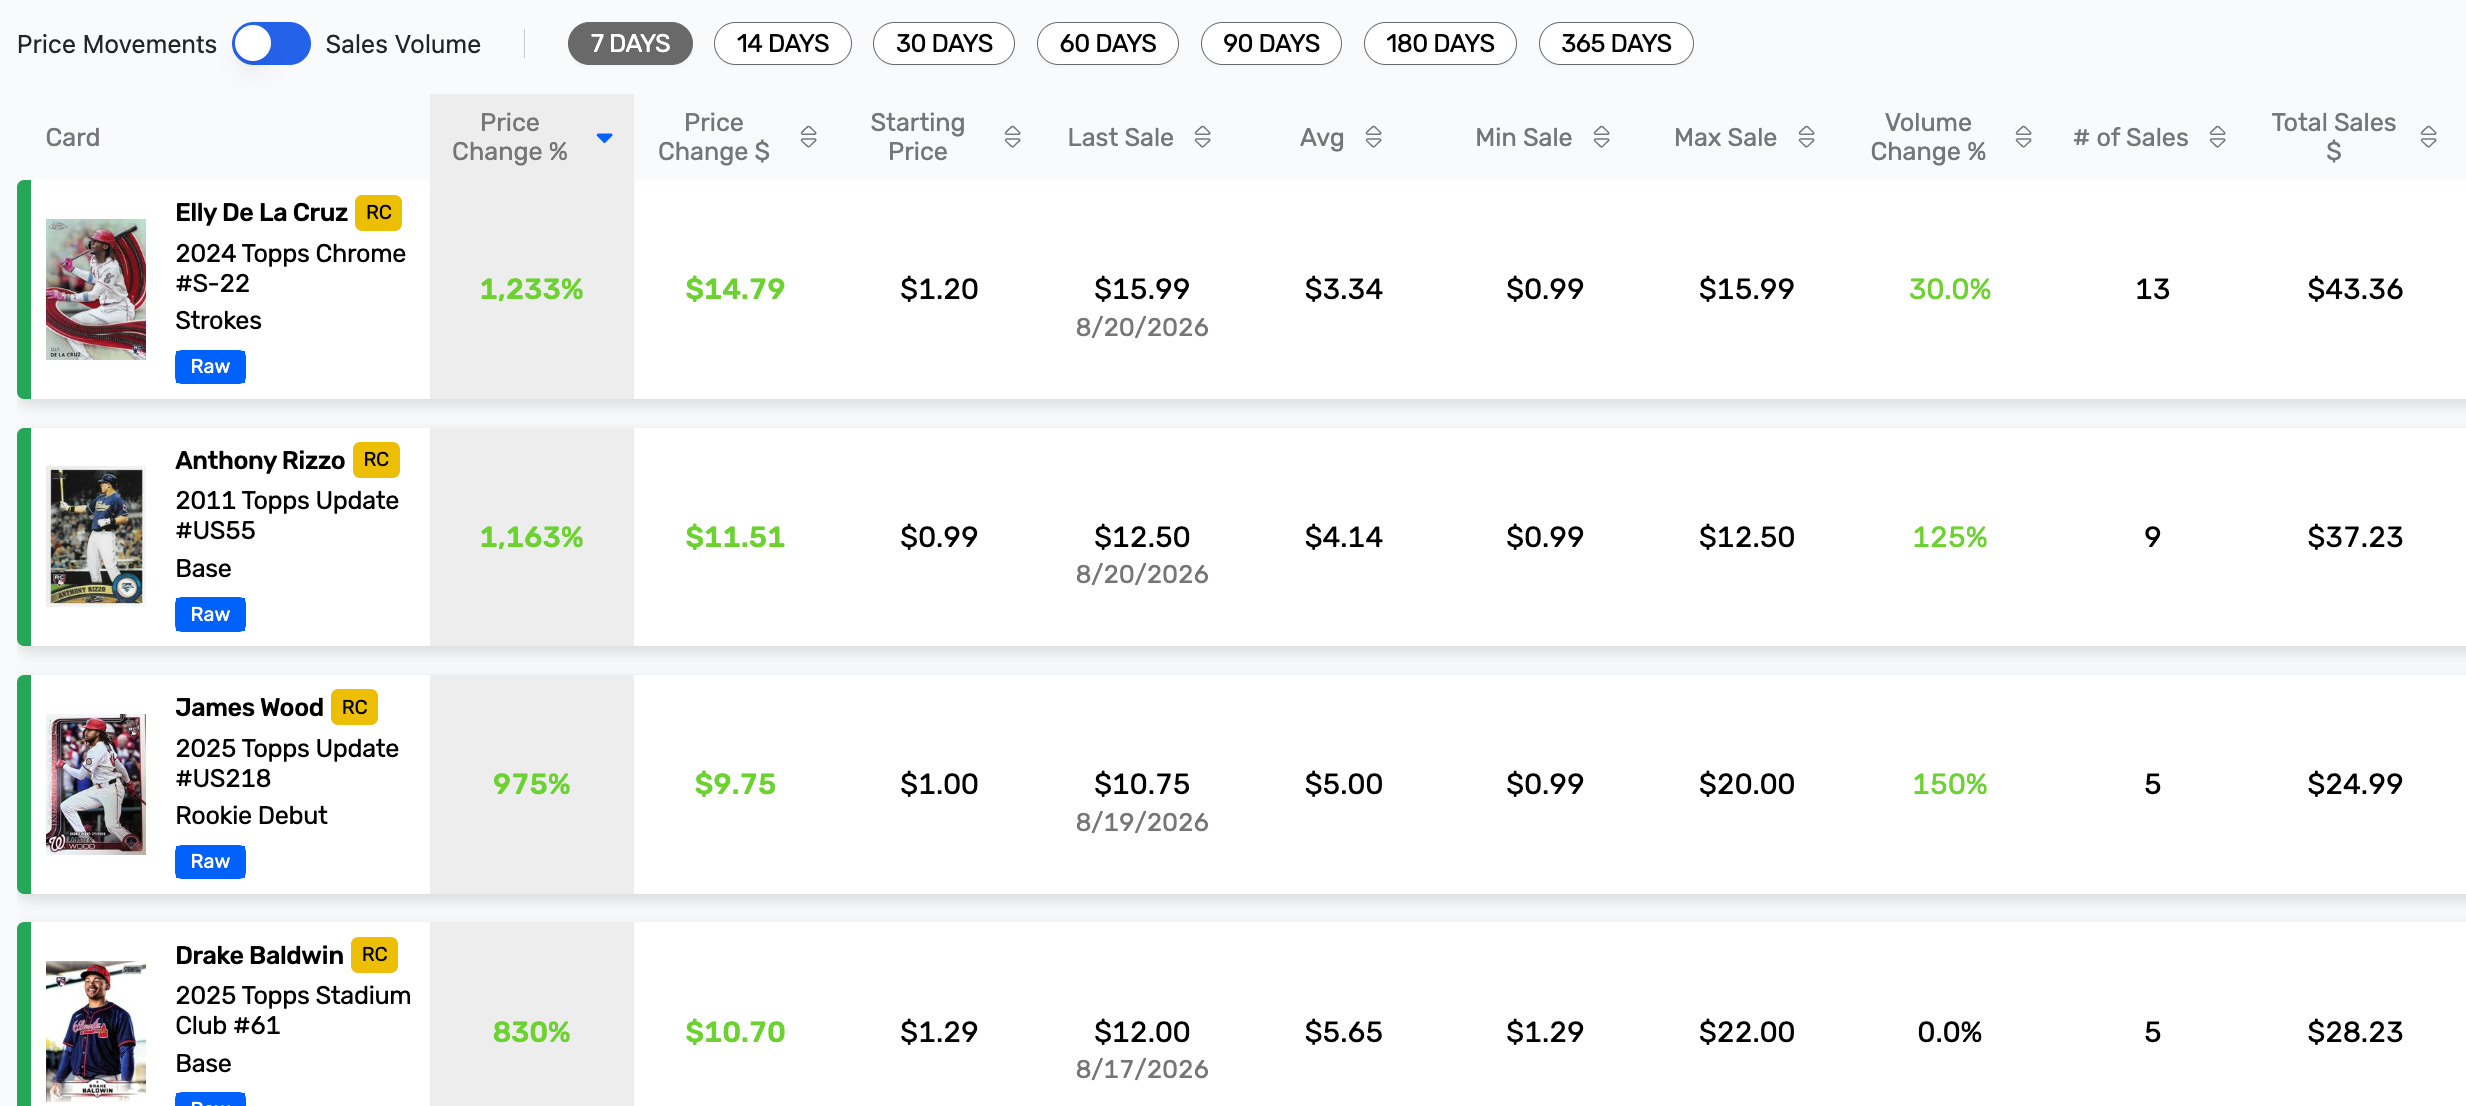
Better, but still not perfect.
A percentage change is calculated from two data points: where a card started, and where it landed.
That’s useful, but it means a few different situations can all produce the same eye-catching number.
Sometimes a card’s big percentage gain comes down to one buyer paying a premium for it once or even an error in the data. So, it might be a real sale or it might not, but either way, it’s not a sign the whole market moved.
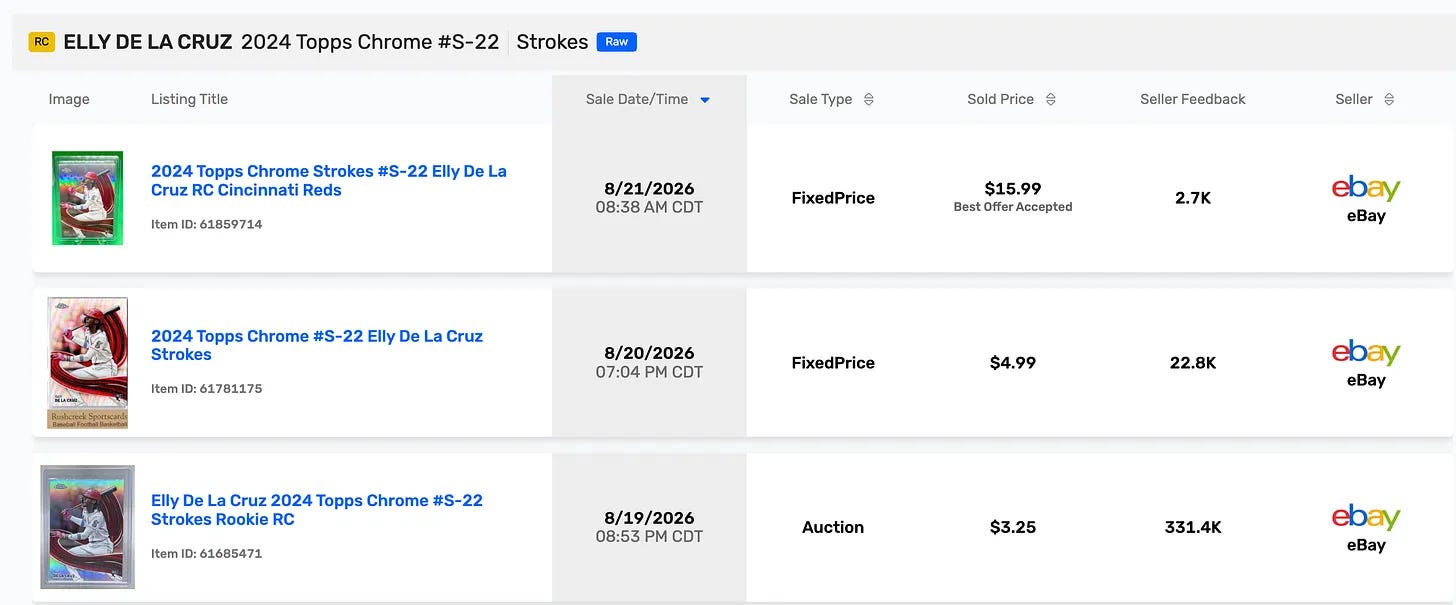
Elly De La Cruz’s 2024 Topps Chrome Strokes card tops the gainers list above at +1,233%, and that number traced back to a single $15.99 sale on a card that typically moves for around $3.34.
Market Movers says the sale happened, but it clearly wasn’t representative of the broader market.
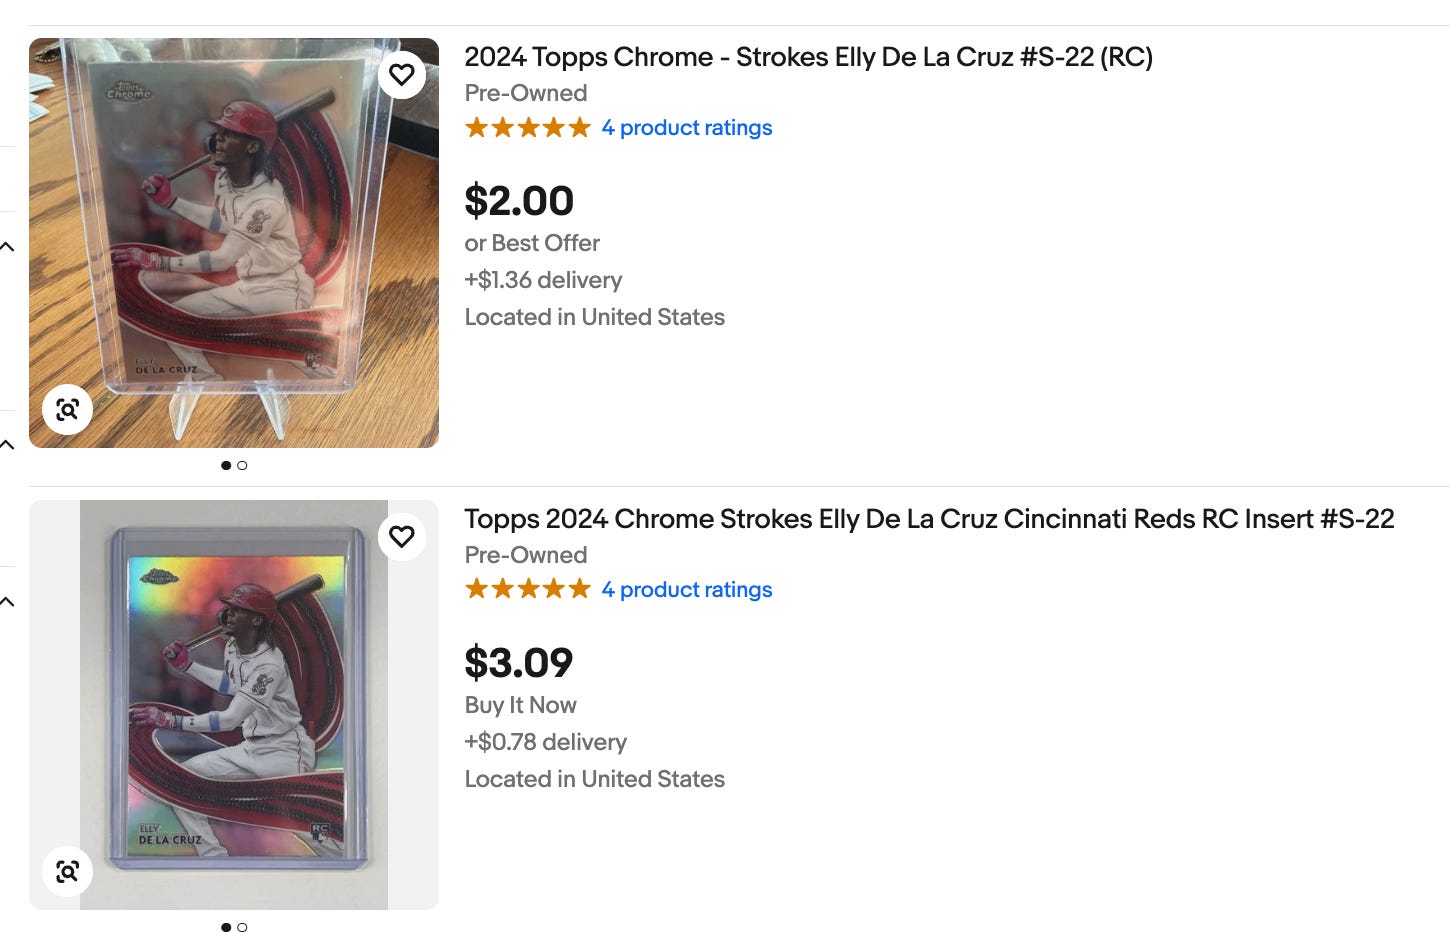
You can easily confirm this by checking current listings on eBay, where the card can be purchased right now for a couple bucks.
Again, remember we are looking at data windows. If the price comparison at the beginning of that window starts from an unusually cheap sale, even a modest recovery can look like a huge percentage jump.
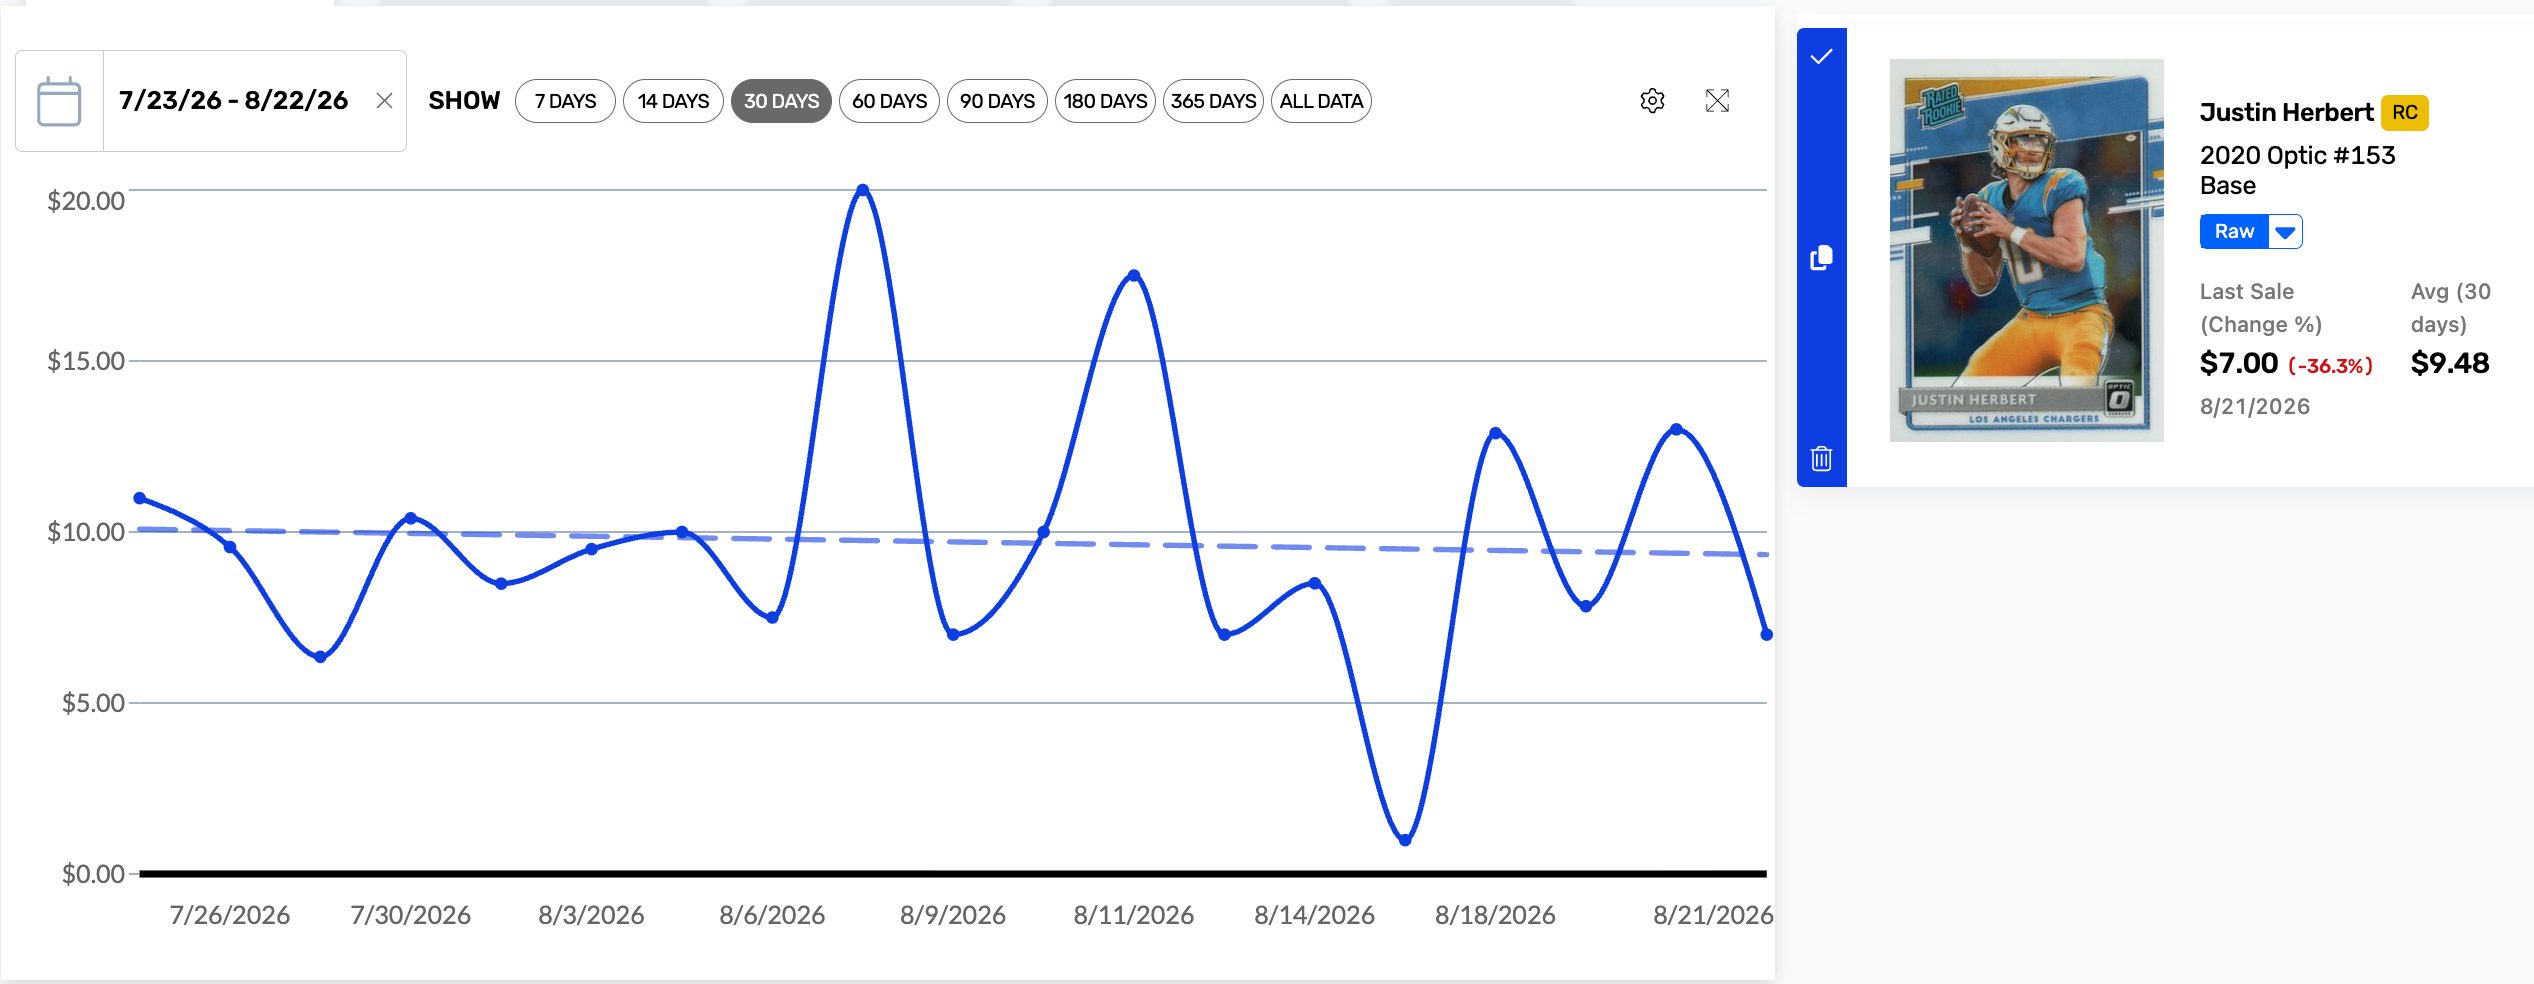
This is why Justin Herbert’s 2020 Optic base card can show up as a “+607%” mover over 7 days…
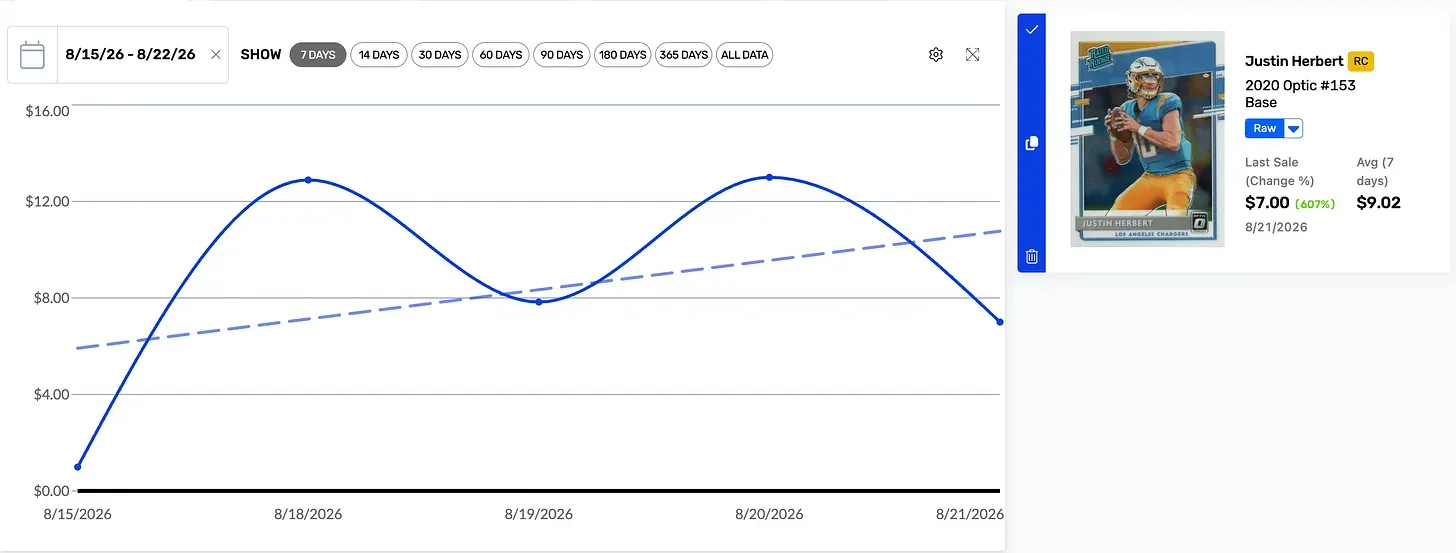
While providing a much different take when you zoom out to 30:
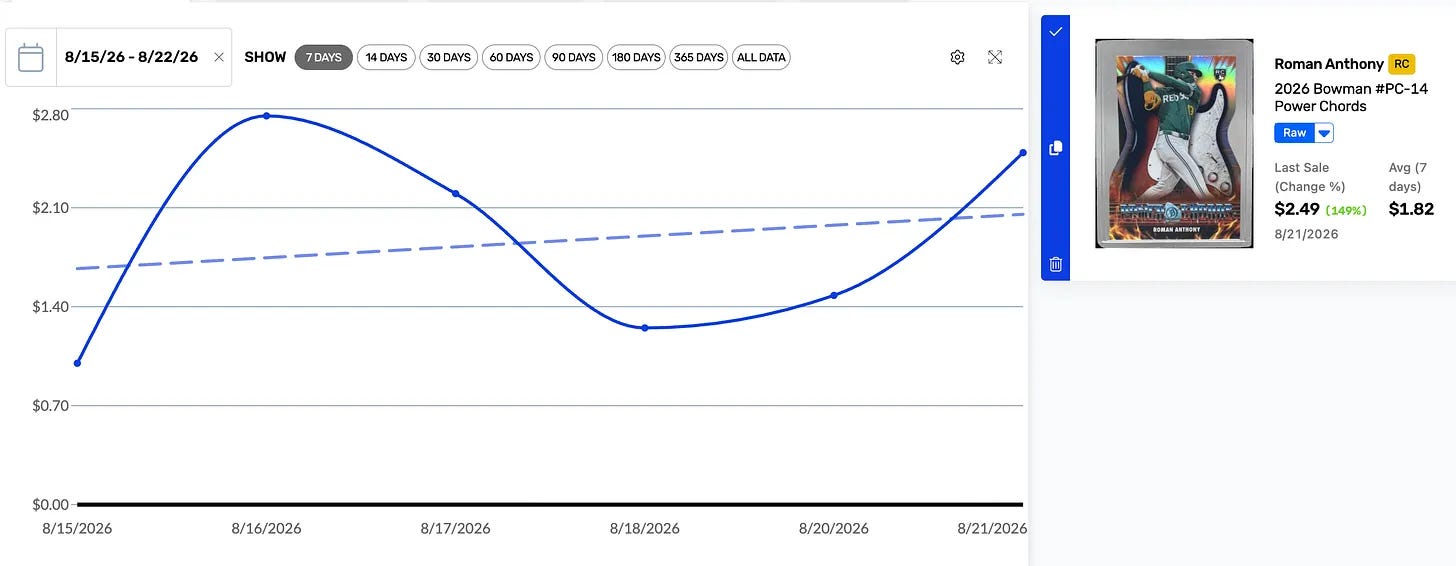
A card going from $1.00 to $2.49 is a “149% gain”—technically true, but not very actionable.
A Roman Anthony 2026 Bowman parallel shows a real gain on real sales, but it’s a small enough dollar move ($1.49) that it’s not worth reading much into.
Everyone has access to data, but only a few will use it in a way that makes sense. Just like everyone has access to CollX but only a few will actually find the flips.
To help make Market Movers reports more actionable, I put together a simple filter that runs every card through a series of checks before I call it a genuine trend.
It basically asks the questions:
Does the top sale make sense relative to the average?
Is the starting comp representative?
Is volume actually rising?
Is there real money behind the move?
Here’s exactly what the sheet checks on every card, in plain terms:
Comments
Nothing yet. Say the first thing.
Sign in to join the conversation.