

Each section below shows a common myth followed by a brief analysis of why it isn’t a causal relationship with a market trend. Recessions and bear markets are both used in the analysis - while they are not exactly the same thing, they can both be used to show where a theory is predictive of negative outcomes or not.
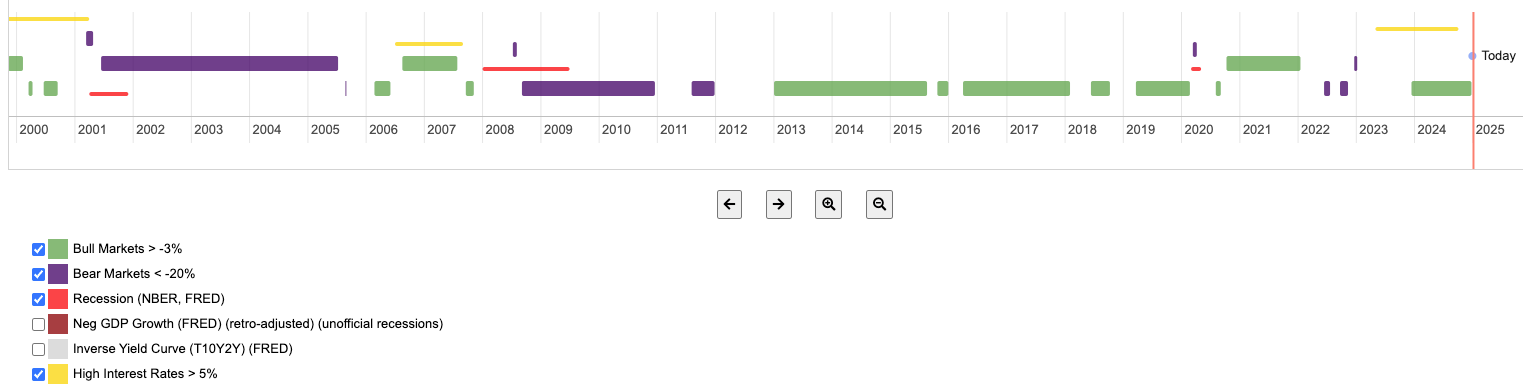
“High interest rates make it more difficult to borrow money to invest, and increase the cost of current operations.”
We would expect high rates (>5%) to immediately precede bear markets or recessions, and no instances of high rates coinciding with bull markets. In 2001 it was true, in 2007 there was almost a year delay until the bear market hit, the bear market of 2020 had no high interest rates near it, and the same in 2022. In 2024 there was high interest and a very strong bull market. This does not conform to predictions.
Conclusion: No Causal Link
* How to read the chart: X-axis = time. Y-axis means nothing. The only thing these charts show is when certain criteria occurred (e.g. high interest rates), relative to when other criteria occurred (e.g. bear market).
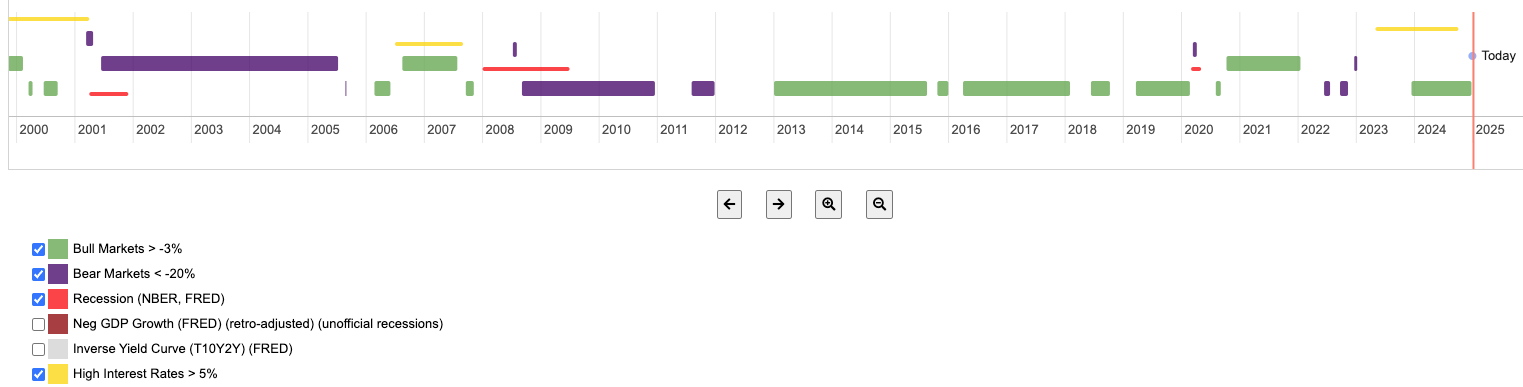
Similar to the previous theory, we would expect no cases of a bear market when interest rates are low, and no cases of a bull market when interest rates are high. 2001-2005 had low rates and a bear market. Same thing with 2008-2010. In both 2006-2007 and 2023-2024 there where bull markets coinciding with high rates.
Conclusion: No Causal Link
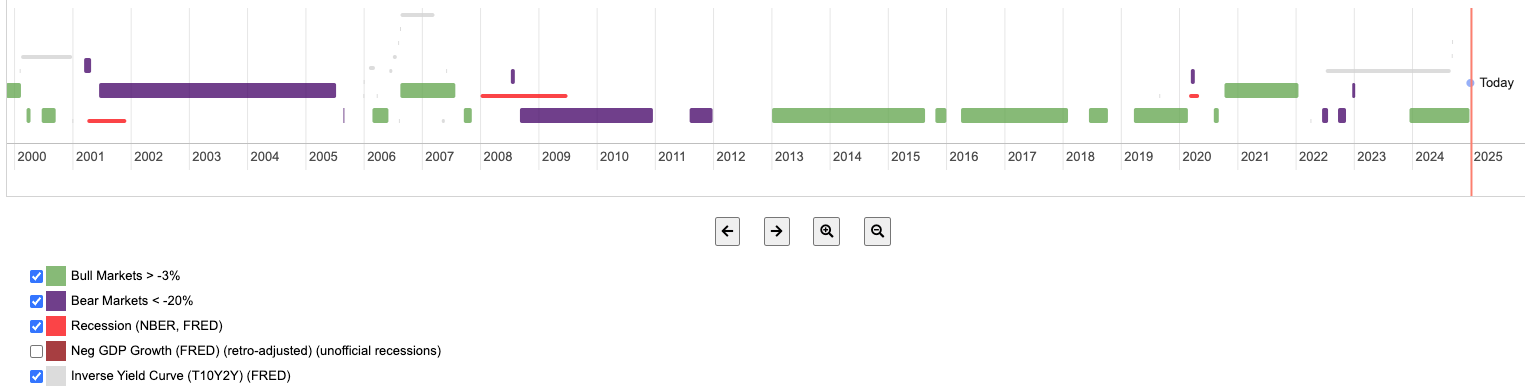
“A yield curve inversion occurs when short-term interest rates exceed long-term rates, signaling that investors expect weaker economic growth and lower rates in the future. This often reflects tighter monetary policy or reduced lending, which can slow the economy and lead to a recession.”
In 2000 the yield curve inversion occurred for a while during a bull market, and then a bear market followed (after a year). In 2006 there was 6 months of bull market following it before a bear market happened. In 2022 it started in a bear market and extended into a strong bull market. The bear markets in 2020 and 2022 did not have an inversion prior to them occurring. Not shown in the chart, but in 1989 it took 1.5 yrs for a recession to occur (but not a bear market). In 1998 there was in inversion that was not followed by either a recession or bear market. The theory is occasionally correct, but sometimes the prediction only happens after a year or more, and sometimes it never occurs prior to the bear market. Every theory can be right by chance occasionally, but it needs to reliably true to be a good predictor. For some reason there continues to be many investing articles perpetuating this myth.
Conclusion: No Causal Link
Predictions of downturns and upturns:

Historical data:
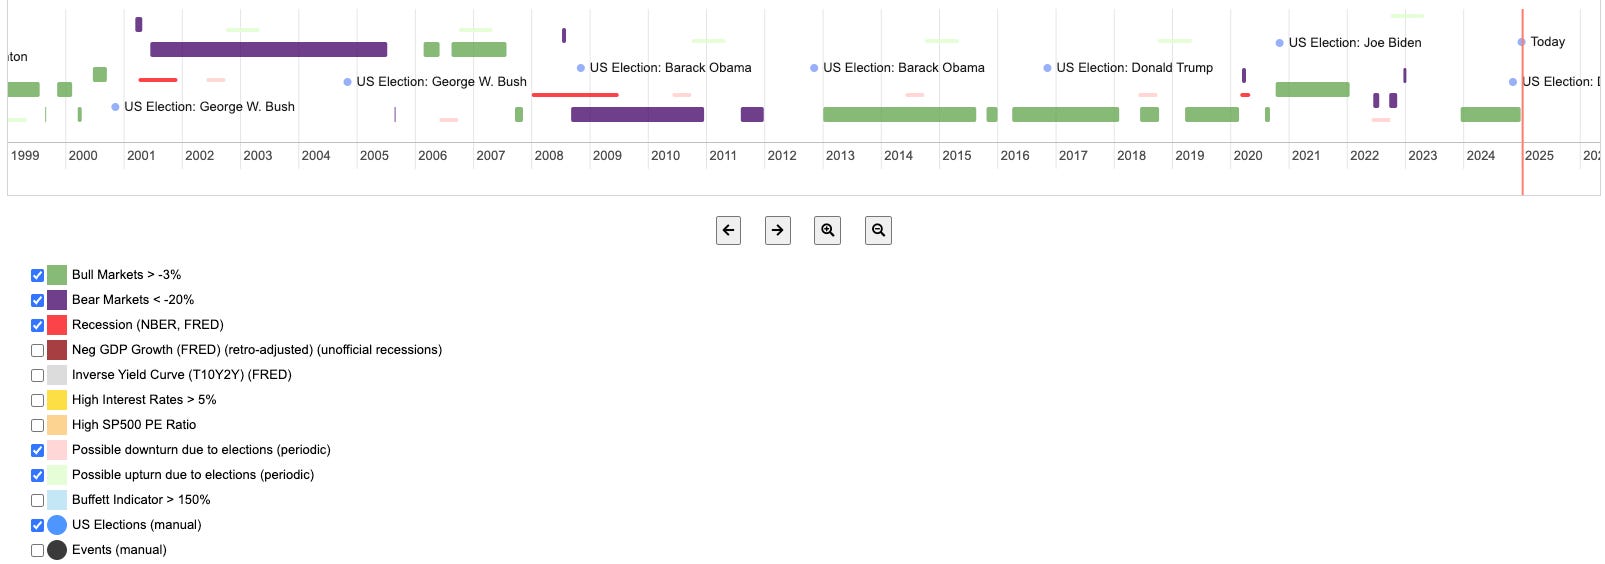
There is a theory that every four years there is a cycle of up-market or down-market at certain times preceding the election. Possible downturns (pink) are supposed to occur roughly 1.5 years after the election. The upturns are supposed to occur just after that (around the 2-year mark).
As you can see from the chart, the pink regions do not reliably coincide with bear markets or recessions and seem to be roughly 50/50. The green marks are also about 50/50 on up-markets or down-markets.
Conclusion: No Causal Link

It is often said or thought that Republican policy or leadership is better for the economy or stock market growth. Also, it is often presumed that the moment a president takes office, the stock market reacts, but in reality policies are set in place over the course of 4-8 years and may often take a year or two to take effect.
Given this we need to look at either a Republican president, or Democratic president, and probably look at roughly a 2-year delay to see effects.
Republican: George W. Bush inherited a bull market. He had both a bear market and a bull market during his 8 years.
Democrat: Obama inherited a bear market which started just before he became president. His second term was a bull market.
Republican: Trump inherited a bull market, which was maintained throughout his presidency.
Democrat: Biden inherited a bull market, and then there was a bear market and then a bull market during his term.
Republican: Trump is again inheriting a bull market.
Summary: Both Republicans and Democrats have recently had bear and bull markets. Even after allowing for “time to change policies and turn it around” there doesn’t seem to be a strong pattern of either party being able to reliably avoid downturns. The reality is that there are probably many other more significant factors at play, and that people just attribute a causal relationship between the current leader and the current stock market performance because they both occur at the same time.
Conclusion: No Causal Link

It is possible there might be very small rallies around the holidays, but these would only be of interest to day-traders. In terms of bull and bear markets, they have absolutely nothing to do with the end of December. Bull markets have started at other times of the year and run for many consecutive years without serious downturns.
Conclusion: No Causal Link
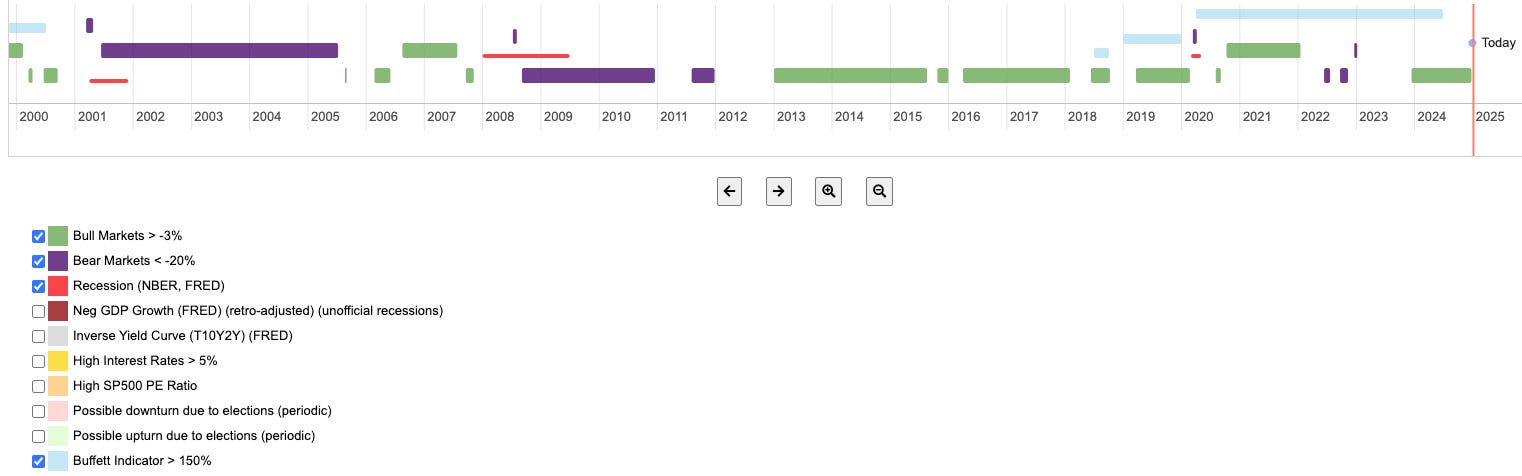
This ratio compares the total market capitalization of publicly traded U.S. stocks (Wilshire 5000 Index) to the country's gross domestic product (GDP). A higher ratio suggests that the stock market is overvalued relative to the economy, while a lower ratio implies undervaluation. Over 150% is generally considered high.
In 2000 it was high and there was a recession and bear market following it, which is probably why it was assumed to be a valid theory to Buffett. However, the bear market of 2008 did not have a high Buffett indication prior to it, as one would expect. More recently the indicator was high from roughly 2018-2024 with multiple bull and bear markets during that period, which does not make it a reliable predictor.
Conclusion: No Causal Link
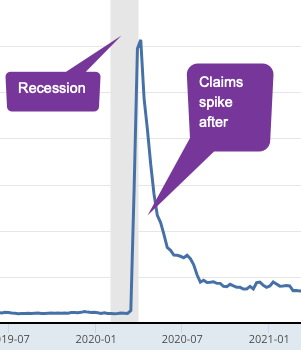
“A persistent rise in initial claims often warns of an impending recession.”
It seems more likely that recessions cause companies to contract and do layoffs, which results in jobless claims. The charts show spikes after the recession has started, and this is true of the last four recessions. See FRED Initial Claims chart (gray = recession).
Conclusion: No Causal Link or Inverse Causality
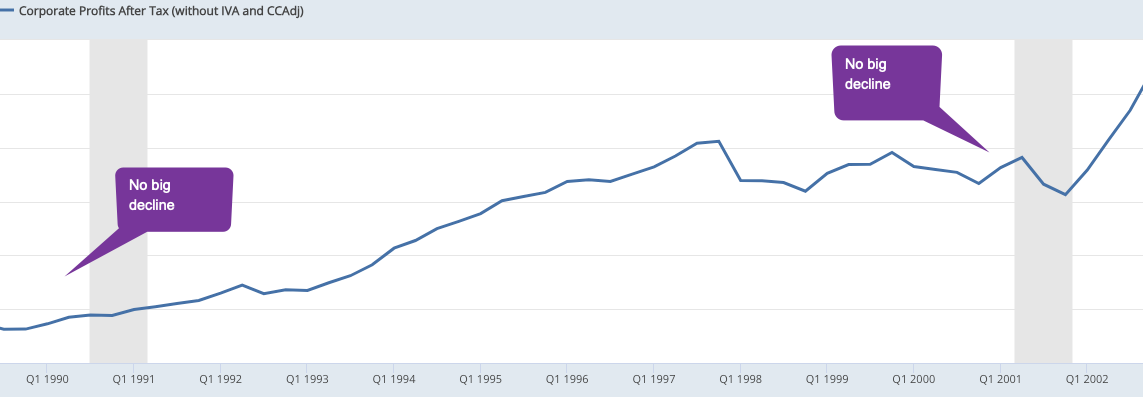
“Broad declines in corporate earnings tend to precede market drops.”
There doesn’t appear to be big declines prior to recessions.
Corporate Profits After Tax (without IVA and CCAdj) - Chart
Conclusion: No Causal Link
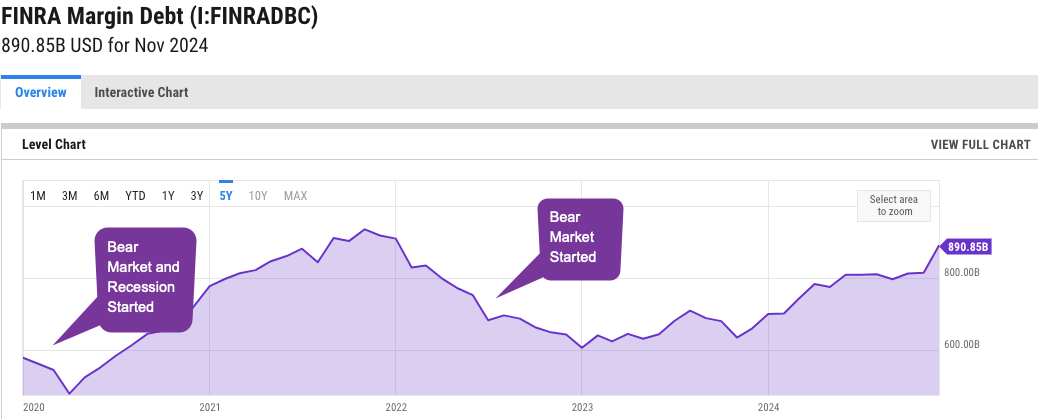
“Rapid increases (and subsequent forced selling) can signal overstretched markets.”
A quick glance at the margin debt chart shows that there were no sharp increases happening when bear markets started. YCharts | Finra
Conclusion: No Causal Link
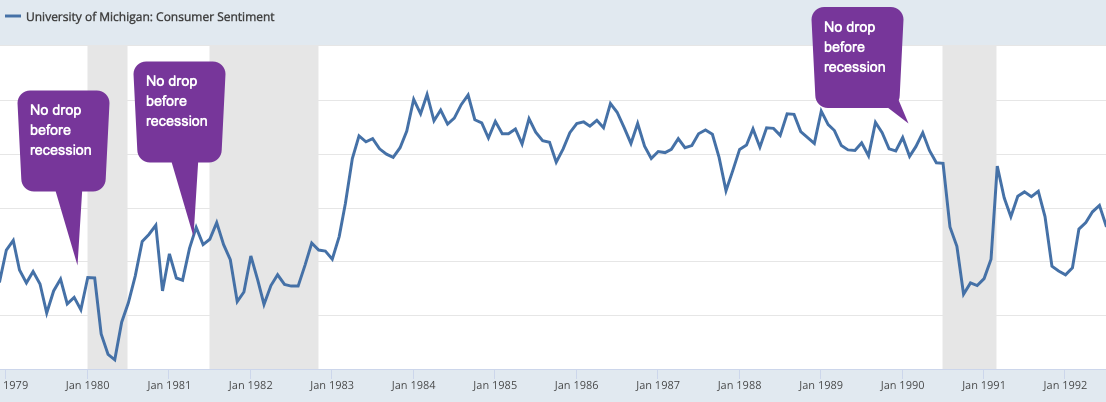
“When consumer sentiment falls sharply, spending tends to drop—a negative for economic growth.”
Some of the older examples show no big drops prior to recessions. Some more recent examples show slight correlation. What seems to be more clear is that sentiment is lower during a recession - which would be expected.
University of Michigan: Consumer Sentiment (UMCSENT) - Chart
Conclusion: No Causal Link or Inverse Causality
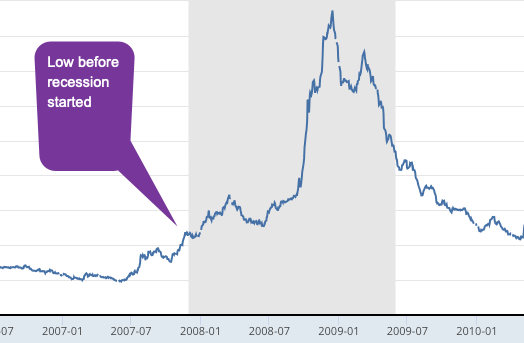
“Widening credit spreads often precede economic slowdowns and market downturns.”
Larger credit spreads are not predictive of the start of a recession, as shown in the graph. In some cases it is high towards the end of a recession, indicating that the recession might cause the widening credit spread. There have also been cases where it was “high” but no recession occurred (2003, 2012, 2016).
See ICE BofA US High Yield Index Option-Adjusted Spread (BAMLH0A0HYM2) - Chart (gray = recession)
Conclusion: No Causal Link, or Inverse Causality
Most of the so-called predictors of when recessions will occur and what causes up-markets are not valid.
Why do these myths persist?
Click-bait
Memetic fitness (false memes can still have high fitness)
Fear
Desire for simple investing patterns to follow.
Desire to have a “this might happen” or “could this be coming?” story to publish.
Lack of desire to scientifically test investing hypotheses or theories.
Humanity seems to have an addiction for “end of the world” stories, and recession-mongering plays into that human need.
So is there a valid predictor of stock market downturns?
Yes. I’ll think about writing an article about it if I get enough comments.
△ Photo credit: AI-generated by Flux Pro
Disclaimer: I do not hold any financial degrees or certifications. I am not a tax advisor. Your investment decisions are your own, and it is best to test strategies with small amounts of money first, preferably after extensive back-testing. Question the dogma and discover the facts for yourself.
No posts
Comments
Nothing yet. Say the first thing.
Sign in to join the conversation.