
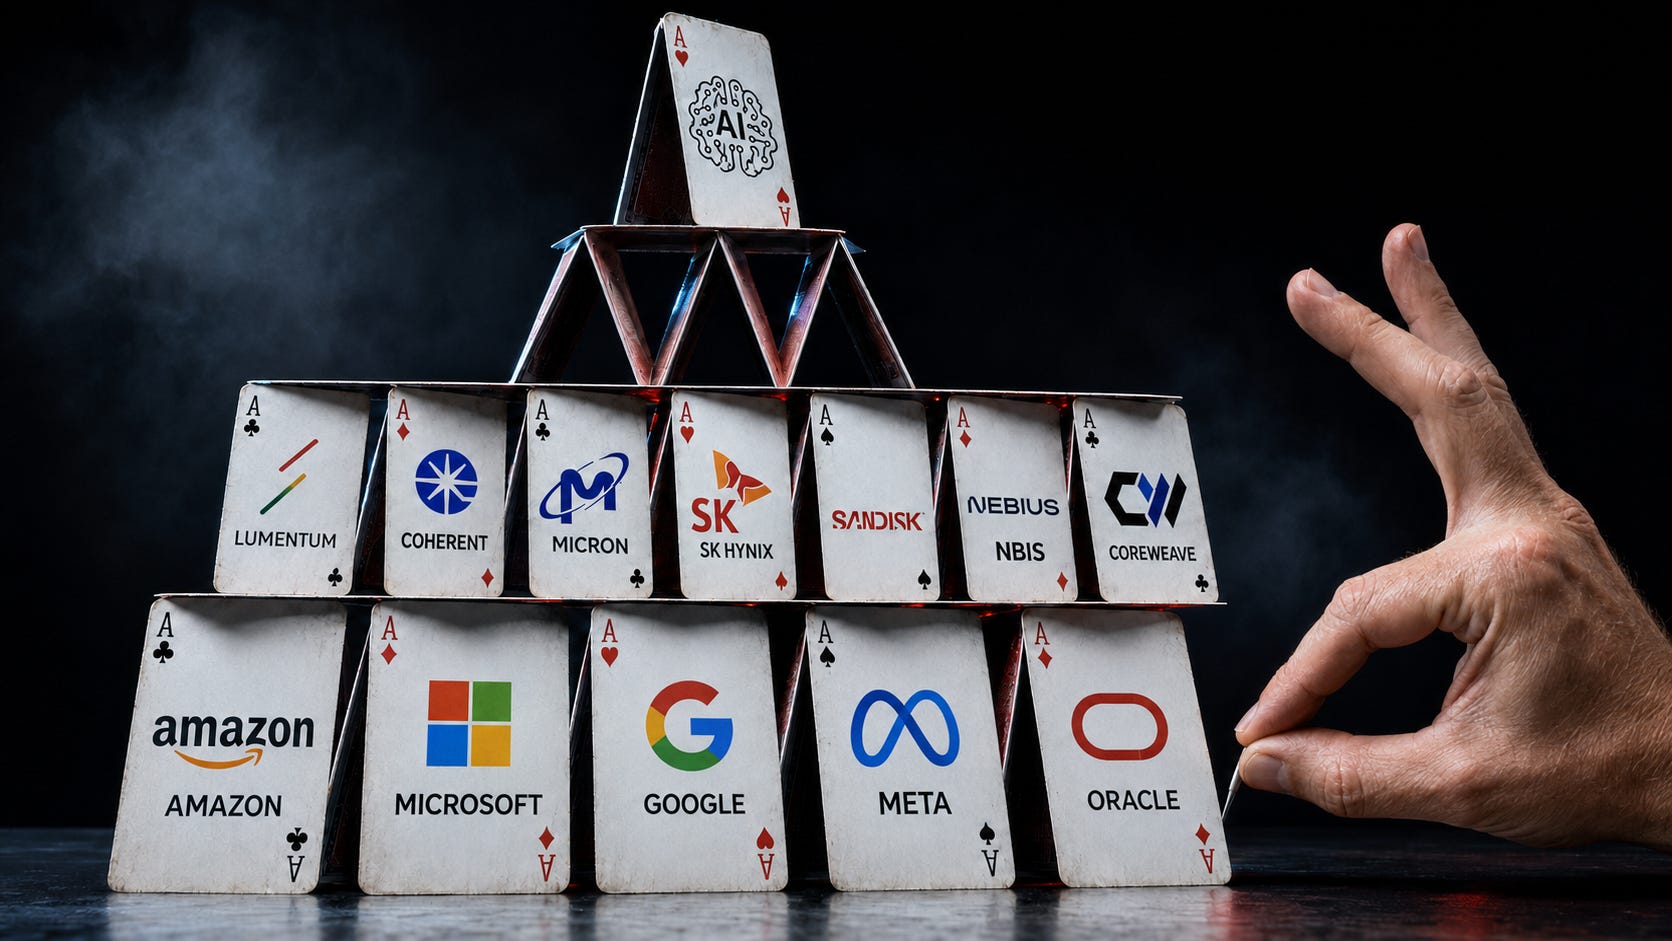
We’ve been getting the same message from you all week, especially on Tuesday. Different words, same question:
“Is It A Bubble?”
“Is The Memory Trade Over?”
“Is The Credit Spread Widening A Fundamental Crack?”
“Can Capex Keep Going Up?”
We understand it because when everyone is screaming “bubble”, the dotcom comparisons start to feel oddly real.
We’ve been seeing these headwinds build on top of each other for weeks, the AI trade had gotten crowded, and the market had priced in a world where capex only goes up and nothing goes wrong.
So we did what we always do when the noise gets too loud → we went back to the data.
We pulled the numbers from every major crash of the last 25 years: the dotcom bust in 2000, the subprime crisis in 2008, covid in 2020, the 2022 bear market, and the 2025 tariff selloff. Every single one of them had a clear macro catalyst behind it.
Black July doesn’t have any of that, this selloff is something completely different from everything on that list, and understanding why matters for what comes next.
The SOX doubled during the first six months of 2026 and from its April 2025 lows, the index rallied roughly 300%. Semiconductor stocks led the entire market higher, powered by an AI infrastructure buildout that showed no signs of slowing down.
Then July hit.
The SOX and DRAM both peaked on June 18 and have fallen respectively by roughly 25% and 40%. Samsung is down 30% from its ATH, followed by SK Hynix down almost 40% from its highest price. Furthermore, CXMT went public in Shanghai at a 472% pop, and the timing poured gasoline on an already burning memory complex.

Meanwhile the earnings estimates behind theses stocks haven’t moved. Sandisk’s forward P/E has compressed to 6.4x despite being up over 350% YTD, and Micron trades at 5.7x forward earnings. The stocks are falling while the estimates are rising, which means the multiples are shrinking from both directions at once. Moreover, NVIDIA is trading at its lowest point in over 8 years in terms of forward multiples, despite growing over 65% YoY.
The S&P 500 is sitting near all time highs, and SOX is almost in its bear market state. That divergence, the broad market holding steady while the sector that led it higher gets gutted, is one of the defining features of this sell-off. In prior crashes, everything went down together. This time, the pain is concentrated in one trade.
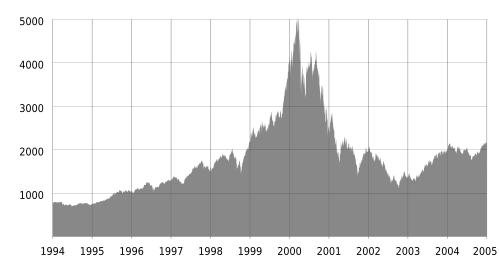
The dotcom bust started in March 2000 and lasted two and a half years. The NASDAQ fell 77% from 5,048 to 1,139. What’s more interesting? The NASDAQ P/E had reached 90x by 1999, and the average P/S ratio for companies going public in 2000 was 48.9x.
74% of surveyed internet companies had negative cash flows and most of them had no revenue model. The Fed had hiked rates six times in 10 months to 6.5%, Japan entered a recession and Barron’s ran a cover story documenting how quickly these companies were burning through cash. $5 trillion in market value was erased and the trigger was a speculative bubble built on companies that had NEVER earned a dollar, most of them had one thing in common: “.com” domain.
The subprime crisis started in late 2007 and bottomed in March 2009. During these years the S&P 500 fell 57% from 1,565 to 676. Household net worth declined by $13 trillion, and 8.5 million jobs were lost. Bear Stearns went under in March 2008, Lehman filed in September and investment banks were running leverage ratios of 33:1. Subprime mortgage originations had gone from 5% of total lending in 1994 to 20% by 2006. It’s also worth noting that the semiconductor sector fell roughly 55% despite having nothing wrong with it operationally, the trigger was a credit system that had loaded itself with $1.3 trillion in subprime debt and then collapsed under its own weight.
If any of this sounds familiar, you’ve probably seen The Big Short.
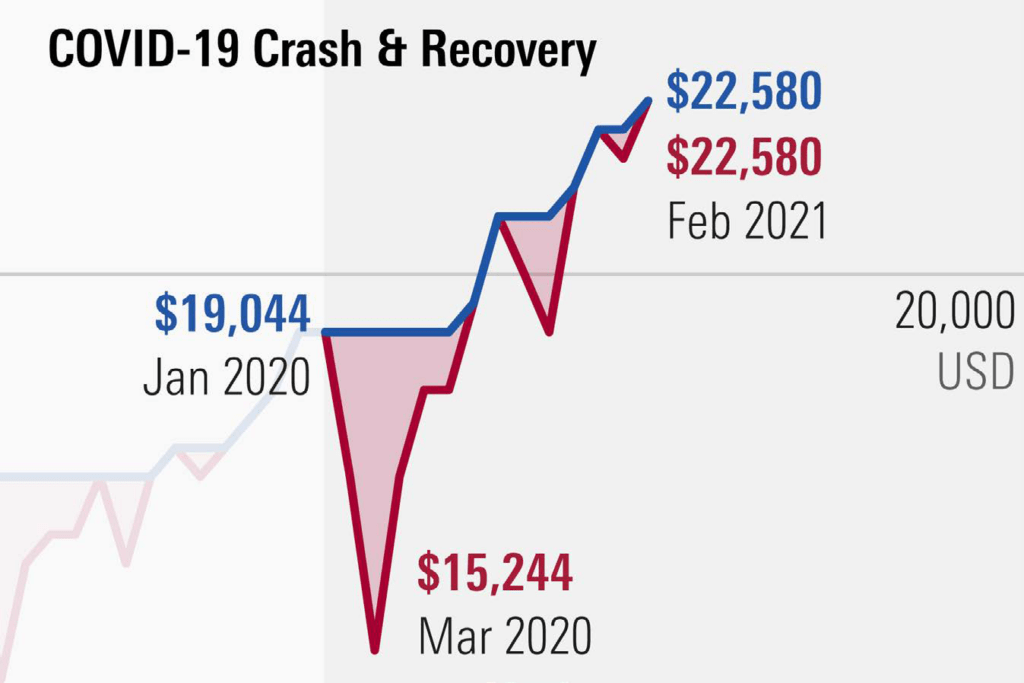
The Covid crash was the fastest 34% drawdown in S&P history. It took five weeks from the February 19, 2020 peak to the March 23 trough. The VIX hit 80 and the trigger was the global pandemic shutting down the physical economy overnight. There was no earnings deterioration story or no credit crisis. The market sold everything because nobody knew if the world was about to stop functioning, and then the Fed stepped in with unlimited liquidity and the entire drawdown was erased within months.
The 2022 bear market was slower and more methodical. The S&P 500 fell 25% from January to October. The Fed raised rates from 0.25% to 4.5% in a single year, the fastest tightening in over 40 years, and the bond market had its worst year since the 1970s. Consumer electronics demand collapsed and Micron’s revenue fell 49% in one fiscal year. The trigger was the fastest rate hiking cycle in decades crashing valuations first, and then demand actually deteriorated to confirm what the market had already priced in.
The tariff crash in April 2025 was the most avoidable crash out of all on this list. The S&P 500 dropped 12% in the first week of April after the Liberation Day tariff announcement, nearly touching bear market territory. Then Trump paused reciprocal tariffs for 90 days and the S&P rallied 9.5% in a single session. The full drawdown was erased by end of may and the S&P set new all time highs within 20 weeks. The trigger was a trade policy shock that reversed itself almost immediately.
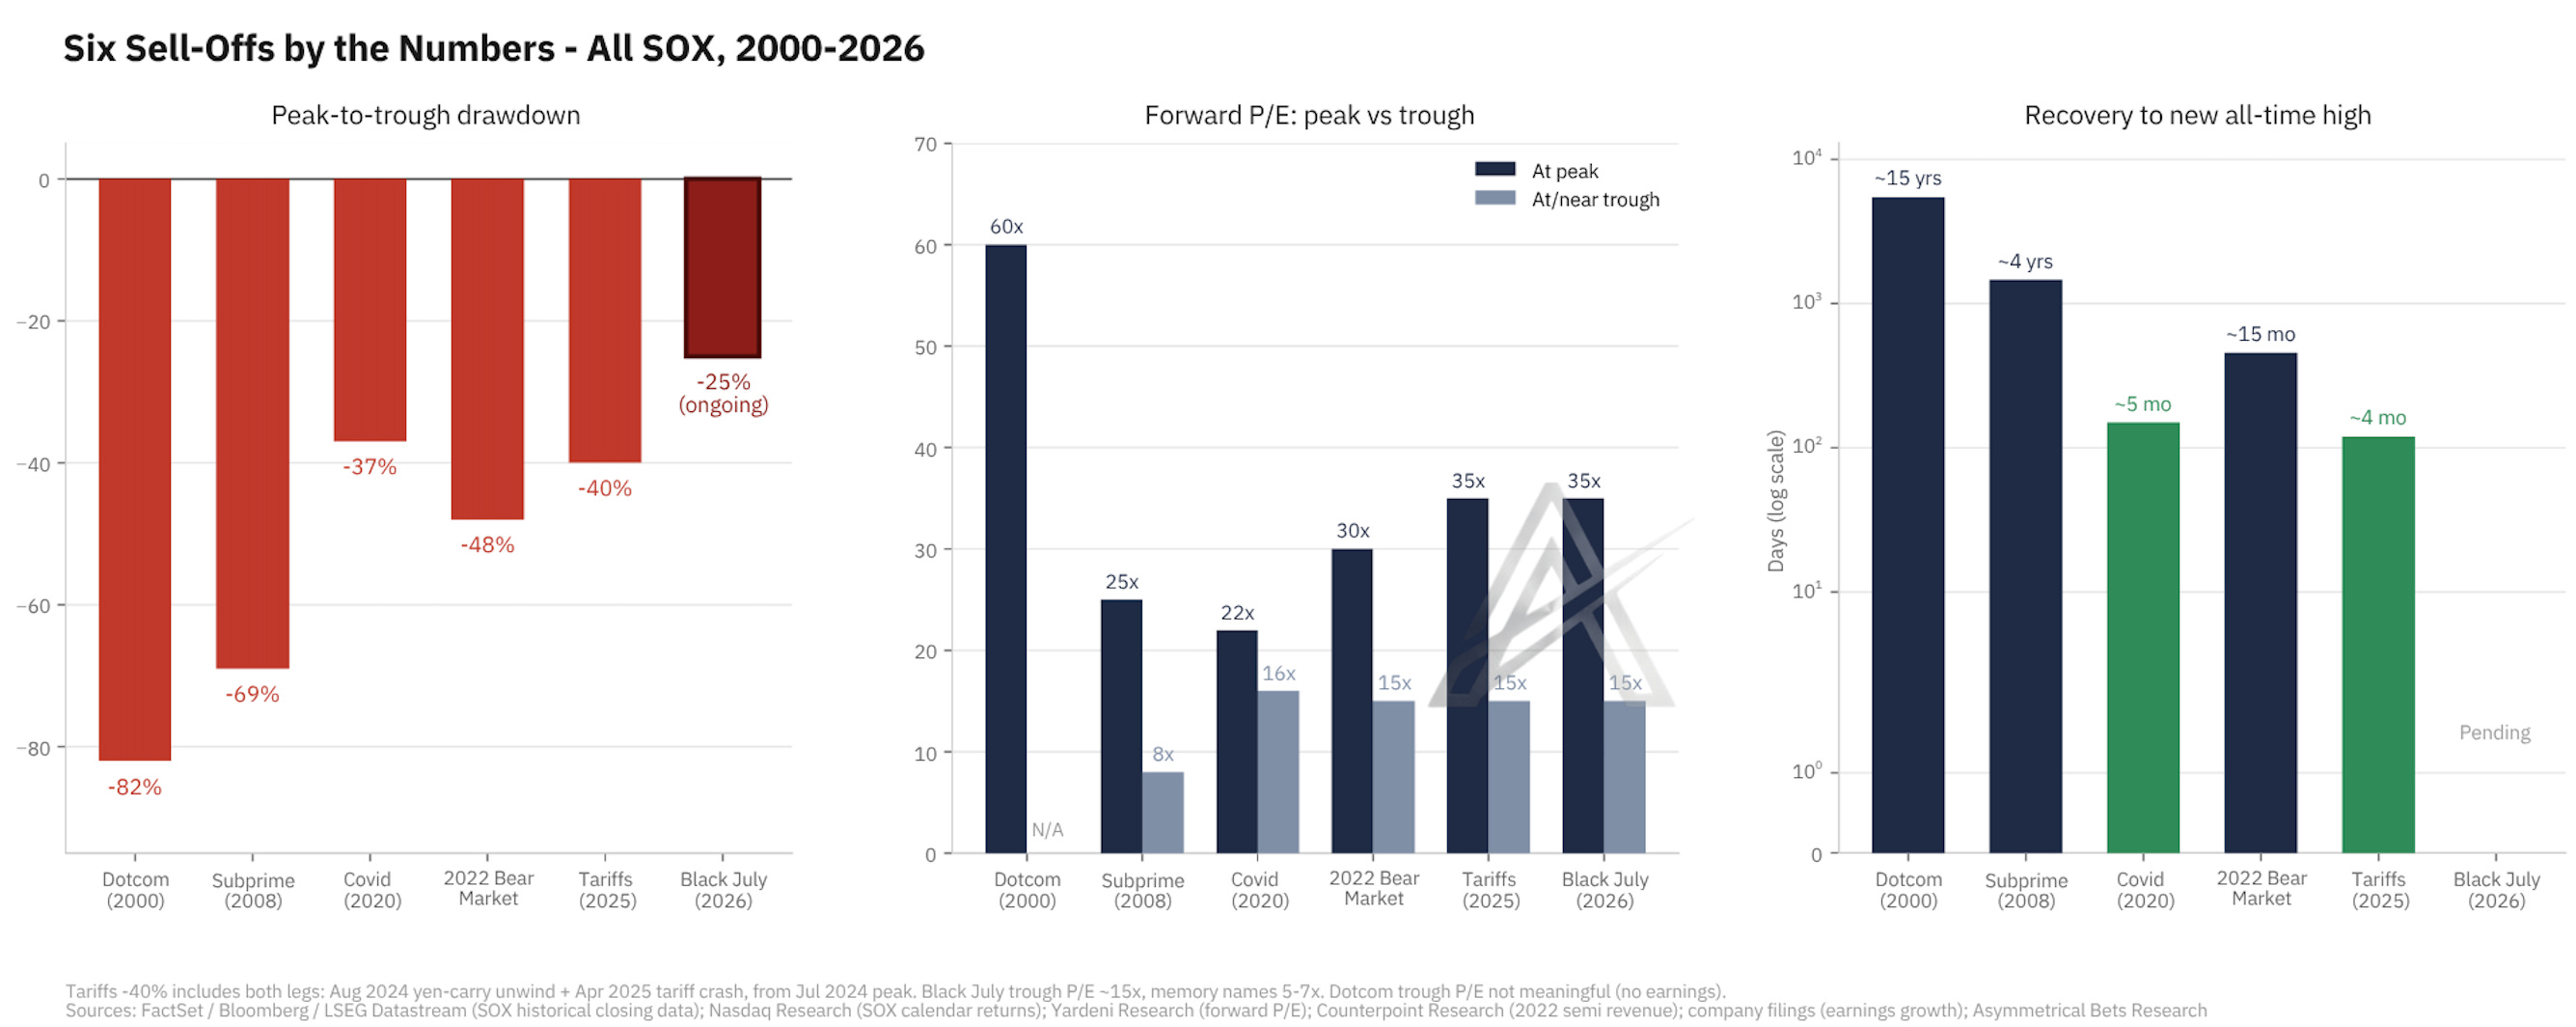
Noticed how we pointed the trigger in every single crash mentioned? The reason is pretty simple:
Every situation described had a macro catalyst you could point to:
A speculative bubble built on horrible companies with astronomical multiples
A financial system that was leveraged 33:1 on subprime debt
A pandemic that shut down the global economy and you couldn’t go into the story for a couple of months.
The fastest rate hiking cycle in 40 years and a trade war that slapped 125% tariffs on Chinese imports overnight.
EACH time, you could look at the wreckage and trace it back to one specific problem in the real economy. However, Black July doesn’t have that, and why this selloff is happening will be described in the upcoming sections.
Every crash we studied had one variable that determined whether the recovery took months or years:
Were the earnings actually declining when the stocks fell?
Starting with the dotcom bust, there were no earnings to decline. Most of these companies had never generated a dollar of profit. Netscape went public at $2.2 billion market cap without ever making money, and it was one of the better ones. When the bubble popped, there was nothing underneath to catch it. It took 15 years to recover to the peak levels because the profits that were supposed to justify the valuations never showed up.
In the subprime crisis, the chip companies were making money through the entire drawdown, but SOX still fell 55%. Once credit market stabilised, the recovery came relatively quickly. The S&P reclaimed its pre-crisis level within four years of the March 2009 bottom.
Covid genuinely shut the economy down and earnings took a hit across most sectors. But the companies themselves weren’t broken. Amazon added $105 billion in revenue in a single year as physical retail closed its doors. Zoom went from a small conferencing tool to the way the entire world communicated. The businesses adapted, the Fed stepped in with unlimited liquidity, and the full 34% S&P drawdown was erased within months.
In 2022, earnings were actually getting worse. Samsung’s semiconductor revenue plunged 38% as the memory market cratered. Intel dropped 17% on collapsing PC and server shipments. The global semi industry lost 8.8% in aggregate revenue. The stocks were falling and the fundamentals underneath were confirming the decline. The market didn’t bottom until October, once the trough in earnings became visible.
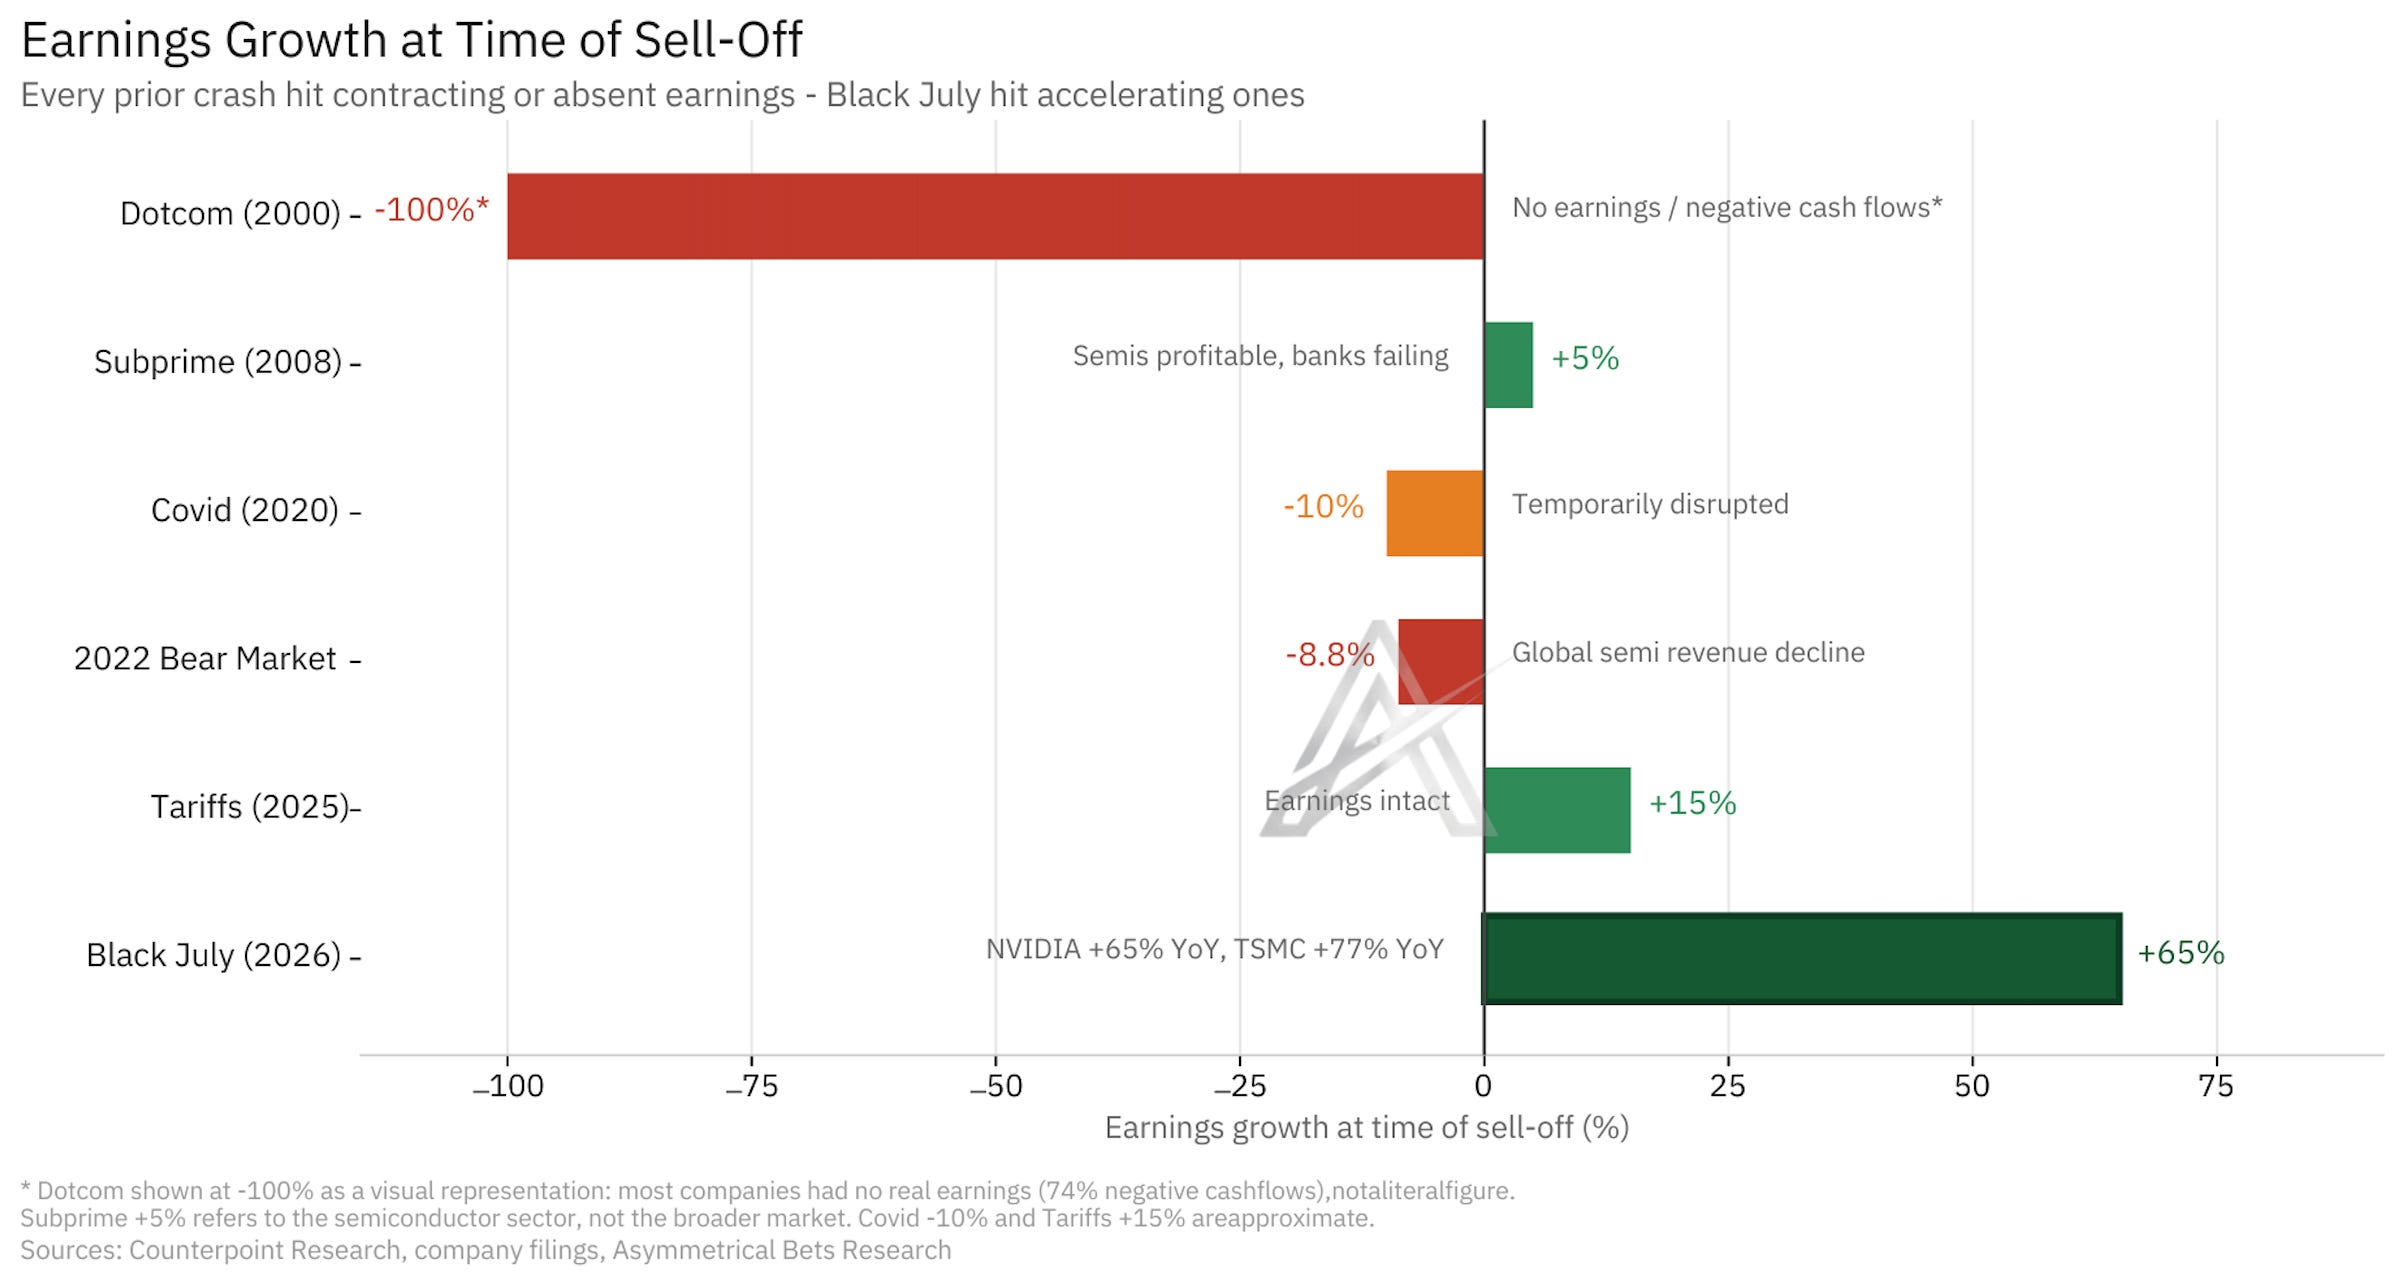
The tariff crash followed the covid playbook. Earnings were intact, the threat reversed within days, and the S&P recovered within weeks.
Black July has accelerating earnings, and record margins. NVIDIA trades at its lowest forward multiple since before the AI cycle existed. Memory names sit at single-digit forward earnings. TSMC just printed a record quarter. The stocks are falling while earnings go up. Every time we found that pattern in the data, the recovery came in months.
We don’t see a credit system falling or global pandemic that could cause this kind of drawdown in semis. What’s been happening is a pile of narratives all hitting at the same time:
The Iran war reigniting inflation and rate hike fears
Chinese competition from CXMT
Kimi K3 questioning whether frontier labs can hold their margins
OS models threatening the moat of closed models AI companies
AI effiency concerns about oversupply
Rising credit spreads on hyperscaler debt
Three months ago, the market treated AI capex as untouchable. All of the fears we listed above have been testing and breaking the narrative over the course of a single month. The market started to have concerns whether the spending can even continue.
Oil, possible rate hikes and credit spreads made the buildout look more expensive to finance. Kimi and OS models made it look unnecessary, because if intelligence gets cheaper, maybe you need fewer GPUs, and china made the returns on all of it look less certain. All of these are different fears but they point in the same direction:
“Capex cuts are coming.”
However, so far, the actual capex numbers haven’t changed. GOOG 0.00%↑ and TSM 0.00%↑ both raised their guidance and capex this quarter and language from their representatives was positive.
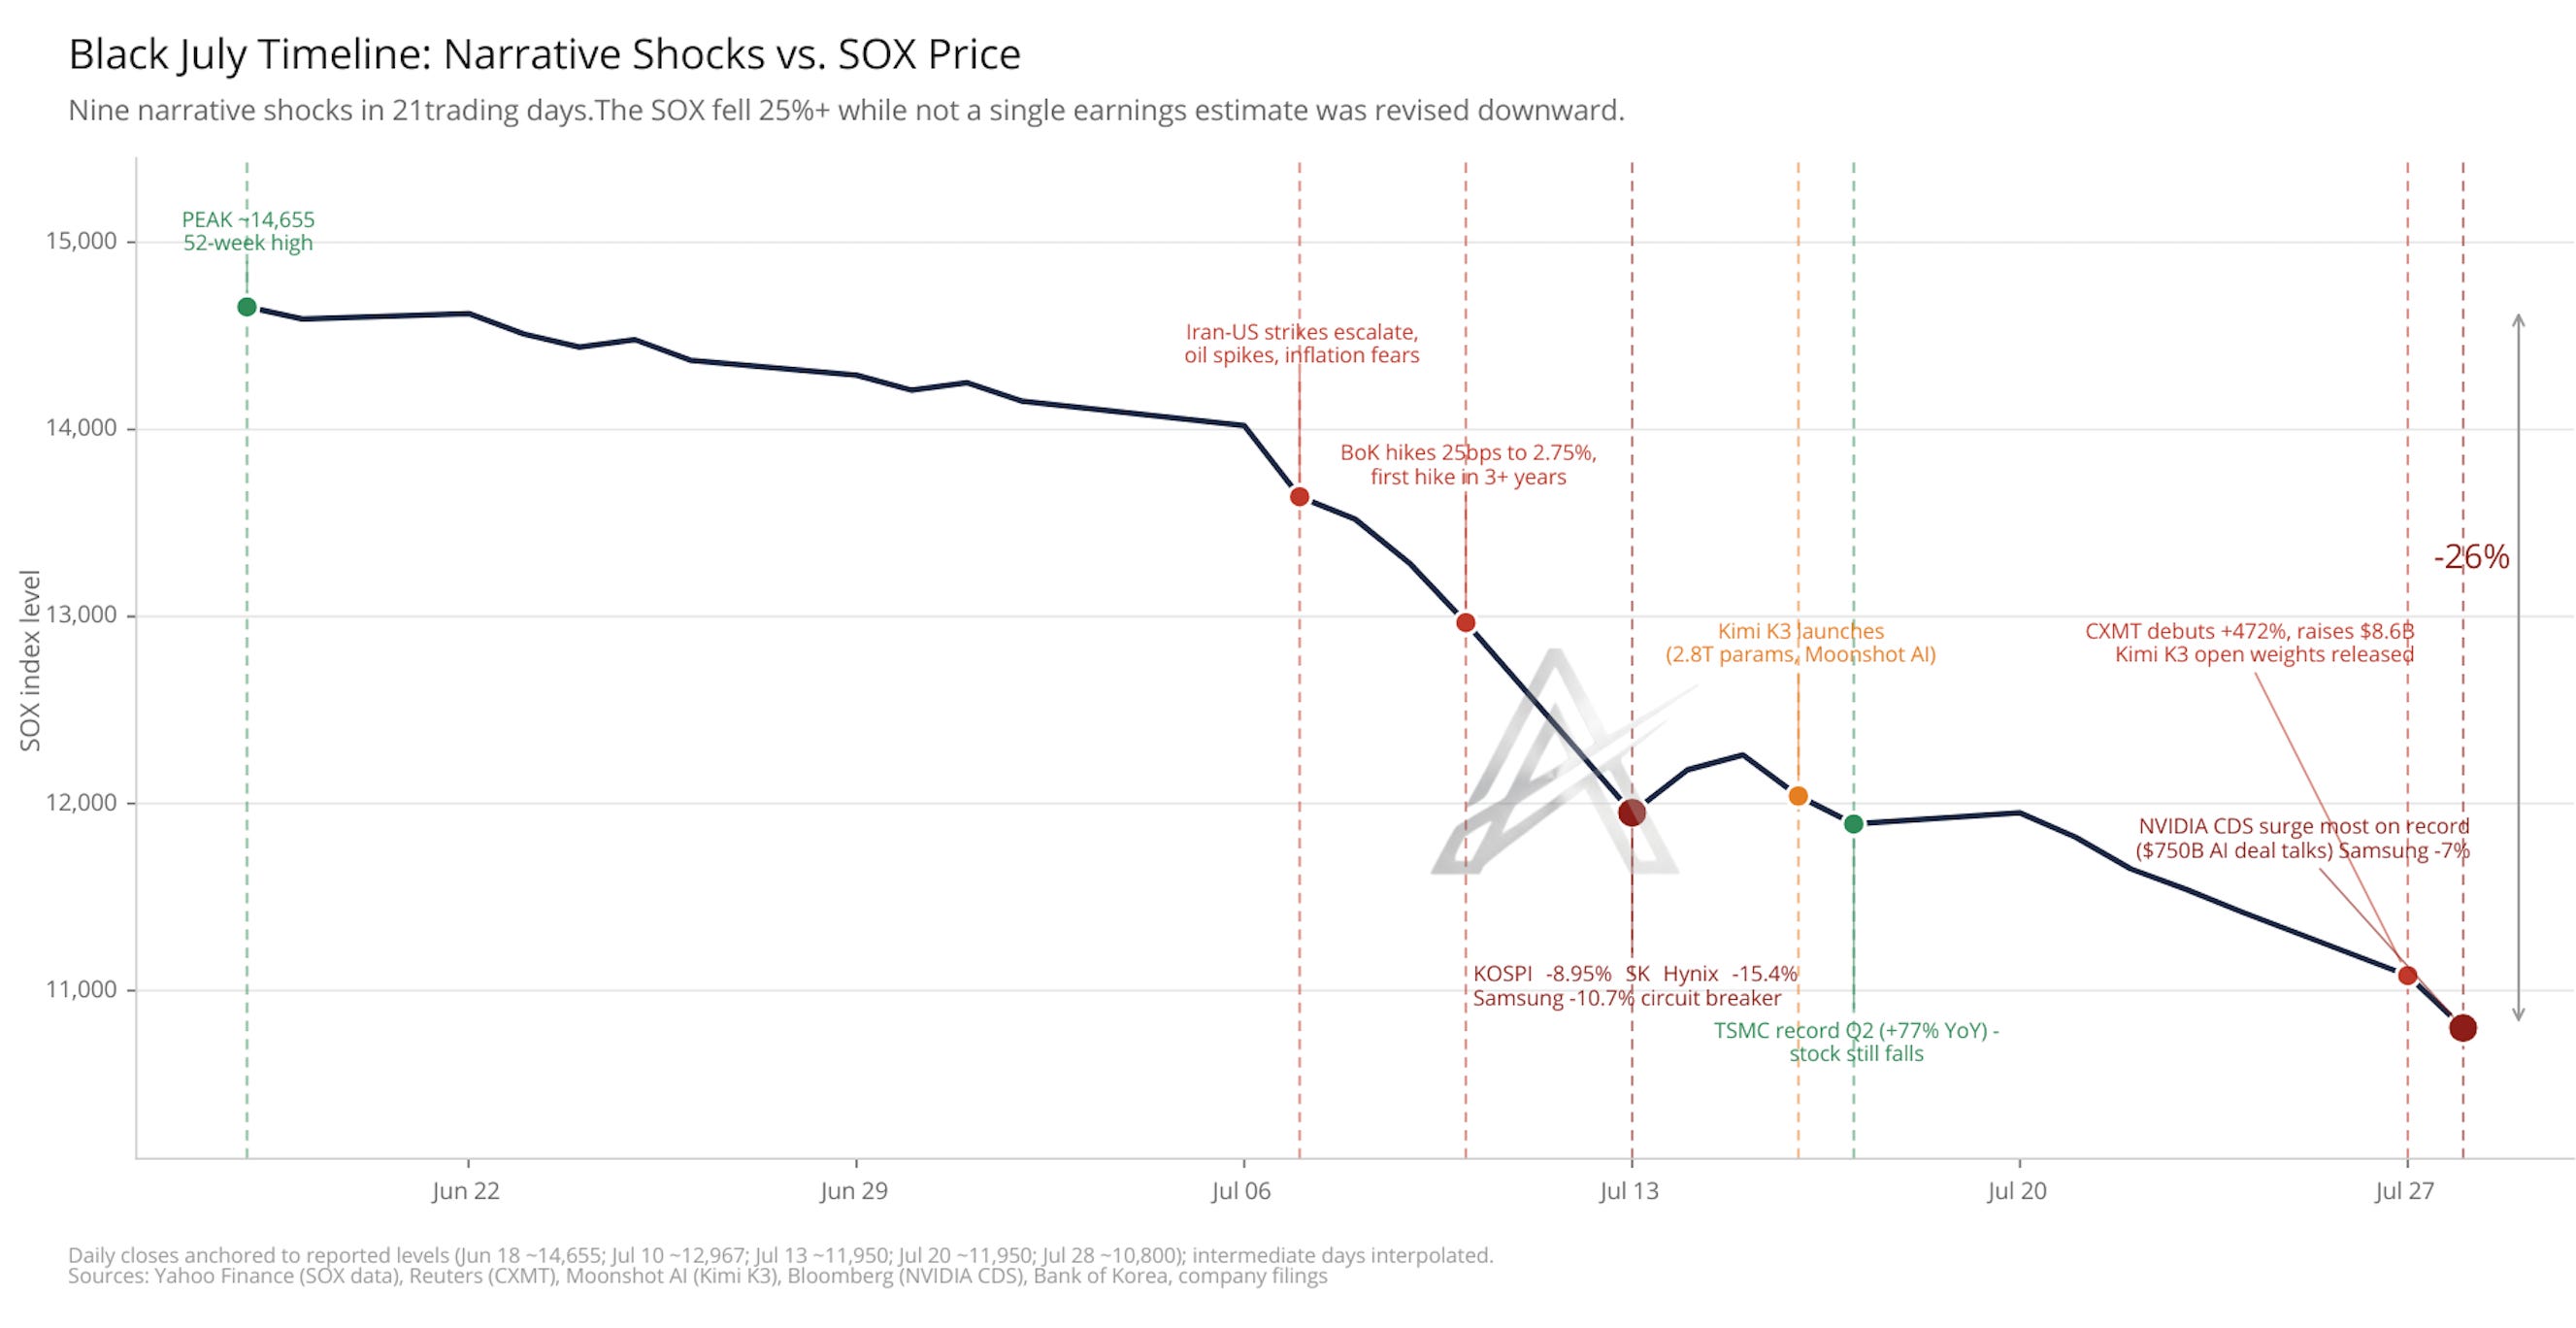
The narratives gave the market a reason to sell and leverage gave it the mechanism to do so.
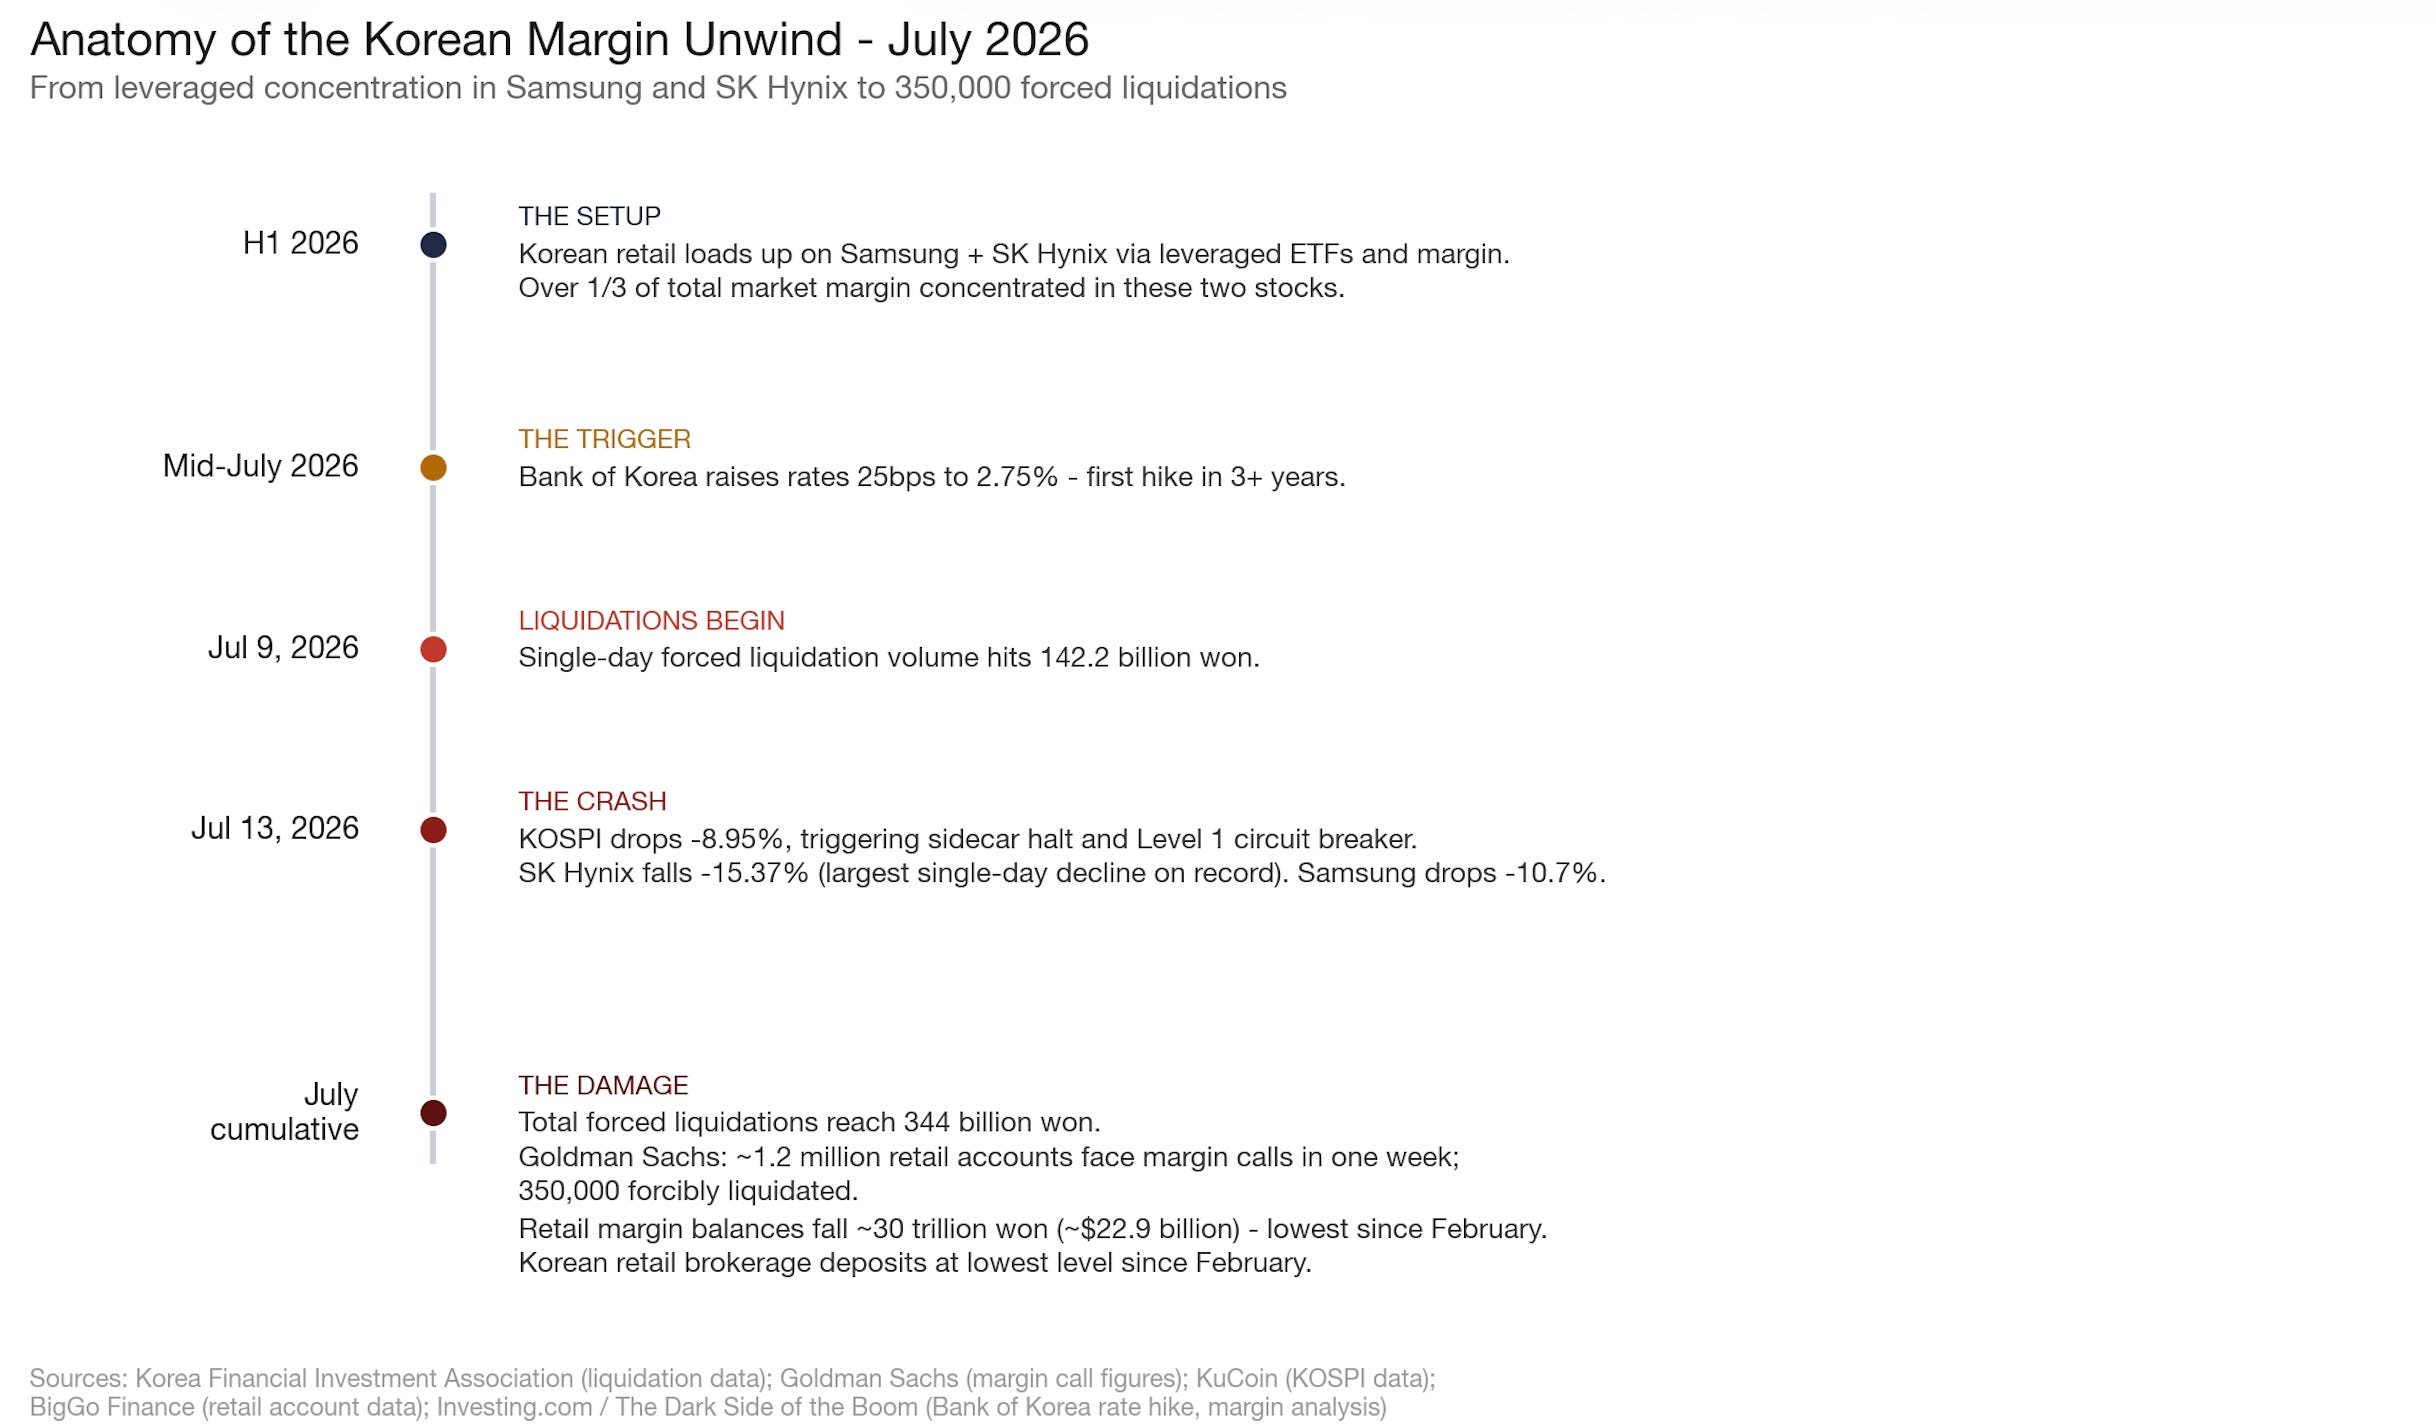
South Korean retail spent H1 2026 loading up on Samsung and SK Hynix through leveraged ETFs and margin accounts. Over a third of total market margin in Korea sat in just those two stocks. When Korea raised rates 25 basis points in mid-July, the first hike in three years, it jenga blocked the most crowded trade in Asia.
Furthermore, Goldman Sachs data reported that roughly 1.2 million retail accounts faced margin calls in a single week and 350 thousand were forcibly liquidated. Cumulative forced liquidations in July hit 344 billion won. SK Hynix dropped 15.37% in one session, then posted back to back 10%+ down days after that. Korean retail kept buying while foreign and domestic institutions sold, making the forced selling worse with each leg down.
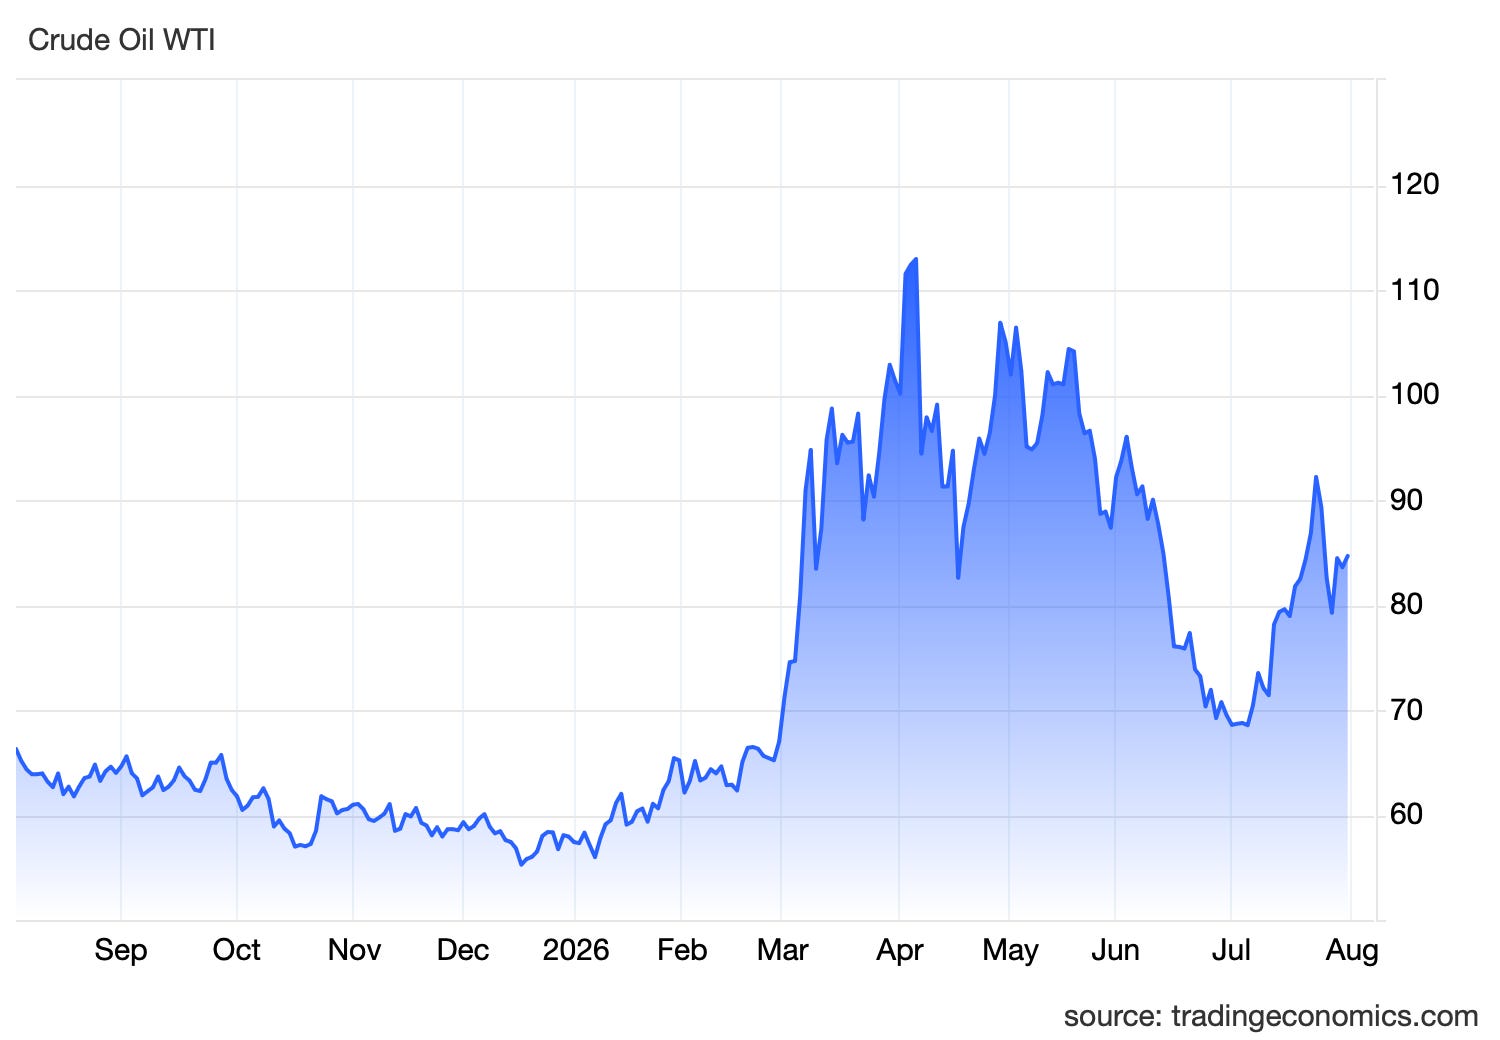
But leverage wasn’t the only thing hitting the sector. The Iran conflict pushed oil prices higher and brought inflation fears back, raising the chance of rate hikes right when the market had priced in the Fed staying put.
On top of that, the debt load across AI infrastructure is finally making people nervous. NVIDIA’s CDS costs surged by the most on record after reports that the company is in talks on over $750 billion in AI infrastructure deals. Hyperscalers are spending $700B+ in capex this year, and for several of them that spending now absorbs most or all of their operating cash flow. They’ve responded by issuing massive volumes of investment grade bonds, and the flood of new paper has pushed credit spreads wider.
We think the debt panic is overdone, and Gavin Baker made a great point last week. The companies that signed contracts for GPU compute in 2024/25 are currently paying roughly half of what the spot market charges today. That means hyperscalers are under earning on their existing capacity right now → as those contracts expire and reprice to current spot levels, cash flow accelerates without building a single new data center.
Operating cash flow growth is moving from 31% in Q1 to 50% in Q2, and we think consensus is wrong to expect a slowdown in Q3. If that plays out, the funding gap the credit market is worried about closes on its own.

Gavin Baker@GavinSBaker
Market is overreacting to hyperscale credit spreads widening from my perspective. TL;DR Spot pricing for renting GPU compute materially above contracted rates implies hyperscalers are underearning while operating cash flow acceleration is an underestimated source of funds for AI
6:09 PM · Jul 28, 2026 · 4.02K Views
5 Replies · 9 Reposts · 60 Likes
Let us be clear. None of this represents a fundamental deterioration.
The debt is financing demand with real returns, the war is a geopolitical risk and rate hike fears might come away as soon as the war ends. However, when all three hit a sector that doubled in six months on leveraged positioning, it doesn’t take a crisis to produce a this type of drawdown.
We have found one quote from an analyst we think you should hear:
“the lesson from Korea is not that the AI cycle is over. It is that even a powerful structural story can be broken temporarily by the price paid for it and the leverage used to own it.”
Take a look at the table below. Five tech selloffs since 1998 and every single one recovered. The median drawdown was 32.4% and the median time to new ATHs was 282 days.
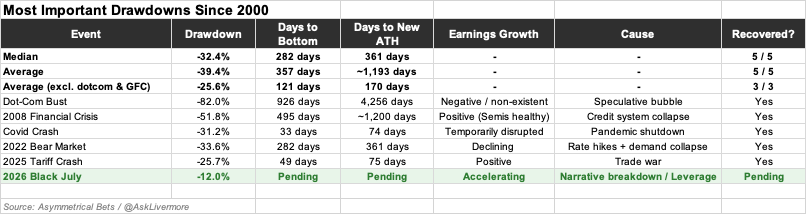
We don’t know where the exact bottom is (nobody does), but the data where earnings are growing and no macro crisis sits behind the drawdown is pretty clear. They recover and they tend to do it fast.
There’s also a catalyst forming that the market hasn’t priced in yet. The US and Iran have paused strikes and Oman is mediating talks over the Strait of Hormuz. If a peace deal finally (!) materializes, oil prices come down → inflation fears ease → the rate hike narrative dies, and one of the biggest overhangs disappears overnight.
We covered this angle in our ERII piece and the logic applies here too. A resolution in the Middle East removes the single macro risk that’s giving the bears a huge argument right now.
Where’s our head in this situation?
We're not calling a bottom and we're not telling anyone to go all in today. However, we’re saying is that the conditions that produced every bear market / bubble pop we studied are absent right now.
The stocks that are down 30-50% in a month are the same ones printing record earnings and trading at the lowest forward multiples in years. If sustained capex cuts from hyperscalers show up or data center orders collapse in the this round of earnings, we'll reassess.
Until then, nothing changes from our side as we are still invested in the industry.
Comments
Nothing yet. Say the first thing.
Sign in to join the conversation.