Data Tables
A data table is one of the ways Row Zero renders data in a sheet. It sits on top of the spreadsheet grid, is anchored to its upper-left cell, and displays a full dataset without writing that data into cells. The data can come from a query, a pivot table, a file, or a formula.
Data tables are a convenient way to work with large datasets for two reasons:
- Fixed footprint: A data table takes up the same space in the sheet no matter how much data it displays. It does not expand and push your other content around when the dataset grows. Scroll inside its borders to move through the data, or drag the bottom border to show more or fewer rows.
- Column transformations: Data tables support column transformations via computed columns. Computed columns are useful for adding derived, row-level logic to large datasets. For example, deriving new metrics, categorizing data, or trimming and cleaning values in other columns.
Types of data tables
Data tables are a rendering mode for connected tables, pivot tables, file import, and formula outputs.
| Type | Description |
|---|---|
| Connected table | The results of a query against a connection. |
| File import | A file imported from your computer, a URL, or a cloud source (e.g. S3). |
| Pivot table | A summary or analysis table. |
| Formula output | The value returned from a function (e.g. DATATABLE). |
This page covers what a data table is and how to work with one. For how to get data into a workbook in the first place, refer to the following:
- Data import: creating connected tables and file imports
- Pivot tables: creating pivot tables
- DATATABLE: creating a data table using the DATATABLE function
Whatever produced it, a data table behaves the same way. Everything below applies equally to a pivot table, a connected table, an imported file, and a formula result.
Work with data tables
Scroll and navigate
Click into a data table to scroll with your mouse, arrow keys, or the scroll bar on the right side of the table. Use Ctrl + arrow up (Cmd + arrow up on Mac) to navigate to the top and Ctrl + arrow down (Cmd + arrow down on Mac) to navigate to the bottom of the data table.
Move and resize
Drag the left, right, or top border to move a data table within a sheet. The hand icon will display when the mouse is hovering over a border that can be moved.
Drag the bottom border to make it taller or shorter. Data tables default to 15 rows. Resizing changes how many rows are visible. It does not change the underlying dataset.
Manage columns
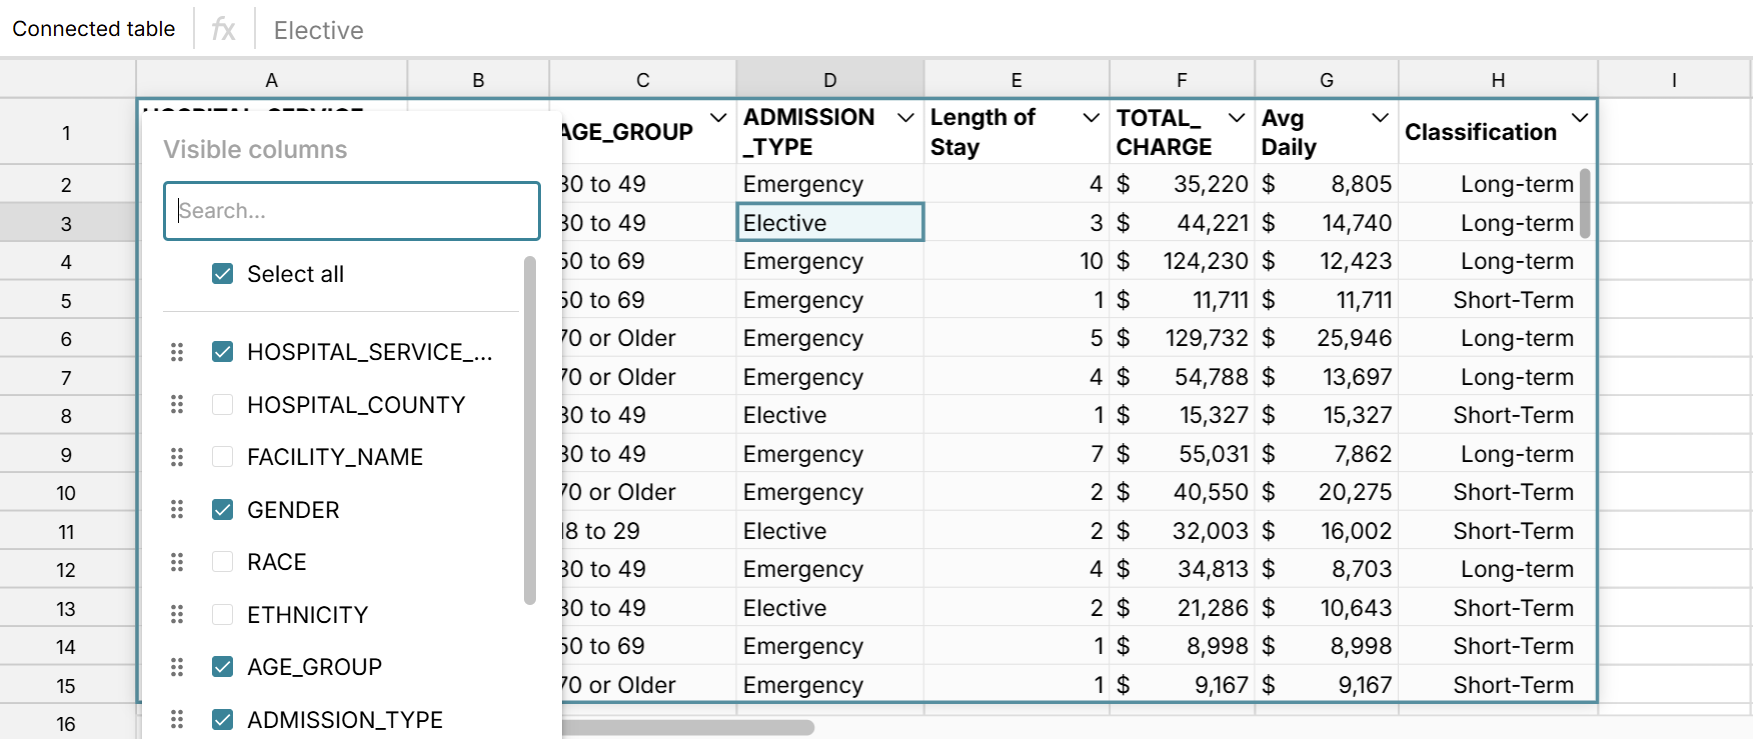
Right-click on the data table and select Manage columns to hide or reorder columns. Hiding a column removes it from view without removing it from the underlying data. Note that source data table columns cannot be deleted but calculated columns can be deleted by clicking in the column and hitting delete.
Filter and sort
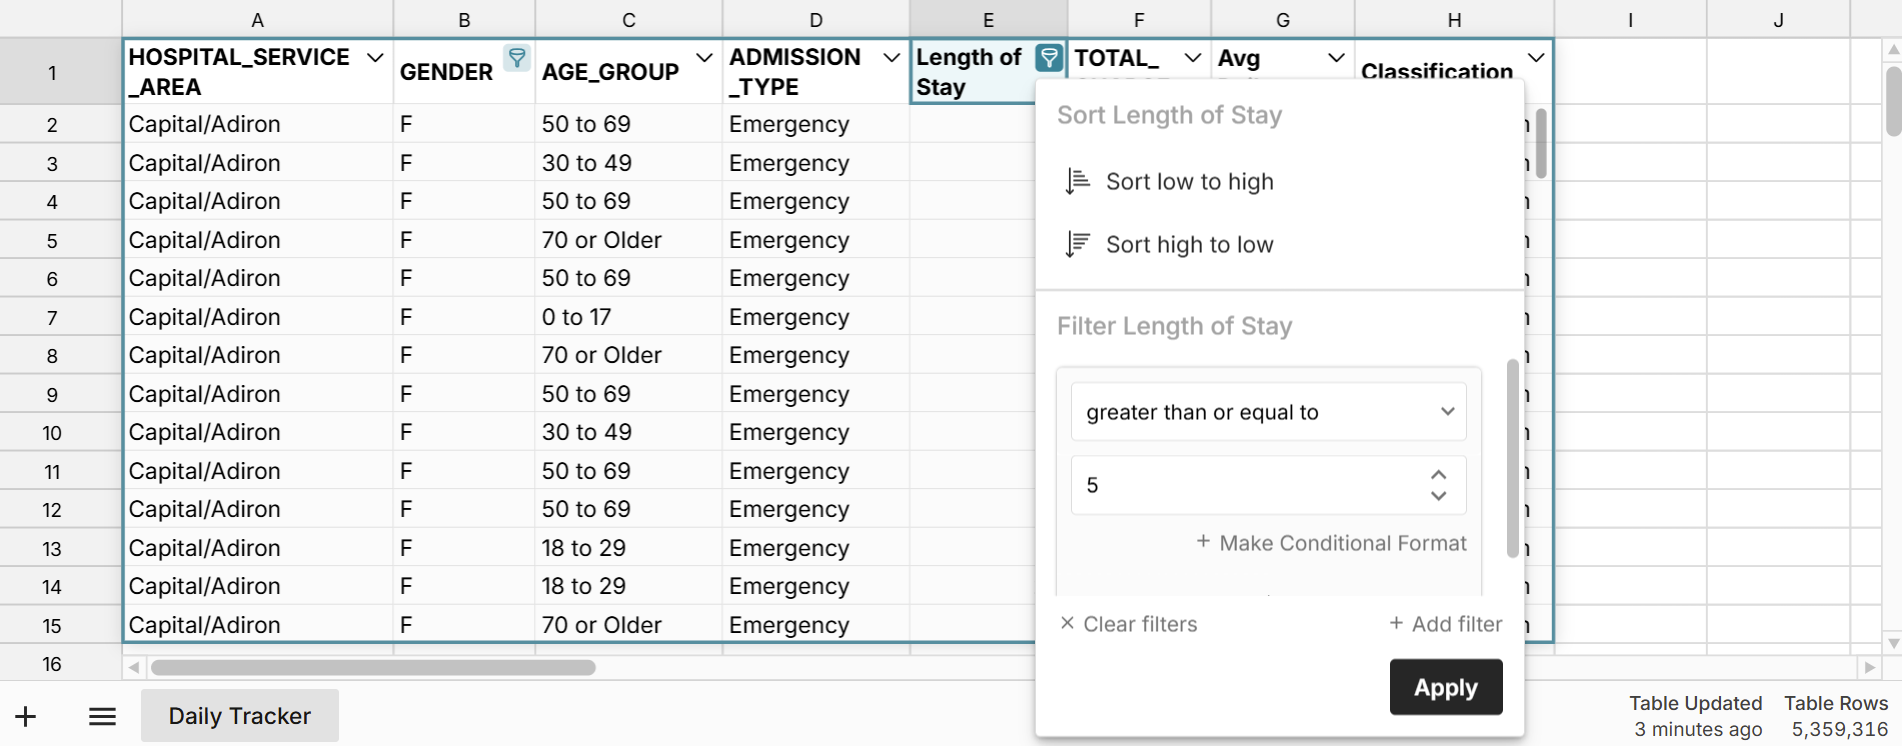
Filter and sort data tables just like any other filtered range in a spreadsheet. You can filter and sort by clicking the toggle in the column header or by right-clicking in the data table and selecting Sort or Filter column. You can easily add multiple filters and sorts.
Format
Select a column and use the standard spreadsheet formatting controls. Data tables also support conditional formatting. Note that formatting is applied to the entire column.
Explode table
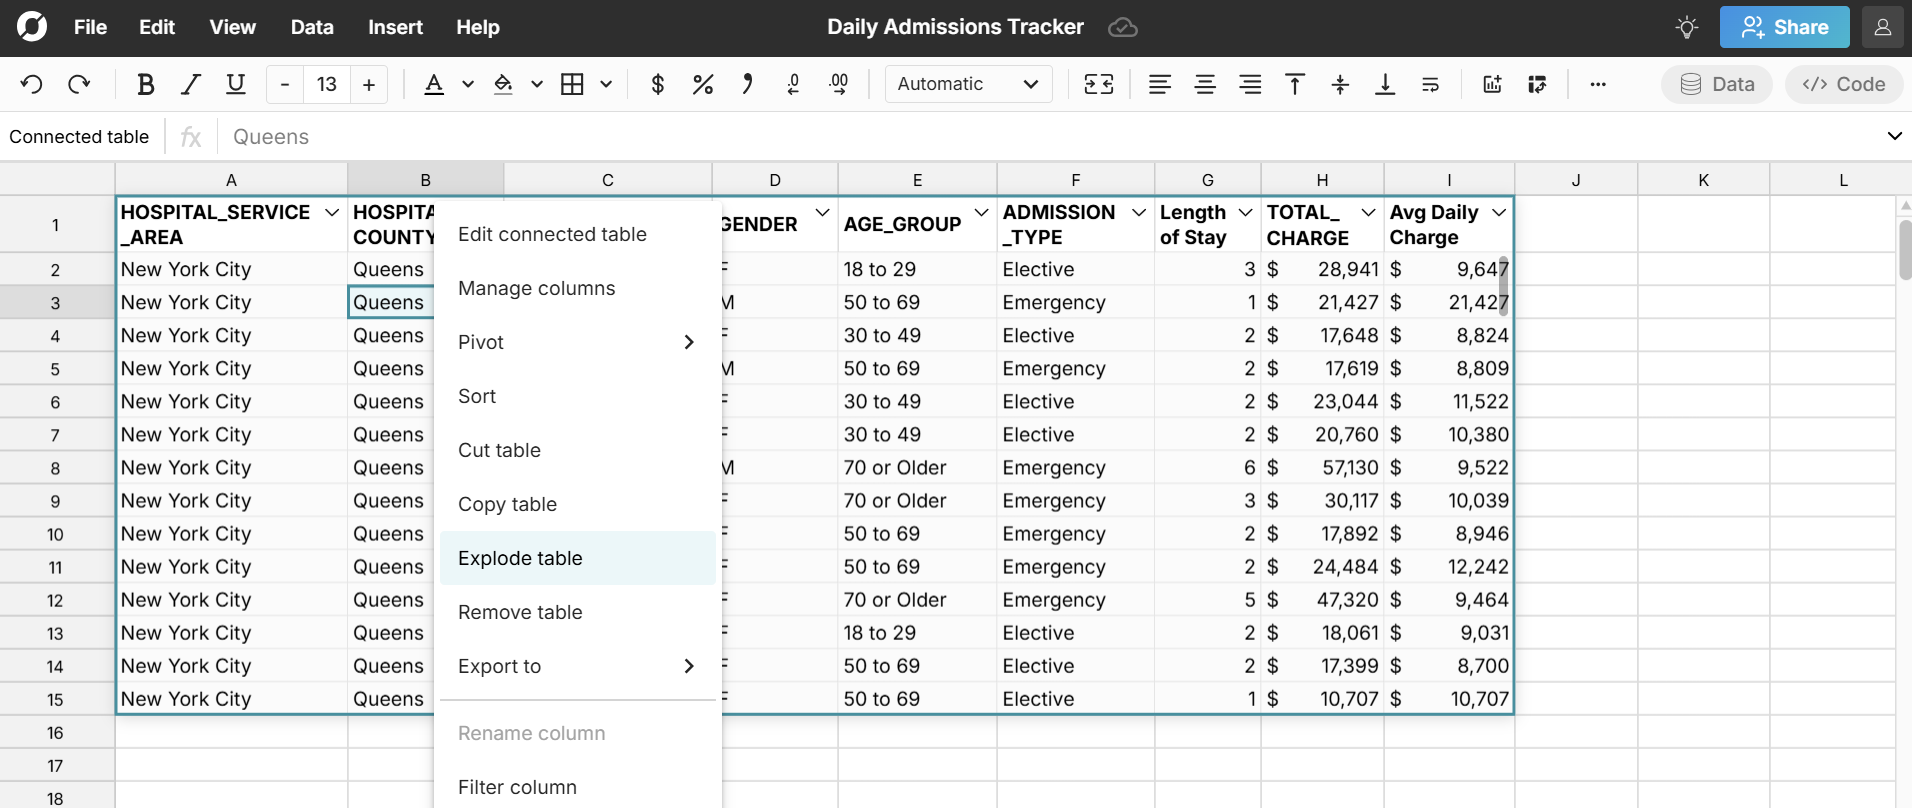
To transform a data table into spreadsheet cells, right-click on the data table and select Explode table. The data table will be pasted into the underlying spreadsheet cells, filling all the rows populated by the data. This is similar to a copy/paste values.
Explode table is useful when you need to edit values directly.
Important: When you explode a data table, you break the connection to your source data, so exploded data will not update with source data (query, pivot source, or formula input).
Cut, copy, and paste
Right-click to cut and copy data tables and paste with Ctrl + v. This is an easy way to duplicate data tables to quickly make new iterations.
Transformations
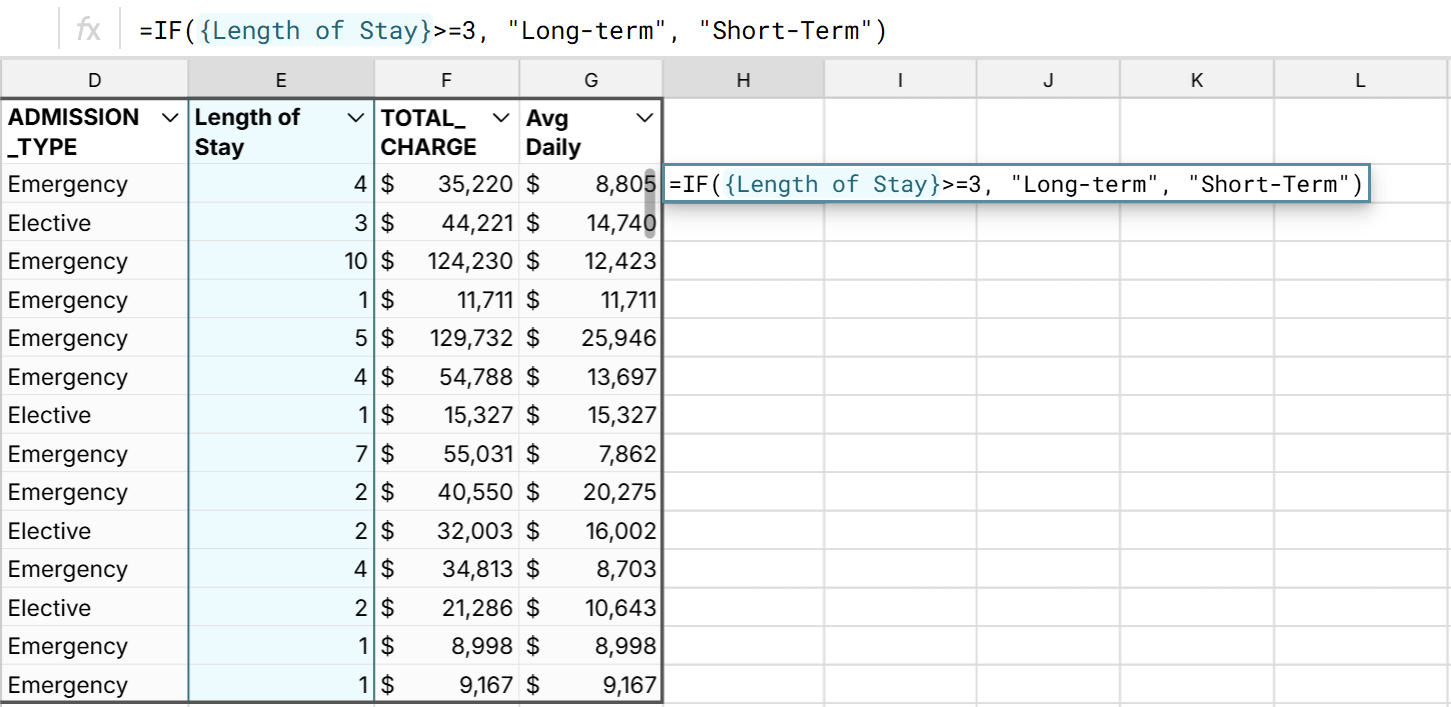
Add a computed column by typing a formula in the column directly adjacent to the data table. To reference another column in the table, then click the column in the data table or arrow across to select it. When you evaluate the formula, Row Zero automatically adds a new column to the table with that formula.
Rename the column by editing the header cell.
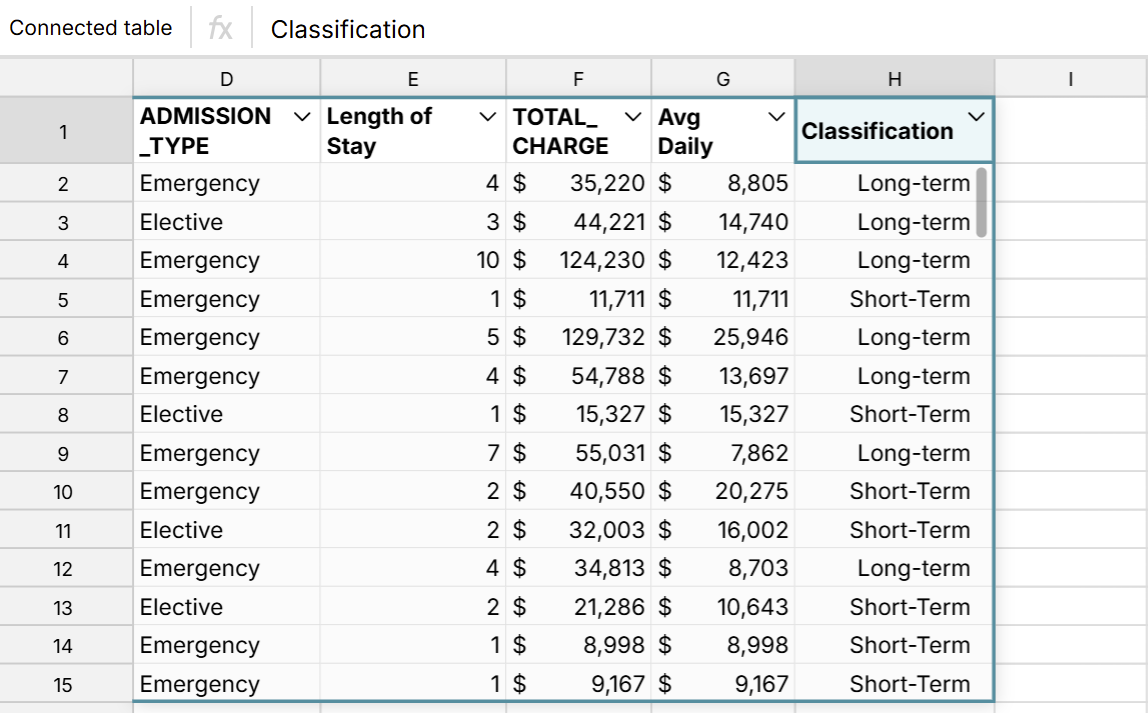
Computed columns can be hidden or reordered using Manage columns. To delete a computed column, delete any cell in the column.
Note: The data inside a data table cannot be edited. It can be manipulated on a column level by creating new columns or using filter and sort features. If you want to edit the data, you can right-click and select Explode table to paste values to cells where you can fully edit and delete data.
Build on top of a data table
Pivot tables, charts, and formulas can all use a data table as their source. When a data table updates with new data, everything downstream updates, too. For example, when your connected table updates with new data, everything referencing it updates as well.
Formulas
You can reference a data table column in any function that takes a range as an argument. To reference a data table column in your function, use arrow keys or mouse to toggle to the column. The column will autofill in your function.
Note: When formulas are entered in the first column to the right of the data table, they are added to the data table as computed columns.
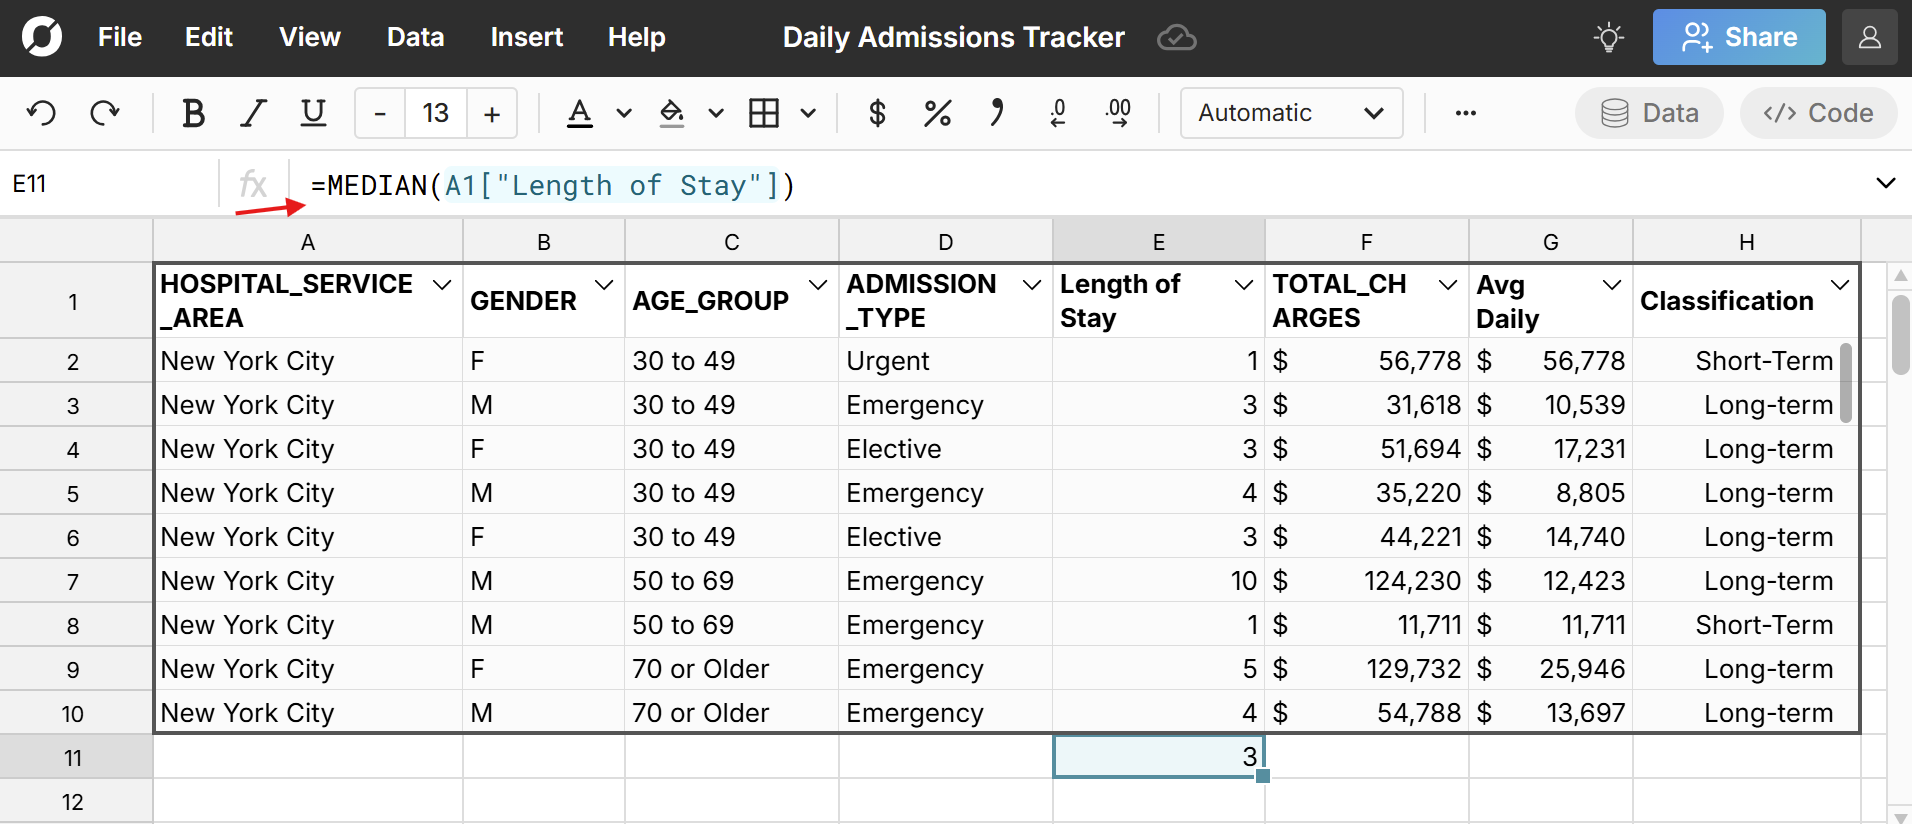
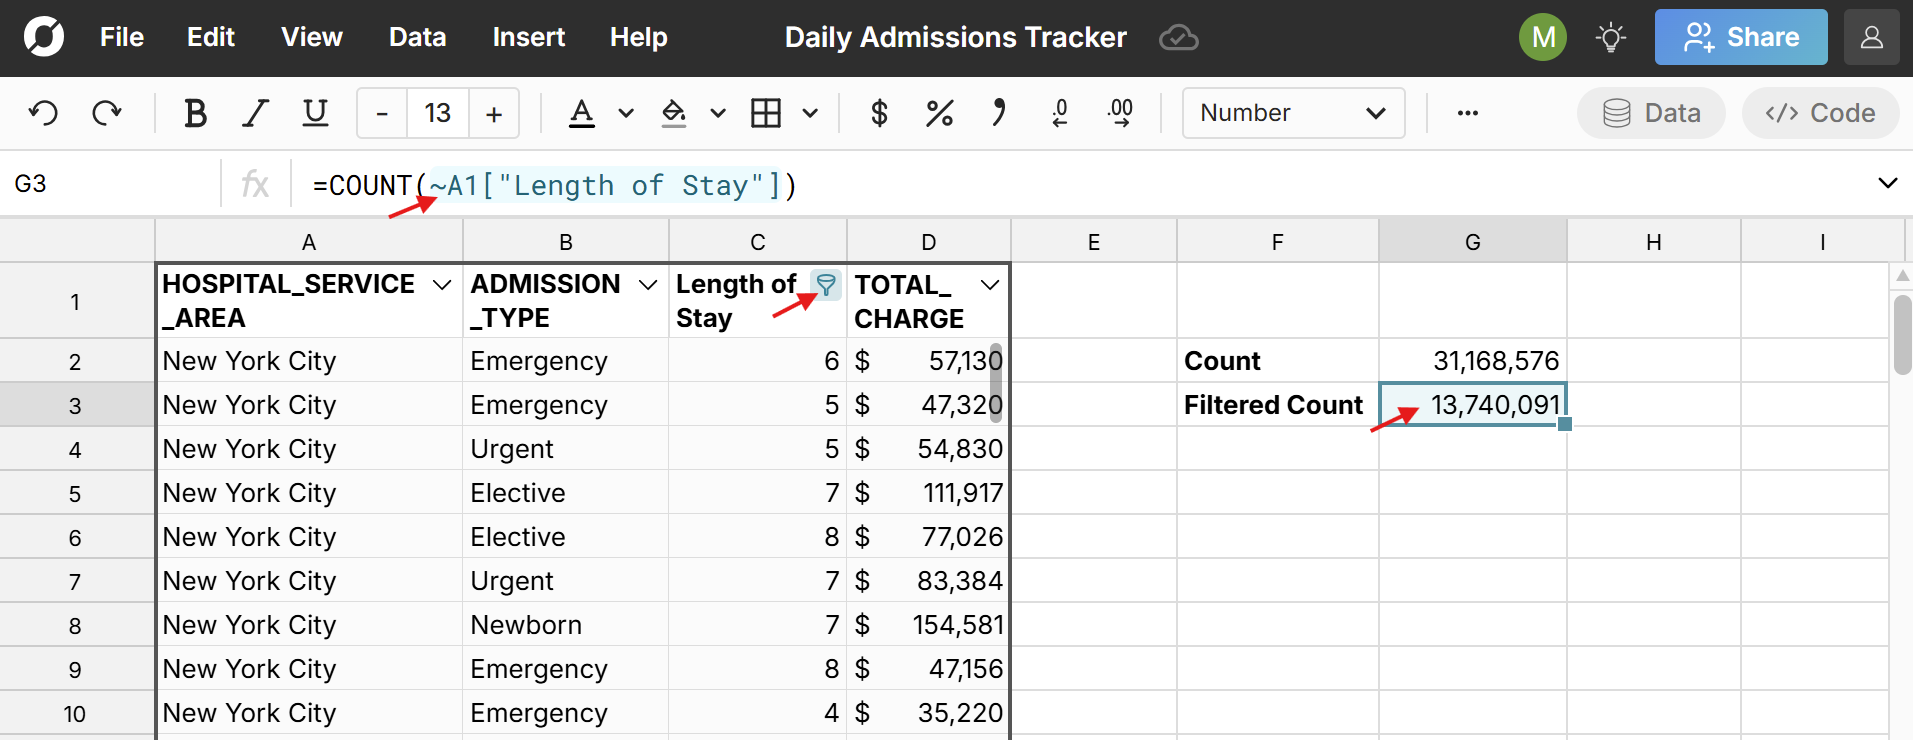
By default, functions in Row Zero ignore filters on a range. Use the tilde (~) operator immediately before a data table reference if you wish to only operate on the filtered values. See Filter and sort to learn more about the tilde (~) operator.
Pivot
Right-click on a data table and select Pivot to create a pivot table from your data table. Keep in mind that pivot tables can also be data tables, so you can pivot a pivot table.
Chart
Select cells in the data table, then go to Insert > Chart.
Charts built from a data table use whole columns as their source. To chart part of a column, explode the table first.
When charting data in a data table (pivot tables, connected tables, etc.), you have the option to select Chart columns as series. When selected, this automatically charts every column in the table as a series and automatically includes any new columns that are added as your data updates. See Charts to learn more.
Export
To export your data table, right-click and use the export options to download the table as a CSV or write back to a data connection. See Data export to learn more.