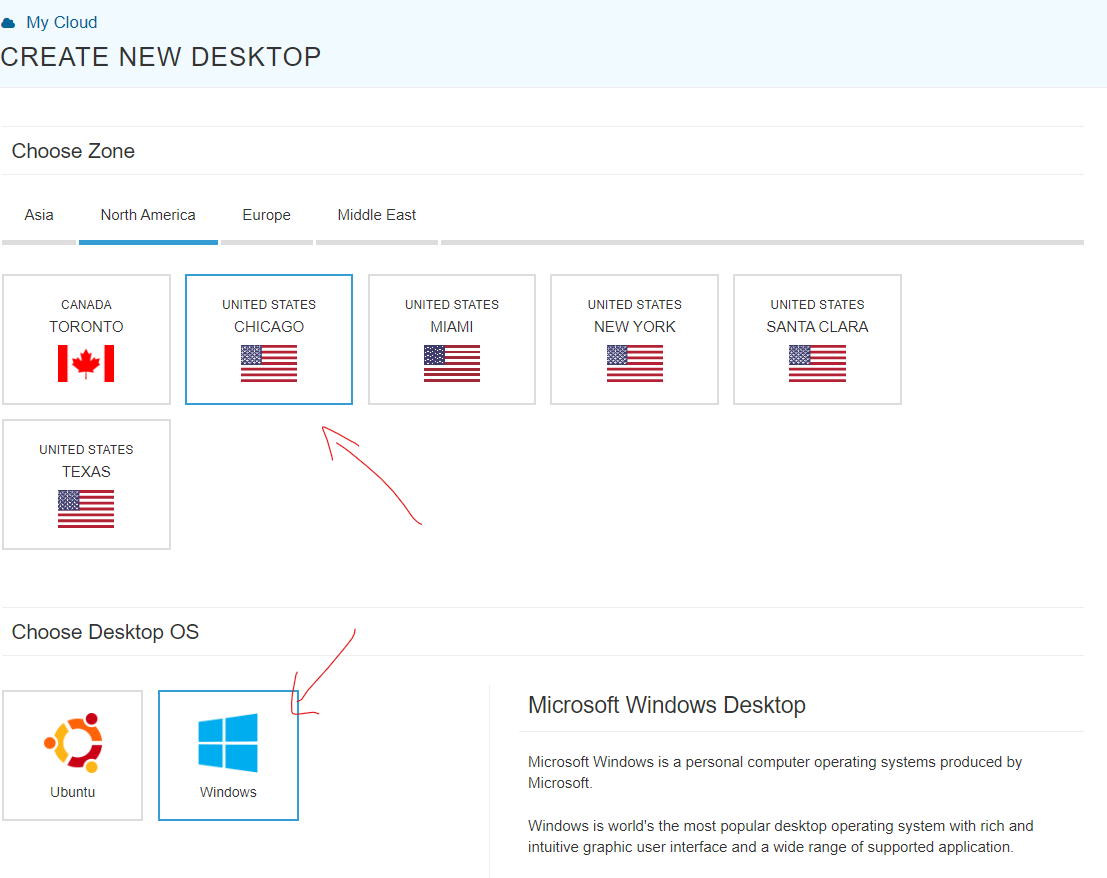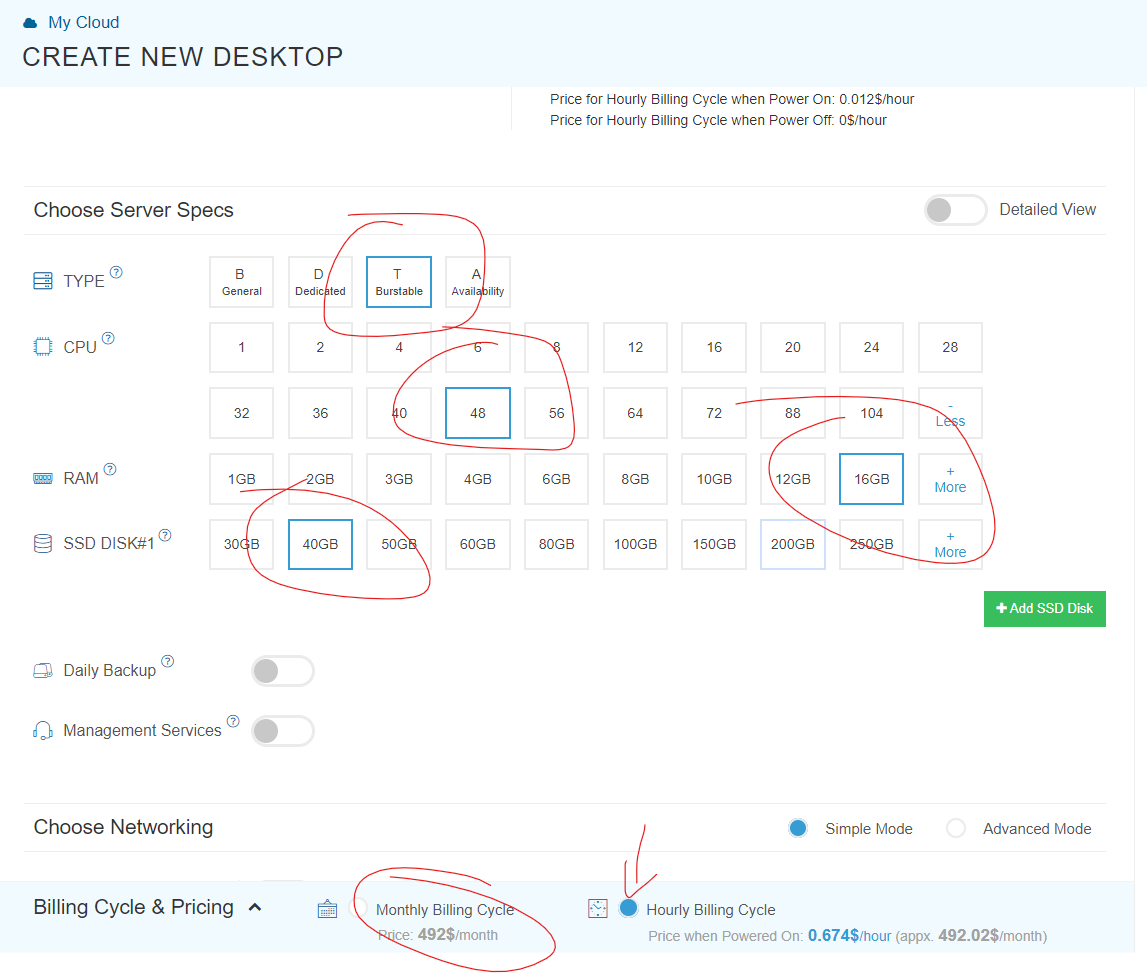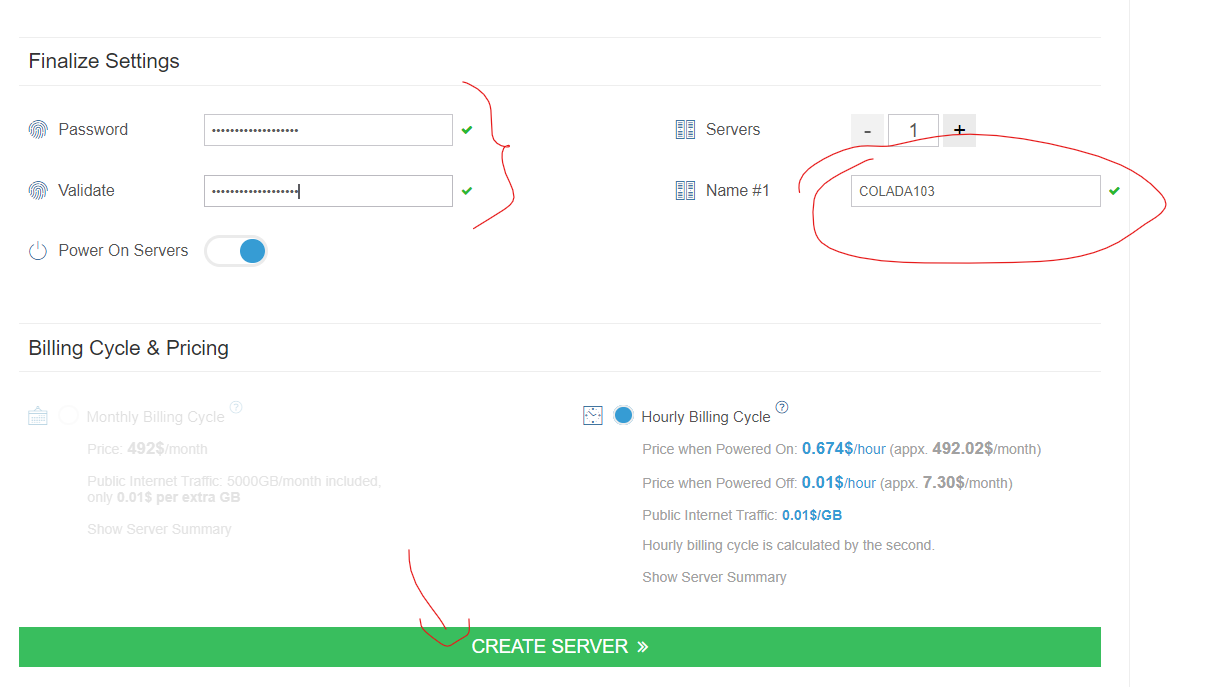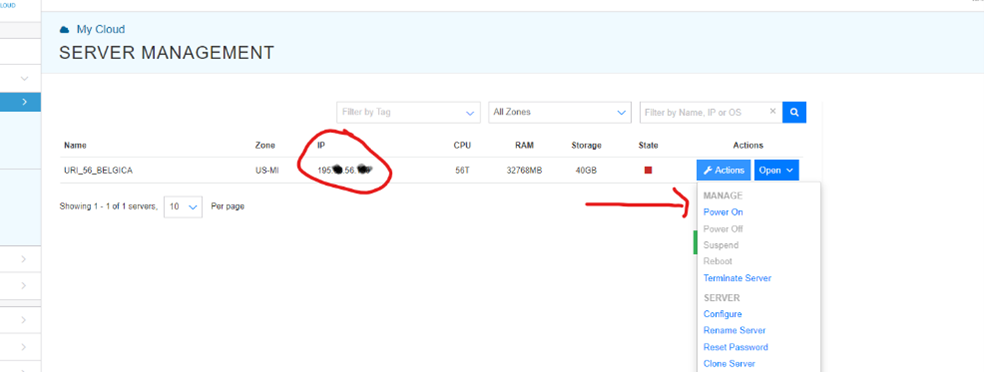
This post shows how to run simulations (loops) in R that can go 50 times faster than the default approach of running code like: for (k in 1:100) on your laptop. Obviously, a bit of a niche post.
There are two steps.
Step 1 involves running parallel rather than sequential loops [1].
This step can increase your speed about 8 fold.
Step 2 involves using a virtual computer instead of your lame laptop.
This step can increase speed about another 7 fold.
Both steps combined, then, lead to about 50 fold speed increase [2].
If you already know how to run parallel loops on a virtual desktop, check out step 2 anyway, it suggests a faster, simpler, cheaper, more flexible alternative to Amazon’s AWS.
A motivating example: simulation to evaluate whether likert scales can be t-tested
To have a concrete loop to contrast sequential vs parallel, let’s consider running simulations to see if it is OK to run a t-test on a likert scale. Specifically, the simulation generates two random samples with possible Likert values (1, 2, 3, 4 or 5), runs a t-test on these two samples, and saves the p-value. The loops repeat this simulation 8000 times, saving the p-value each time. Once all the simulations are completed, we can check how many of these p-values are smaller than .05 (should be 5%). This example is good in that it is simple and at least somewhat interesting, but the example is bad in that the simulation is not very demanding so it runs fast enough without bothering with parallel processing. This code runs in seconds. But more demanding simulation can take hours to run. In any case, the simulation would be like this:
set.seed(111)
p=c()
for (k in 1:8000) {
x1=sample(1:5 , size=30,replace=TRUE)
x2=sample(1:5 , size=30,replace=TRUE)
p[k]=t.test(x1,x2)$p.value
}
The loop produces a vector with 8000 p-values. The false-positive rate is the % of those 8000 that are p<.05. We can compute it with sum(p<.05)/8000. We obtain 4.94%. Close enough to 5%. So, turns out t-testing likert scales is fine [3].
for() is kind of a dumb loop.
Dumb in that while our computers have the capacity to do many things at the same time, we are asking it to do only one thing, one loop, at a time. Computers come with multiple core processors. To know how many your computer has you can run parallel::detectCores()
My computer has 8. But I only used 1 to learn about likert scales above.
One of my 8 processors run 8000 simulations, the other 7 did nothing.
Imagine you visit a French restaurant with your favorite cousin. The waiter takes forever to come take your order, you are getting upset till you realize there is only one waiter working. But then, you realize there are 7 other waiters, all on break. You become upset again, and quickly come up with an idea that would speed things up.

Fig 1. Visual approximation of laptop while running a for() loop
That’s right. Have all the waiters instead of only one of them do some work.
Same with R, let’s have each of the 8 cores do 1000 simulations, at the same time, instead of one core do 8000 one after the other.
Step 1. Running parallel loops in R
The figure below has annotated code for running the same loop we saw above, but in parallel.

This loop will run about 8 times faster than the for() loop, minus the fixed time cost of setting up all the parallel processing. For fast tasks, parallel processing is not worth it.
Intermediate level tips
If you start using parallel loops, these extra pieces of info may be useful
The example above saves only one result per loop, one p-value. We often want to save many numbers after each loop, for example, we may want to save the means, the t-value and the p-value. You can do that by having the result of each loop be a vector instead of a scalar. To be able to do that the only thing we change is the
.combineoption. Instead of.combine='c', which tells R to use thec()function to put all the numbers the loops output into a vector, we use.combine='rbind'to tell R to use therbind()function to put all resulting vectors produced by the loops stacked up vertically in a matrix.The example below produces a matrix, where the first two column have 8000 means each, and the third column 8000 p-values.
Fig 3. Parallel loop saving a row of data in every loop
One may also save more complex sets of reults per loop, not just scalars and vectors. For example you can save an entire data-frame or a list. For that one can use what is actually the default for foreach loops, which is to save the result of each loop as an item on a list.