
I have two maps taped to the wall above my desk.
The first is a railroad map of the United States from 1850. I bought a reproduction from the Library of Congress, $18 plus shipping. Hand-drawn lines radiate outward from the Eastern Seaboard: thick clusters around New York, Philadelphia, and Boston, thinning as they push west. A few tentative lines reach across Pennsylvania. One thin strand crosses into Ohio. Beyond that, nothing. Blank space, the western two-thirds of the continent waiting for the lines to arrive.
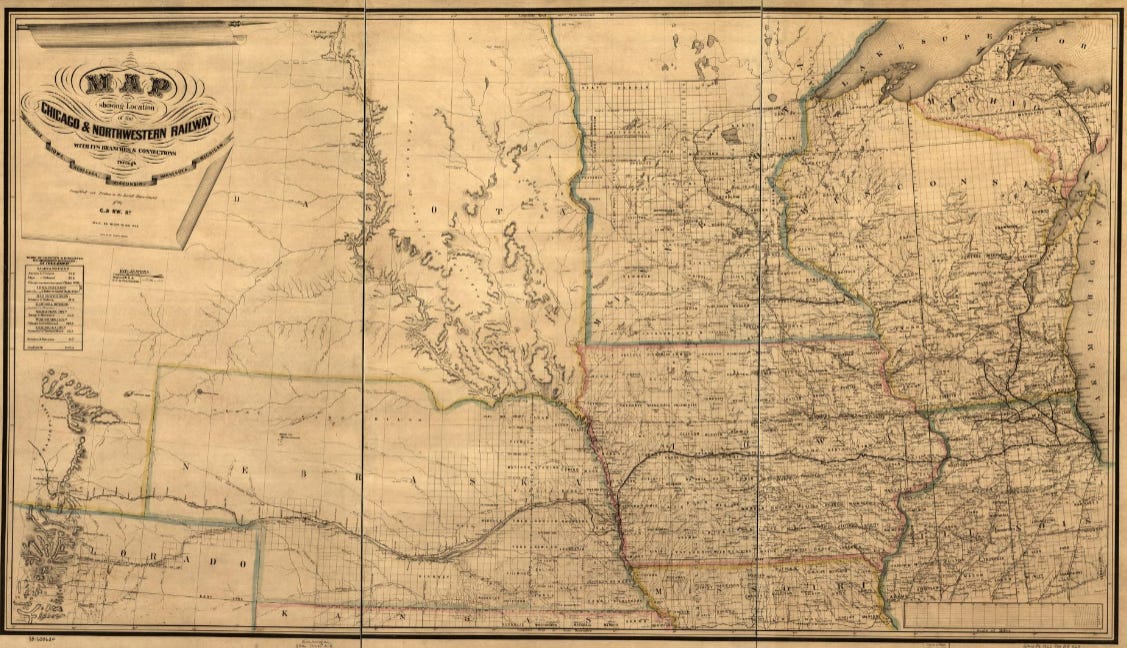
The second is a data center construction map from a CBRE market report published in early 2026. Red dots for operational facilities. Blue dots for under construction. Gray dots for planned. The dots cluster in a few specific places: Northern Virginia. Central Texas. Ohio. Georgia. A handful of smaller spots in Wisconsin, Tennessee, Oregon. Some familiar names. Some places you’ve probably never thought about.
I put these two maps next to each other about six weeks ago, and I haven’t been able to stop thinking about what they share: the logic.
The place that would become Chicago was, in 1833, a flat, marshy stretch of land at the southwestern tip of Lake Michigan. Fort Dearborn, a small military outpost, sat near the mouth of the Chicago River. The river was a sluggish, shallow thing that barely qualified as navigable. The land around it flooded on a regular cycle. Mosquitoes were a significant problem.
The population was about 200 people.
Nothing about this location suggested it would become important. It had no deep-water harbor like New York. No confluence of major rivers like St. Louis, which sat at the junction of the Mississippi and Missouri and was already a thriving commercial hub. No established merchant community like Cincinnati, which by the 1830s had earned the nickname “Porkopolis” for its dominant position in meatpacking, population 30,000 and growing. No strategic mountain pass, no mineral deposits, no obvious reason for capital to flow there rather than to a hundred other places.
In 1833, the smartest investor in America would have said Cincinnati or St. Louis. Both had natural advantages: river access, established trade networks, growing populations. Both were already attracting capital.
No one would have said Chicago.

1848: the Galena and Chicago Union Railroad completed its first line running west from Chicago. 1852: the Michigan Southern and Northern Indiana Railroad connected Chicago to the East Coast rail network. 1856: Chicago became the terminus of ten trunk lines and eleven branch railroads, more than any other city in America.
The population numbers are more efficient than any explanation I can give.
1840: 4,470.
1850: 29,963.
1860: 112,172.
1870: 298,977.
1880: 503,185.
1890: 1,099,850.
From 200 to over a million in fifty-seven years. No city in recorded history had grown that fast. None of it happened because of the location itself. It happened because of where the lines went.
William Cronon’s Nature’s Metropolis is about how Chicago was built, and it’s one of the most important books I’ve read for understanding how money moves. Cronon argues that Chicago’s rise was topological inevitability, not geographic luck.
Railroads follow freight. Freight flows from where goods are produced (the western prairies, full of grain and livestock) to where goods are consumed (the eastern cities, full of people with money). The question for any shipper in the 1840s was: where does the grain come off one rail line and go onto another? Where does the livestock get processed before heading east as packed meat?
The shape of the network determines the answer. As builders laid more rail in the 1840s and 1850s, running east-west from the prairies to the coast and north-south along the Mississippi corridor, the lines converged at specific points. The geography of the Midwest, flat and mostly unobstructed with the Great Lakes creating a natural northern barrier, funneled them toward a small number of junction points. Chicago was one. It turned out to be the most important one.
And being a junction compounds.
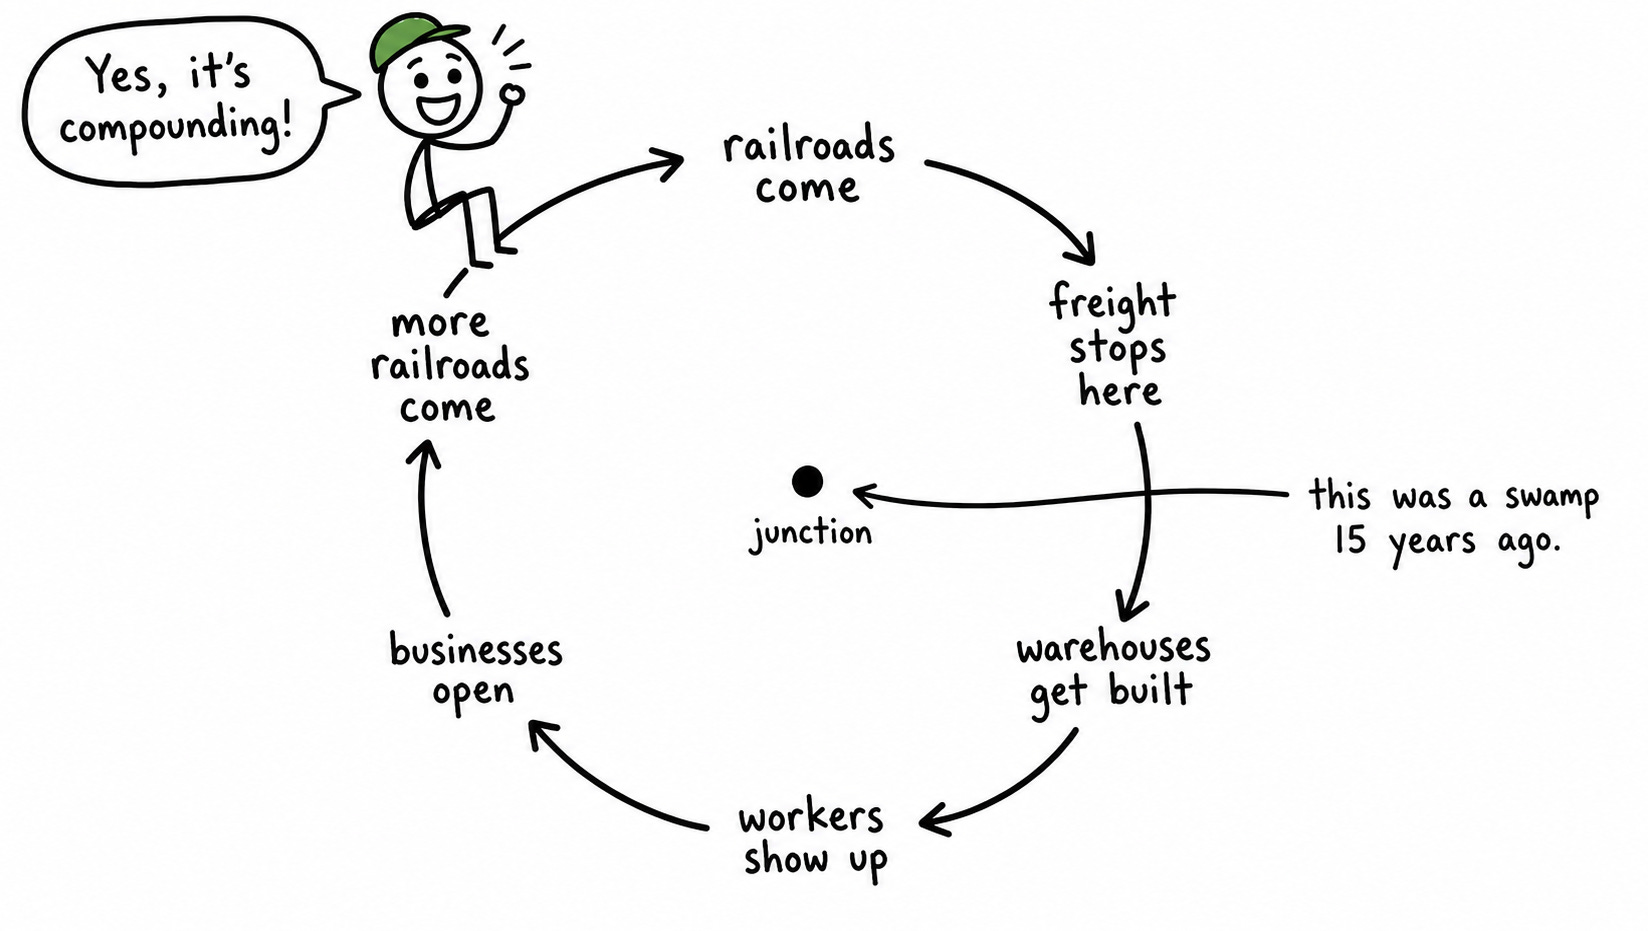
Two rail lines meet at your city. Freight has to be unloaded from one line and loaded onto another. That transfer creates demand for warehouses. Warehouses create demand for workers. Workers need housing, food, services. Services attract businesses. Businesses attract more rail lines, because rail lines follow freight, and freight goes wherever businesses are. More rail lines make the junction more central. More centrality makes the junction more valuable.
Once this loop starts, stopping it is close to impossible. Chicago became dominant because it was the first to reach criticality as a junction. After that, the loop locked in advantage faster than any competitor could close the gap.
The Chicago Board of Trade was founded in 1848, the same year the first railroad arrived. Think about that timing. The Board’s founders didn’t create it because Chicago had a long tradition of commodity trading. Chicago didn’t have a long tradition of anything. They created it because so much grain was flowing through the city that the old merchant-to-merchant system couldn’t handle volume. They needed standardized contracts. They needed a central marketplace. They needed what we now call commodity futures.
Grain futures, one of the foundational instruments of modern commodities trading, were invented in Chicago. The inventors were no smarter about finance than people in New York or London. Chicago was where the grain was. The grain was where the junction was. The junction was where the lines converged.
Financial innovation followed infrastructure topology.
For every Chicago, there’s a Cincinnati.
Cincinnati’s story is the one that should make you uncomfortable, if you own commercial real estate in a major knowledge-economy city.
In the 1840s, Cincinnati was the largest and most prosperous city in the American interior. Population 46,000 in 1840, growing fast. The meatpacking industry was enormous. Farmers drove hogs overland from Kentucky and Ohio, slaughterhouses processed them, packers salted the meat, and shippers sent it down the Ohio River to New Orleans and from there to the world. Cincinnati’s nickname, Porkopolis, was a market position.
Cincinnati’s advantage was geographic: it sat on the Ohio River, which connected to the Mississippi, which connected to the Gulf of Mexico and the global shipping lanes. In the river-commerce era, this was the equivalent of sitting on a fiber optic trunk line.
Then the railroads arrived. The railroads didn’t need the river.
Rail moved freight faster, in any direction, regardless of water routes. The relevant question shifted from “are you on the river?” to “are you at the junction?” Cincinnati wasn’t a junction. It was a river city, and the river was becoming irrelevant.
The meatpacking industry illustrates the shift with painful clarity. Chicago’s Union Stock Yards opened in 1865. Rail lines brought livestock to Chicago from a vast catchment area across the Great Plains, far larger than the overland driving range that fed Cincinnati. Within a generation, Chicago had absorbed the bulk of the meatpacking trade. Cincinnati’s facilities were fine. The infrastructure topology had changed, and in the new topology, Cincinnati’s location was a siding.
Cincinnati didn’t die. In 1870, it still ranked 8th among American cities by population, with 216,000 people. It’s a functioning city today. But the premium, the extra economic value that its location had captured, evaporated. Cincinnati went from the interior’s dominant commercial hub to a mid-tier regional city. The businesses that had located there because of its river advantages relocated to wherever the new infrastructure logic favored.
St. Louis tells a similar story, with a darker twist. St. Louis was the gateway to the West via the Mississippi, and its civic leaders knew the railroads were coming. They had time to respond. They made a choice that, in retrospect, was catastrophic: they invested in river infrastructure. They doubled down on the system that had made them rich. They could not imagine that railroads would make the river irrelevant for overland freight.
By the time St. Louis pivoted to railroads, Chicago had already captured the junction position. St. Louis in 1870 still ranked 4th in the country, population 310,000. But the trend was set. The city with every natural advantage, with the established relationships and existing investment, lost to a swamp. The swamp was where the new lines crossed.
St. Louis’s mistake was path dependency. The infrastructure they’d built, the commercial relationships they maintained, the capital they’d invested, all of it said: the river is the thing. The river was the thing. Until the railroads made it a secondary channel.
Infrastructure creates nodes. The places where new infrastructure converges, junctions, hubs, transfer points, capture disproportionate value. The reason is position in the network, not inherent quality.
Investors, workers, and commercial activity flow toward the junction points. This creates a feedback loop: more capital makes the node more valuable, which attracts more capital. Chicago’s grain futures market, its meatpacking industry, its manufacturing base, all of these grew downstream of the junction.
Old nodes lose their premium. The places that were valuable under the old infrastructure don’t disappear. But the scarcity premium they captured, the extra value from being the place to do business, erodes. Cincinnati in 1890 was still a functioning city. It was no longer Porkopolis.
This pattern has repeated for every major infrastructure transition in American history. Canals made New York dominant (the Erie Canal, 1825). Railroads made Chicago dominant (1850s-1860s). The highway system made suburbs possible (1950s-1960s) and redistributed retail and residential value away from urban cores. Fiber optics made Northern Virginia the internet’s physical hub (1990s-2000s), because that’s where undersea cables landed and early government networks interconnected.
The infrastructure creates the topology. The topology creates the nodes. The nodes capture the value. And the people who owned assets in the old nodes, confident the premium would last, discovered that premiums expire.
I keep staring at this data center map from 2026. The one with the colored dots.
Virginia leads the country with over 600 operational data centers and another 136 under construction. Most of these cluster in Northern Virginia’s “Data Center Alley,” centered on Ashburn and Loudoun County. This region handles something like 70% of the world’s internet traffic. It became the most important digital infrastructure hub on earth for the same reason Chicago became a railroad junction: early fiber optic networks converged there, and once the junction formed, the feedback loop took over.

Texas has 413 data centers operating today, with 140 more under construction. Texas is projected to surpass Virginia as the largest data center market by 2030. Cheap electricity, abundant land, fast permitting, no state income tax, and a power grid (ERCOT) that, whatever its other problems, allows rapid connection of new load. The $100 billion Stargate campus in Abilene is scaling past 1 gigawatt of power capacity across eight buildings. Abilene. Population 125,000. A city most Americans couldn’t place on a map.
Then there’s the layer that caught my attention: 64% of all data center capacity under construction sits in what the industry calls “frontier markets.” Places like Ohio, Wisconsin, Tennessee, Georgia, and Indiana. Places that, in the data center world five years ago, were nowhere. Small towns with cheap power and available land are becoming the next generation of infrastructure nodes.
I see Chicago.
A swamp no one cared about, becoming the most important place on the map because the lines converged there. The physics of the infrastructure, where the power is, where the water is, where the land is, funneled the investment toward specific points.
Abilene, Texas. Prineville, Oregon. New Albany, Ohio. These are the 1840s Chicagos. They have no inherent importance. They have no tradition of being technology hubs. They have cheap electricity, water, available land, and permissive zoning. In the data center topology, these are the junction points. Capital is flowing toward them at a velocity that the local populations are beginning to process.
The data doesn’t say what I expected it to say, and the honest version is more interesting than the simple one.
The simple version would be: “AI enables remote work, so expensive office cities lose value.” That story is clean, and it’s incomplete in a way that matters.
San Francisco’s office vacancy rate hit 37% in early 2024. A ghost town. The pandemic had emptied the offices, and tech companies weren’t coming back. The obituaries were written.
Then AI happened. OpenAI leased a million square feet across Mission Bay. Anthropic secured over 600,000 square feet on Howard Street. AI companies accounted for three-quarters of the city’s net absorption. By Q2 2026, San Francisco’s vacancy rate had dropped to about 30%, the fastest improvement of any major city in the country. Mission Bay ran out of space.
AI didn’t kill San Francisco. It resurrected it. At least, it resurrected the parts of San Francisco where AI companies want to be.
But it resurrected them selectively. The submarkets near AI company headquarters (Mission Bay, SoMa, the Financial District) tightened. Others barely moved. Some are still over 30% vacant. A specific piece of San Francisco recovered, because that piece sits at a node in the AI topology, the place where the talent, the companies, and the network effects compound.
The rest of San Francisco is still on the wrong side of the map.
Manhattan’s version of the same story: vacancy dropped to 13.1% by Q1 2026, well below the national average of 17.8%. AI companies are leasing aggressively. Trophy buildings in Midtown and the Plaza District are full, commanding rents approaching $200 per square foot. Class B buildings in less desirable locations? Vacancy above 20%. The market isn’t recovering. It’s splitting. Trophy assets at network nodes are tightening. The rest is drifting.
The railroad parallel translated into commercial real estate: Chicago didn’t make every city more valuable. It made the junction more valuable, and made the non-junctions less so. AI is redrawing the topology, creating new nodes where AI talent and compute converge, draining value from locations that don’t sit on the new lines.
The data center map and the office recovery data are the surface. There’s a deeper layer that I think most real estate investors aren’t seeing.
Every previous infrastructure transition rewired the social geography alongside the economic geography. Railroads moved people, not just freight. The cities that became junctions didn’t just get richer; they became new kinds of places. Chicago in 1890 was not a bigger version of the trading post at Fort Dearborn. It was a dense, industrialized, ethnically diverse, politically volatile, culturally generative urban organism. The junction attracted everything: labor, culture, conflict, innovation. The junction became the center of gravity for a new form of civilization.
I think we’re in the early stages of a similar reorganization, and the data center map is the first indicator.
AI compute requires specific physical conditions: power, cooling, connectivity. Those conditions exist in specific places. Capital flows to those places. Capital brings jobs, not factory jobs, but data center construction, operations, maintenance, security, and the local services that support them. Jobs bring people. People bring demand for housing, retail, education.
Meanwhile, the output of those data centers, the AI itself, enables a different kind of geographic redistribution. If AI coordination tools let a team of five do the work of fifty, and if those five don’t need to be in the same room, then the economic logic that justified the extreme density of Manhattan, San Francisco, and London weakens. The shift won’t happen overnight. But the direction is set.
The premium that these cities command, $78 per square foot for Class A office space in Manhattan, $200+ for trophy buildings, rests on a specific assumption: you need to concentrate knowledge workers in physical proximity to generate outsized value. That assumption drove commercial real estate pricing for the knowledge-economy era. It held true when the critical resource was human-to-human interaction: brainstorming, mentoring, deal-making, the ambient information transfer that happens when smart people share physical space.
If AI handles an increasing share of the information processing, coordination, and analysis that justified the density premium, the assumption weakens. I don’t know how fast. The data is too early, the transition too incomplete. But the railroad precedent suggests that geographic premiums, once they start eroding, erode faster than anyone expects. Cincinnati’s civic leaders in 1850 were confident the river advantage was permanent. They had data to support that confidence. The data described the past accurately and the future incorrectly.
If you had looked at the railroad map of 1850 and understood the junction logic, three bets would have outperformed most other investments available in America over the following fifty years.
Buy land at the junctions before capital arrives. Chicago land that sold for close to nothing in the 1830s was worth fortunes by the 1870s. The early investors in Chicago real estate, the ones who understood that the junction effect would compound, earned returns that dwarfed anything available in Eastern financial markets. The same logic applied to smaller junctions: Indianapolis, Kansas City, Omaha. Each place where multiple rail lines converged experienced a version of the Chicago story at smaller scale.
Build the commercial infrastructure the junction needs. The Chicago Board of Trade. The Union Stock Yards. The grain elevators, warehouses, hotels. These bets weren’t speculative wagers on an uncertain technology. They were bets on certain demand, because once a junction exists, the commercial activity it generates is locked in. The junction needs processing capacity. Processing capacity needs physical infrastructure. The infrastructure earns returns as long as the junction remains active.
Reduce exposure to old-node premiums. Cincinnati riverfront property. St. Louis warehouse districts built for river commerce. These assets didn’t go to zero. But their premiums eroded as the new infrastructure topology redirected commercial activity to new nodes. The investors who held on, confident that the river would always matter, were right about the river (it still exists) and wrong about the premium (it evaporated).
Apply these bets to the 2026 map.
The new junctions are forming where cheap power, water, fiber, and permissive regulation converge. Some of these are existing tech hubs that happen to sit on the right topology (Northern Virginia). Some are places no one in commercial real estate has on their radar (Abilene, New Albany, rural Wisconsin). The early investors in real estate and infrastructure at these new nodes, the people buying land and building power capacity before the next wave of data center construction arrives, are making the 1840s Chicago bet.
The commercial infrastructure the new junctions need, power generation, cooling systems, fiber networks, worker housing, logistics facilities, is the 2026 equivalent of grain elevators and stockyards. These are infrastructure bets with demand locked in by lease commitments and power purchase agreements.
And the premiums of old-node assets, the $200-per-square-foot trophy offices in cities whose value proposition was “this is where the smart people sit close together,” these premiums may or may not erode. San Francisco’s AI-driven recovery suggests that some knowledge-economy cities will find a new role in the AI topology (the way New York, which was a canal city, managed to also become a railroad hub and then a financial center). Others may not.
The question I’d be asking if I had significant commercial real estate exposure in a traditional knowledge-economy city: is my asset on the new map, or on the old one? Is the premium I’m paying for this location based on a topology that’s strengthening, or one that’s being redrawn?
St. Louis’s leaders asked themselves a version of this question in the 1850s. They answered it with confidence. They answered it incorrectly. They were smart people who had made a fortune on the old map and could not see the new one.
I keep going back to the two maps on my wall.
The 1850 map is gorgeous. Hand-drawn, precise, radiating confidence about a system still being built. Each line represents someone’s capital at risk. Someone looked at the terrain, looked at the freight routes, looked at the population centers, and decided: the line goes here. Some of those decisions were brilliant. Some were catastrophic. The lines that converged on Chicago minted fortunes. The lines that dead-ended at river towns consumed capital and returned nothing.
The 2026 map is ugly. A corporate slide deck, colored dots, no elegance. But it encodes the same type of information. Each dot is someone’s capital at risk. Each cluster of dots is a bet about where the new infrastructure will converge. The clusters in Virginia and Texas are the equivalent of the thick lines radiating from New York and Philadelphia in 1850: established, obvious, already attracting the bulk of the capital. The scattered dots in Ohio, Wisconsin, Georgia are the early, tentative lines pushing west into unknown territory. Some of them will converge into the next Chicago. Some will dead-end.
The 1850 map, read correctly, would have told you: buy Chicago, sell Cincinnati. The reason had nothing to do with either city’s character or ambition. It had to do with where each sat in the network.
I think the 2026 map is saying the same thing. The network is different, compute infrastructure instead of railroads. The logic is the same. Capital follows infrastructure. Infrastructure redraws geography. Geography reprices the assets sitting on it.
This has been true for two hundred years. I see no reason it stops now.
The question is whether you’re reading the map. Most of the investors I talk to are reading the earnings reports, the model benchmarks, the API pricing comparisons. They’re asking which AI company will win. They’re not asking which geography will win.
The railroad investors who asked “which railroad company will win?” lost money, on balance. The ones who asked “which city becomes the junction?” made it.
I think the same split is coming for AI. And the answer, like it was in 1850, is sitting right there on a map.
You just have to tape it to your wall and look at it long enough.
No posts
Comments
Nothing yet. Say the first thing.
Sign in to join the conversation.