
Hello folks,
In this post, I just want to mention how important it is to show who you are through the way you create. Never underestimate care, creativity and imagination. So I decided to share on Substack an older post about something personal and very close to my heart.
👉 A full, step-by-step walkthrough on 𝗛𝗼𝘄 𝘁𝗼 𝗕𝘂𝗶𝗹𝗱 𝘆𝗼𝘂𝗿 𝗖𝗩 𝘂𝘀𝗶𝗻𝗴 Tableau.
People underestimate how much a hiring manager appreciates effort, creativity and proof of skill.
Not because a fancy CV guarantees a job.
But because, for a hiring manager, it answers a deeper question:
‘𝗜𝗳 𝘁𝗵𝗶𝘀 𝗽𝗲𝗿𝘀𝗼𝗻 𝘁𝗿𝗲𝗮𝘁𝘀 𝘁𝗵𝗲𝗶𝗿 𝗼𝘄𝗻 𝘀𝘁𝗼𝗿𝘆 𝘄𝗶𝘁𝗵 𝘁𝗵𝗶𝘀 𝗺𝘂𝗰𝗵 𝗰𝗮𝗿𝗲… 𝗶𝗺𝗮𝗴𝗶𝗻𝗲 𝘄𝗵𝗮𝘁 𝘁𝗵𝗲𝘆 𝗰𝗮𝗻 𝗱𝗼 𝗳𝗼𝗿 𝘁𝗵𝗲 𝗰𝗼𝗺𝗽𝗮𝗻𝘆.’
And I’ve seen this personally.
So many hiring managers opened the interview asking me about my Tableau CV.
It opened many doors.
Not because someone will hire you just for this.
But because if you were the one reviewing candidates you would absolutely 𝗴𝗶𝘃𝗲 𝗮 𝗳𝗲𝘄 𝗲𝘅𝘁𝗿𝗮 𝗽𝗼𝗶𝗻𝘁𝘀 𝘁𝗼 𝘁𝗵𝗲 𝗽𝗲𝗿𝘀𝗼𝗻 𝘄𝗵𝗼 𝗱𝗮𝗿𝗲𝗱 𝘁𝗼 𝗽𝗿𝗲𝘀𝗲𝗻𝘁 𝘁𝗵𝗲𝗶𝗿 𝘀𝗸𝗶𝗹𝗹𝘀 𝘄𝗶𝘁𝗵 𝗰𝗹𝗮𝗿𝗶𝘁𝘆, 𝗶𝗻𝘁𝗲𝗿𝗮𝗰𝘁𝗶𝘃𝗶𝘁𝘆, 𝗮𝗻𝗱 𝗶𝗻𝘁𝗲𝗻𝘁𝗶𝗼𝗻.
And that’s the whole point:
𝗧𝗼 𝘀𝗵𝗼𝘄 𝘄𝗵𝗼 𝘆𝗼𝘂 𝗮𝗿𝗲 𝘁𝗵𝗿𝗼𝘂𝗴𝗵 𝘁𝗵𝗲 𝘄𝗮𝘆 𝘆𝗼𝘂 𝗰𝗿𝗲𝗮𝘁𝗲.
If you want to follow the journey, learn, be inspired, or simply see how far creativity can go in analytics, you can find my newsletter and subscribe here:
Using Tableau (and Tableau Public for uploading) to showcase your portfolio demonstrates your expertise in data visualization, storytelling, and analytics, which are essential skills for the role. Incorporating Tableau dashboards or visualizations into your CV showcases your technical proficiency in using this tool.
It highlights your ability to create interactive visualizations, and derive insights, which can be very appealing to potential employers.Using Tableau to create your CV stands out among traditional CVs.
It can make your application memorable and unique, leaving a lasting impression on recruiters or hiring managers who are often inundated with conventional resumes.Tableau offers interactivity and engagement through its dashboards.
Incorporating interactive elements in your CV allows the recruiter to interact with your data visualizations, providing them with a more immersive experience, which can set you apart from other candidates.
Your Tableau-based CV can serve as a portfolio demonstrating your previous projects, data visualization skills, and the impact you’ve made in your previous roles.
Using Tableau for your CV demonstrates your fantasy and inclination toward innovation and staying updated with the latest trends in data visualization and analytics.
While creating a CV with Tableau can be impressive, it’s essential to ensure that the visualizations are clear, easy to understand and relevant to the job you’re applying for.
Balance creativity with readability and relevance to make a compelling case for your candidacy as an analyst.
Below I’ll demonstrate Step-by-step the way I’ve created mine. Perhaps there’s space for improvement.
Tableau Public accepts only extracts as data source type (live or extract).
We have to create our personal data in cloud sheets (One Drive in our example, you can also use GSheets) and load them using the appropriate connector. You can choose the names and the type of content you want to include in your CV. I’ve created files for skills, experience, interests, personal data, etc., as seen below.
Experience:
Choose the names and the content you want to showcase for your experience. I’ve included the links for companies and universities.

Personal Data:
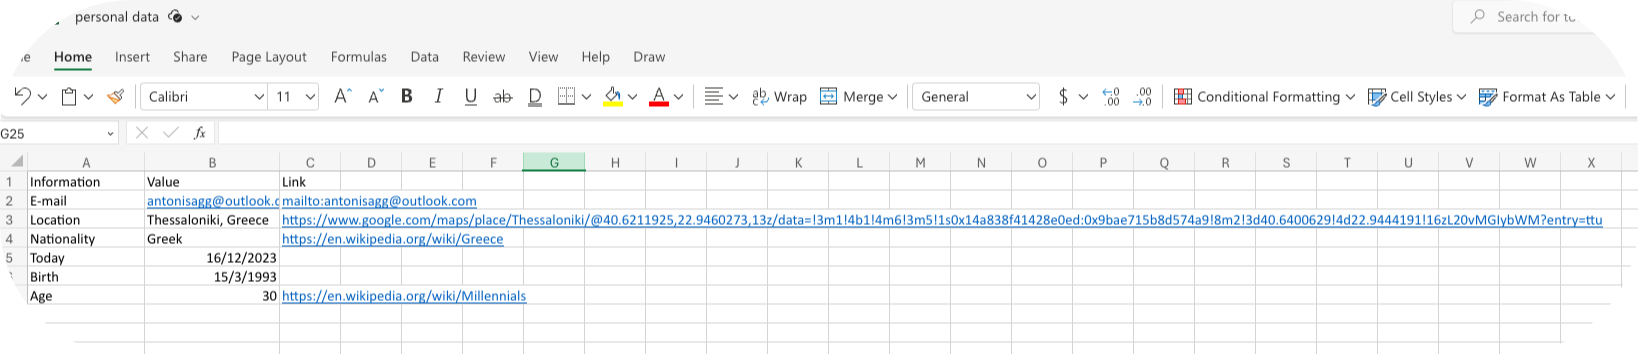
Here, we list our personal information. I chose email, location, nationality, and age. I also incorporated today’s date, birthday data in order to calculate the age integer (with div formula) every time the extract is refreshed.
Skills:
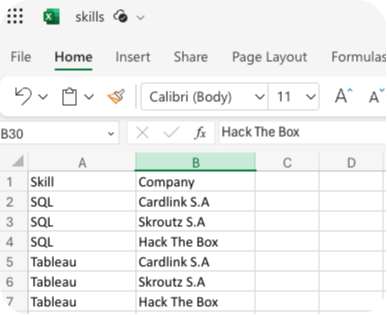
To provide the functionality of filtering the skills per company with dashboard actions, create the skills file including the name of the company in a tall data format.
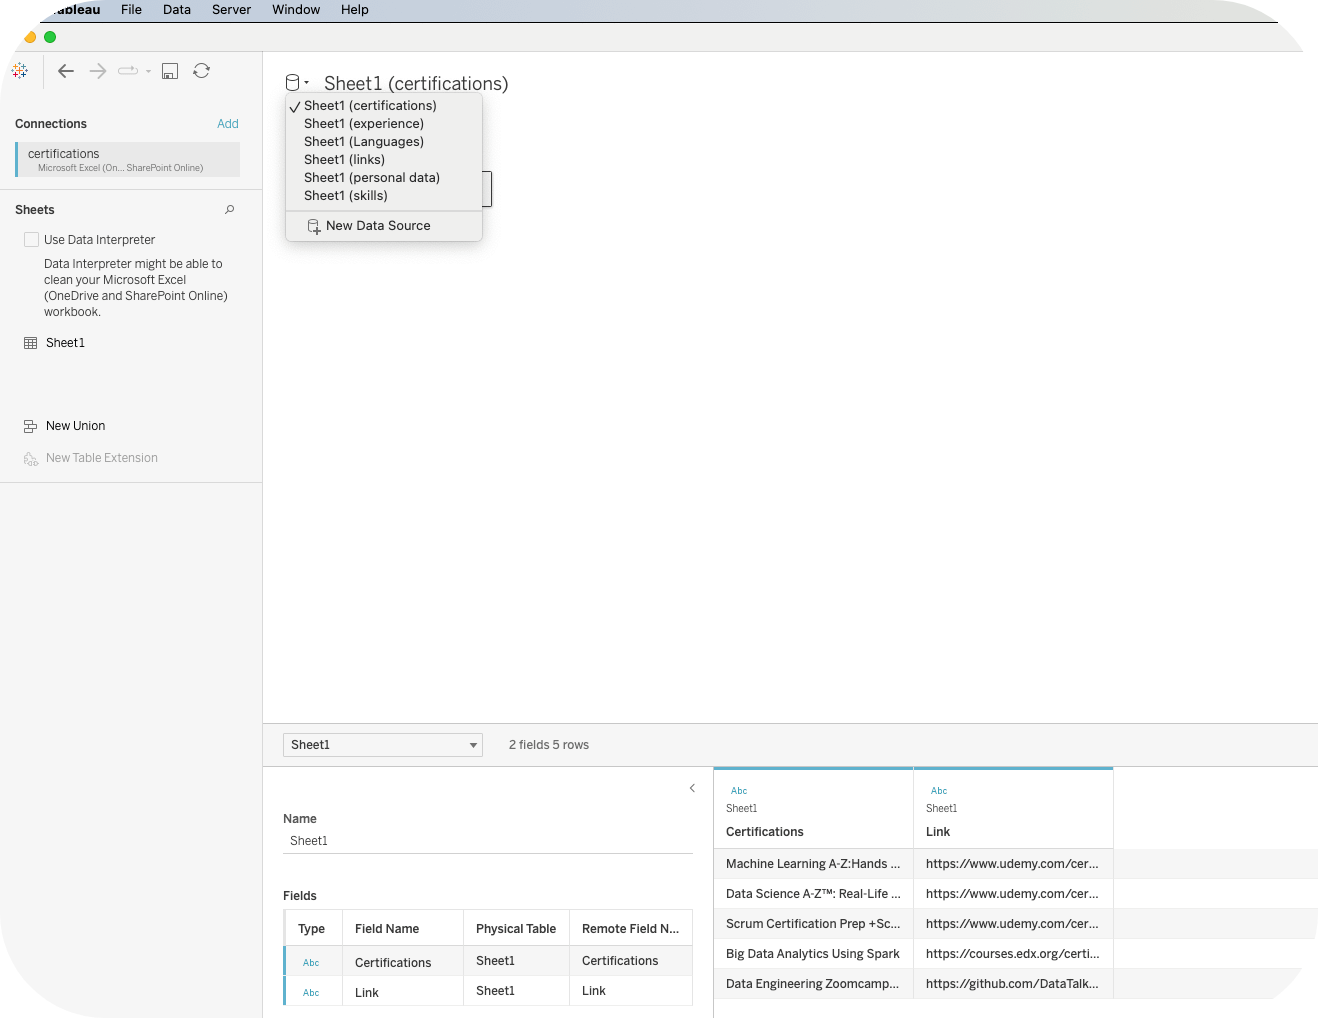
Create a separate data source for every Excel file. I chose to create a new Excel file and not a new sheet (in the same doc) for every table I need. Feel free to migrate all your data into a single document.
The type of content you want to include is up to you and your preference. Of course, there are some basic guidelines and things to avoid. In my case, I chose to include:
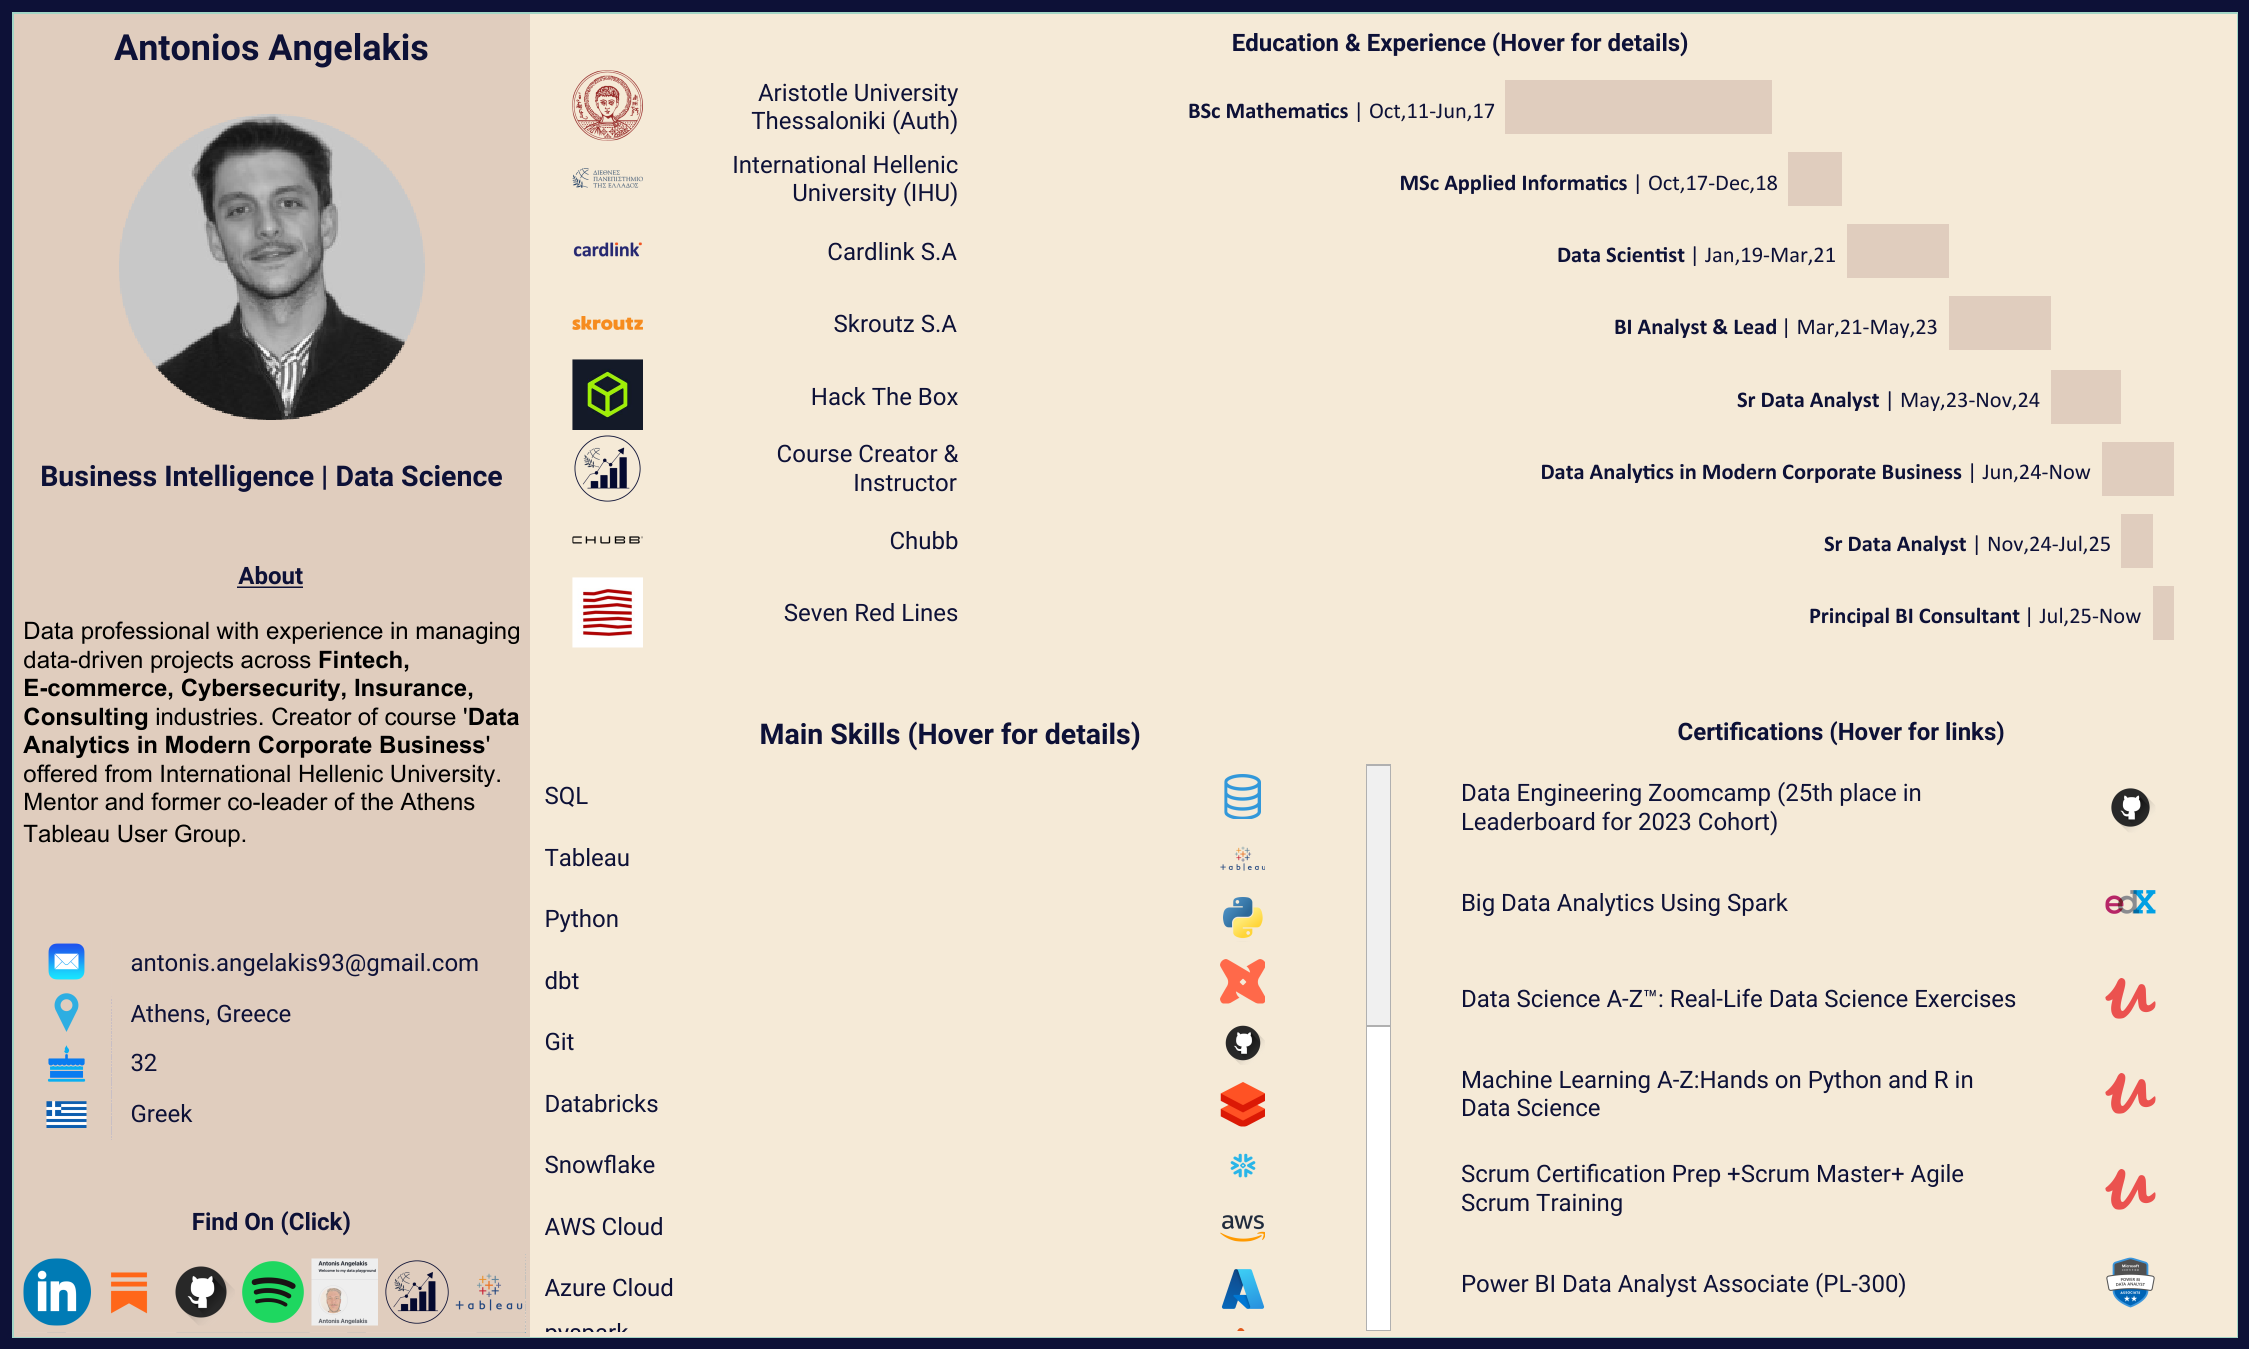
Photo in the upper left corner along with a short text.
Personal details below the photo.
In the bottom left corner, we’ll find clickable logos for LinkedIn, GitHub, etc. The dashboard consists of 3 vizzes:
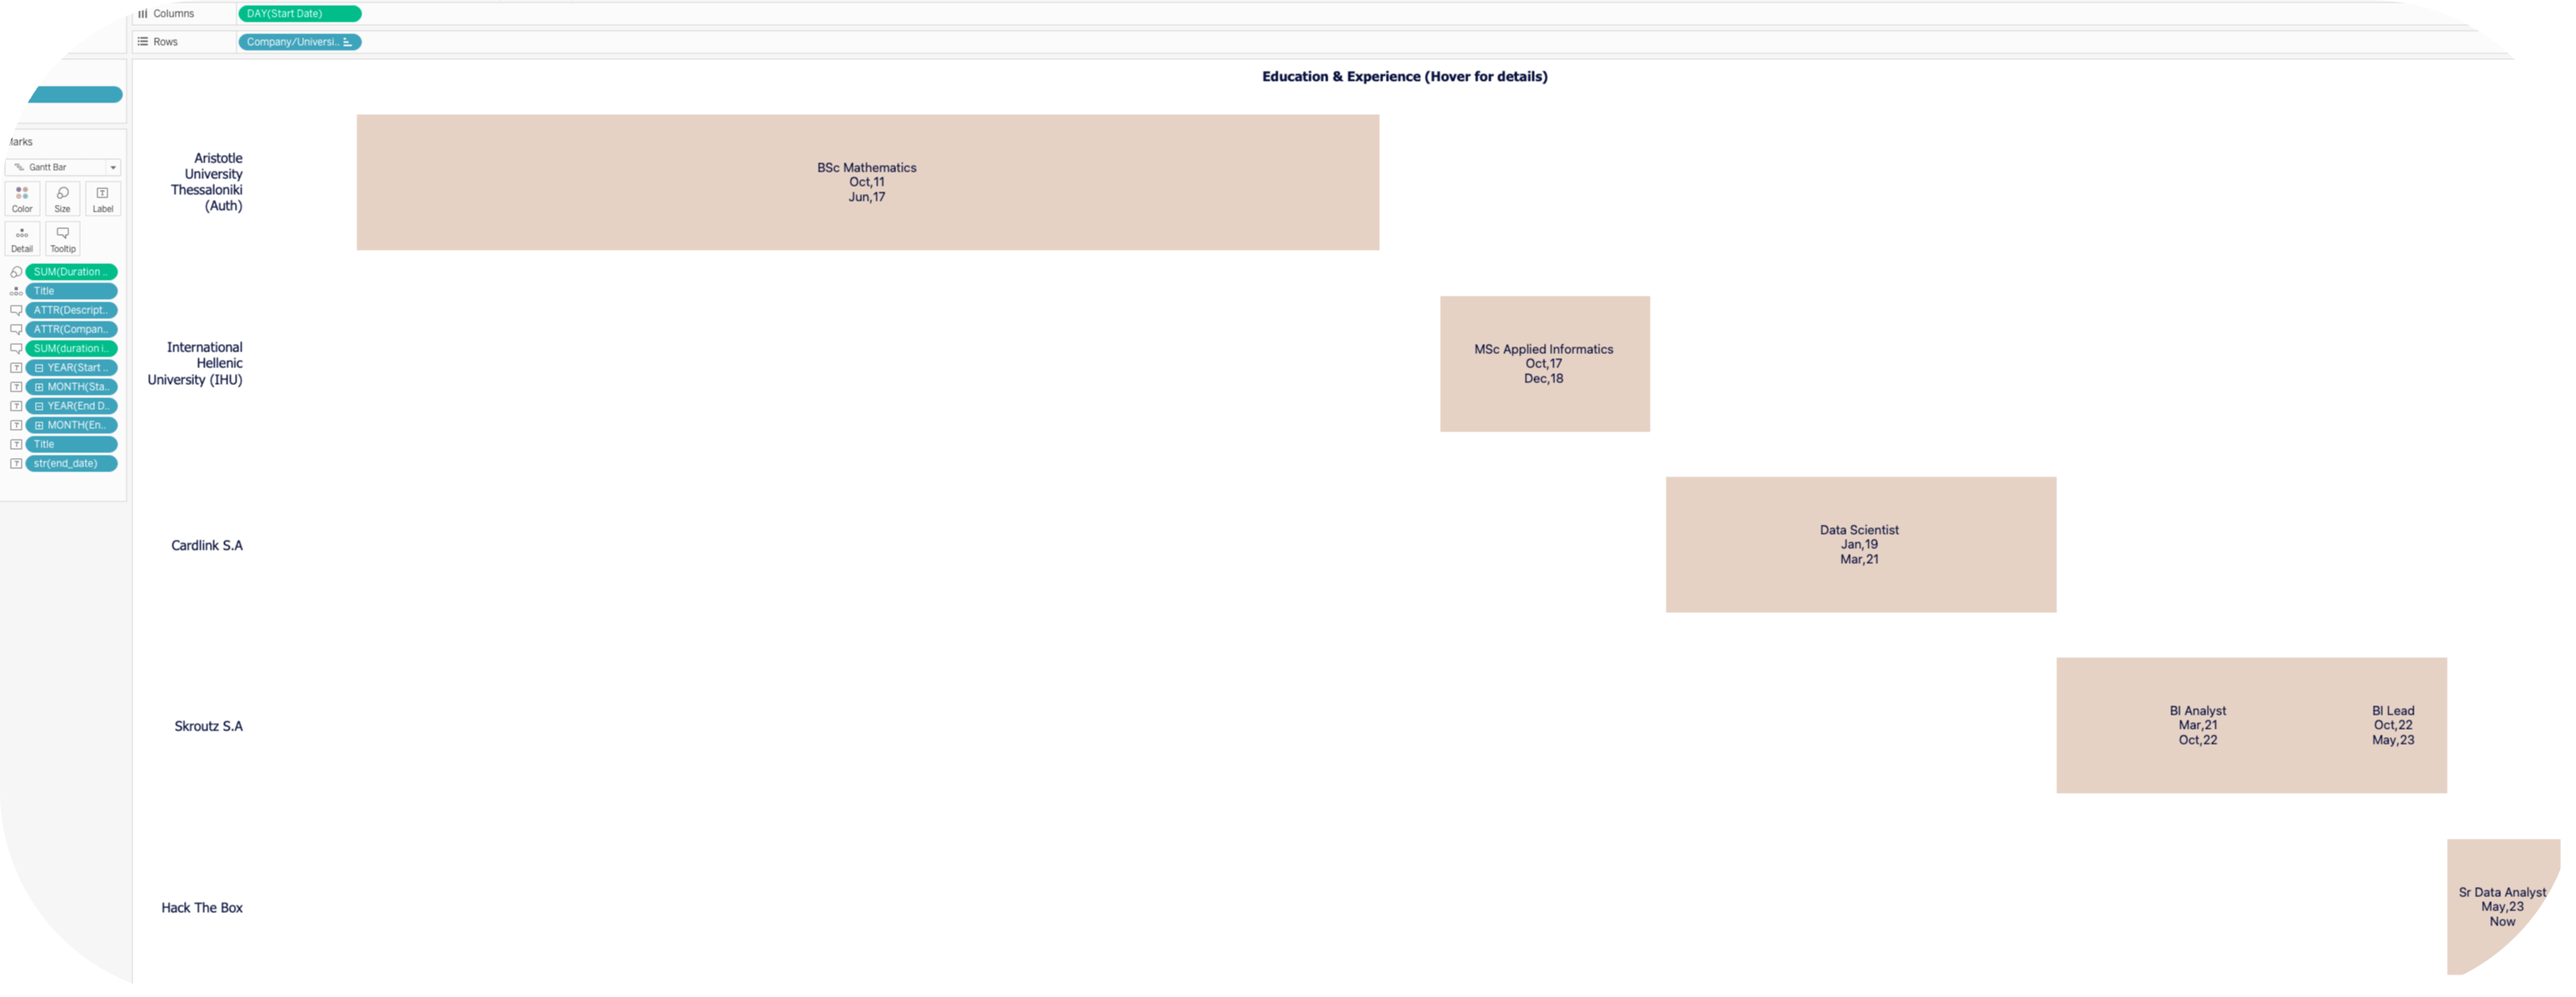
Education & Professional experience visualized with a Gantt chart. The Gantt chart includes details when hovering to showcase each role’s achievements and details.
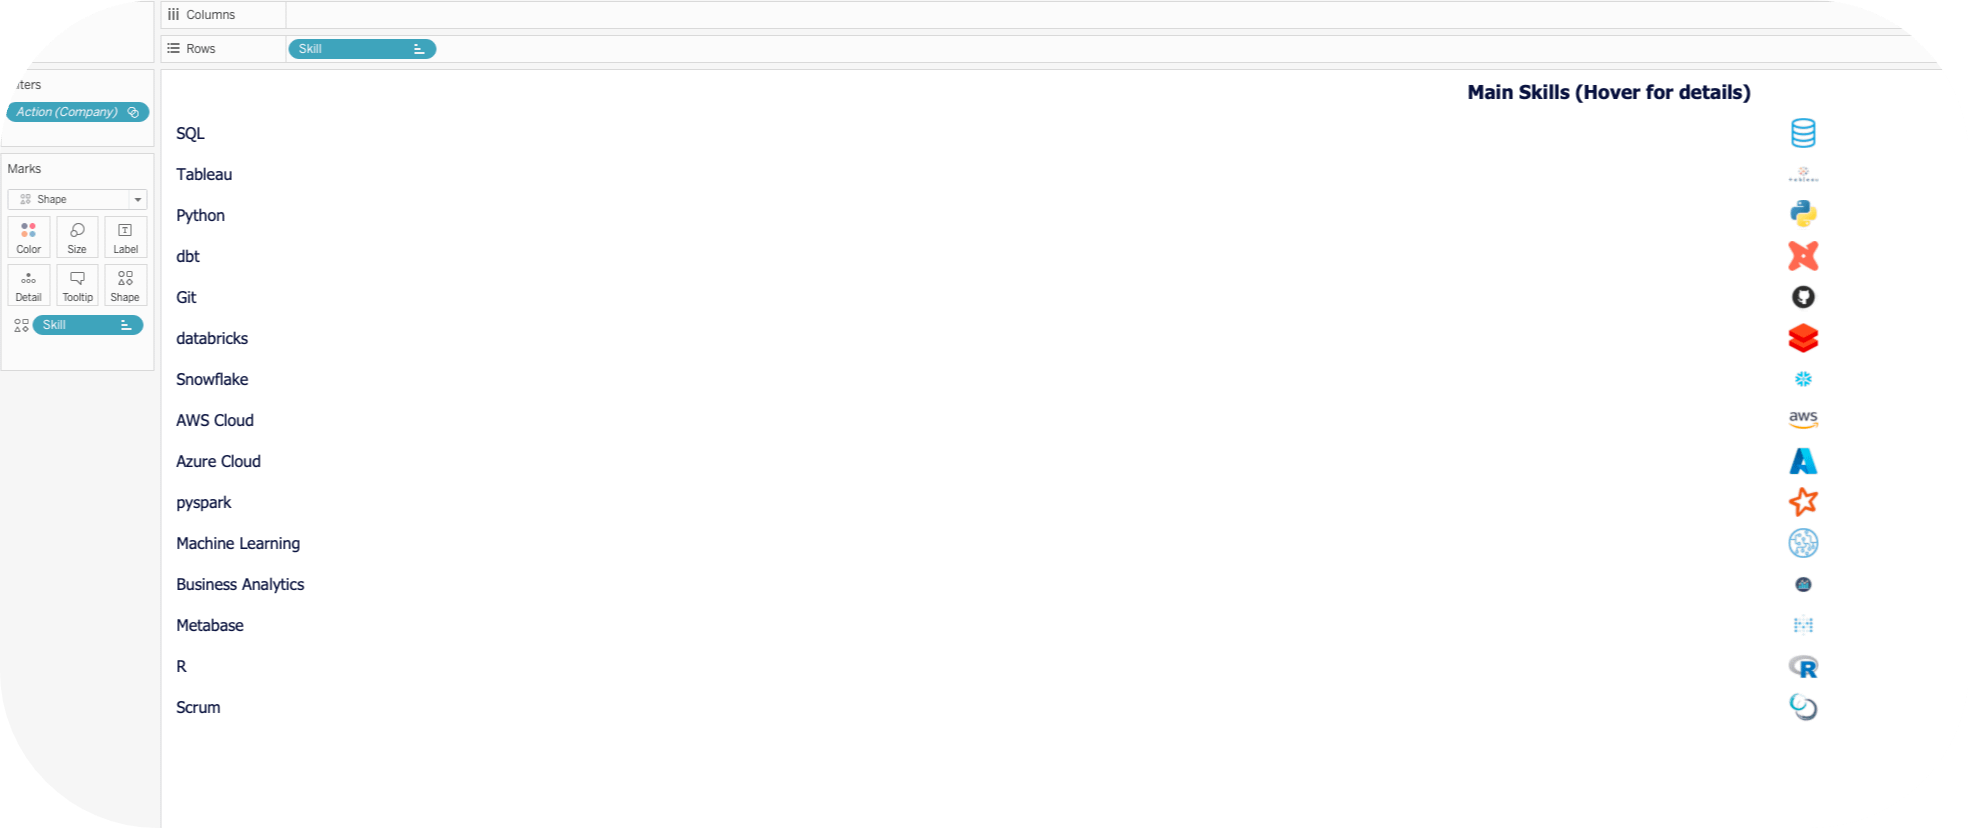
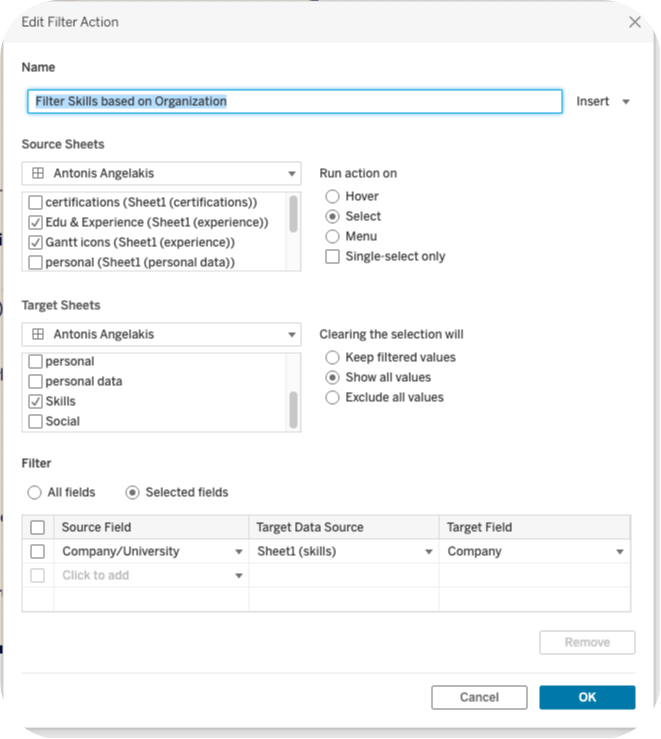
Skills that can be filtered when the user clicks each role’s bar. The list will then filter out only the skills and technologies used in each role based on the company’s tech stack and projects.
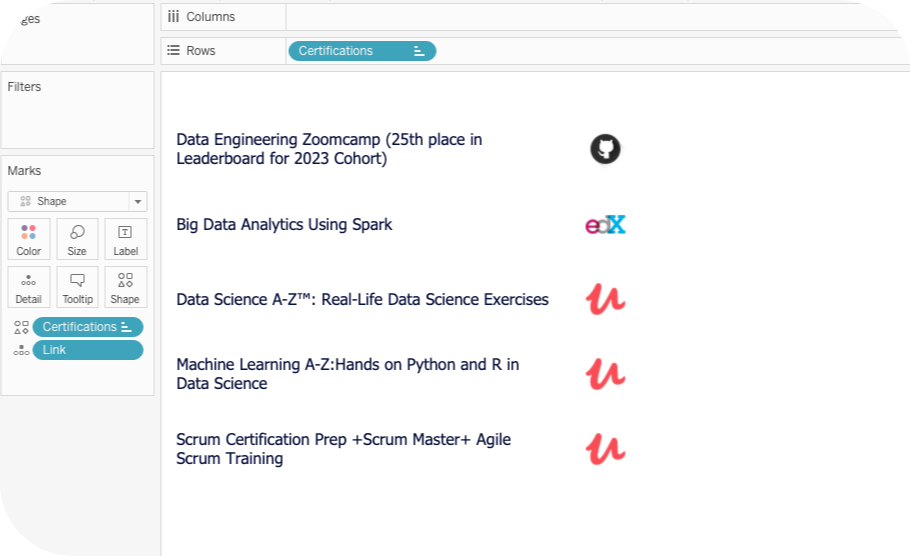
Certifications along with clickable logos for each provider that redirects the user to the corresponding certification’s link.
The workbook demonstrates some functionalities such as:
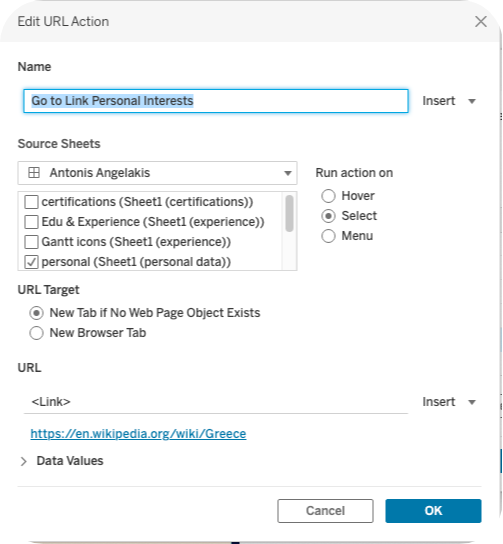
Redirecting to specific URLs when clicking icons for social links, certification links, personal data, etc. with Tableau Dashboard Actions.
As mentioned, filtering the skills and technologies used in each role based on the company’s tech stack and projects.
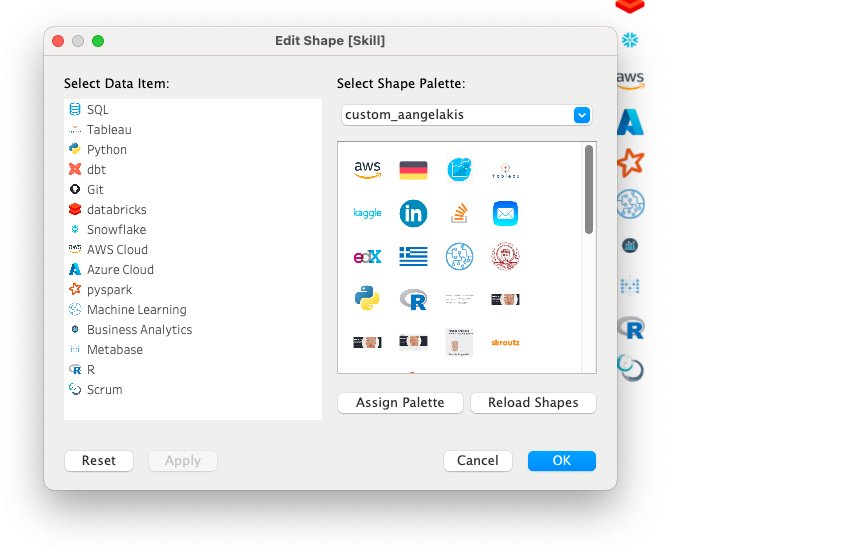
To use and match logos with providers, skills and in general column values, we use custom shapes.
Custom shapes in Tableau are fast and easy to use and provide the user unlimited control over mark shapes. Tableau shapes and controls can be found in the marks card to the right of the visualization window. There are plenty of options built into Tableau that can be found in the shape palette, but what if you want to use custom shapes for effect, branding, etc.?
There is a folder in My Documents called My Tableau Repository where you can find a shapes folder. Within this shapes folder, simply create a new folder for your shapes and name it an informative name. Save any custom shapes you would like to use in your visualization into this file.
To load your shapes, hit reload in your shapes palette and then select the new shapes folder from the drop-down menu.
Putting all these together you can have your Tableau CV and easily demonstrate smartly some of your Tableau experience.
Crafting your CV with Tableau offers a unique opportunity to showcase your BI skills creatively while adhering to essential CV and visualization guidelines. By leveraging Tableau’s dynamic features, you can artfully present your professional journey, skillset, and achievements in a visually compelling manner. Through imaginative yet structured visualizations, emphasize clarity, relevance, and a cohesive narrative. Ensure readability by using clear labels, concise descriptions, and intuitive design elements.
Balance creativity with professionalism, incorporating industry-standard CV sections such as experience, education, and skills, while infusing innovation through interactive elements and engaging storytelling.
You can view and download the workbook in Tableau Public.
Great engineering starts with great awareness. Be mindful, be DataConscious.
❤️ Liked this article? Make sure to push the button
💬 Community needs your voice, do you have something to add? Feel free to
🔁 Know someone that would find this helpful? Feel free to share
No posts
Comments
Nothing yet. Say the first thing.
Sign in to join the conversation.