
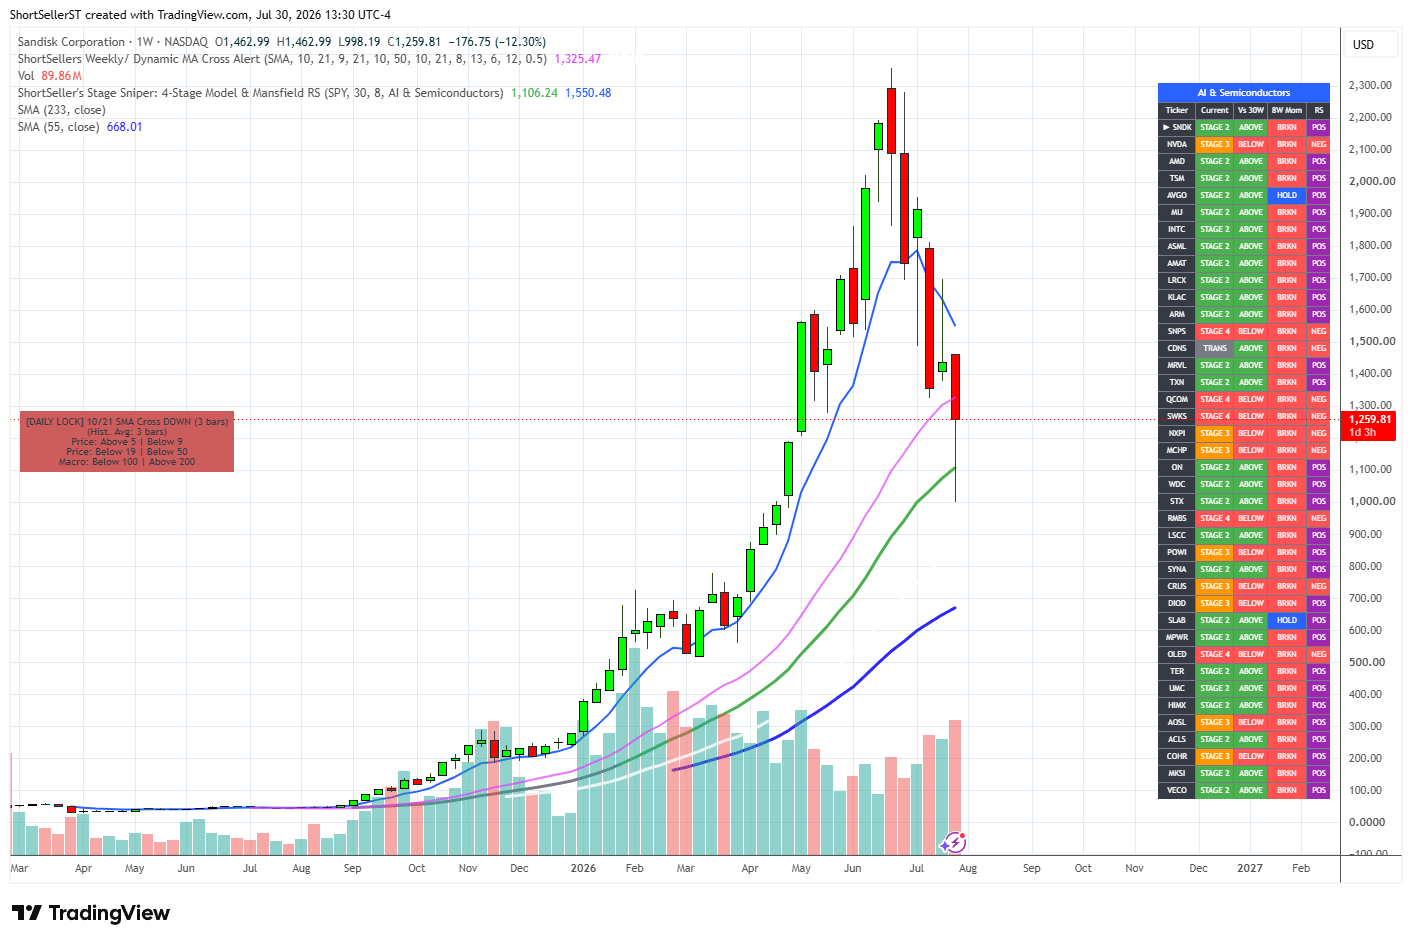
UPDATED - NOW SHOWS 40 STOCKS PER SECTOR - CHANGE SECTOR IN THE SETTINGS!
The ShortSeller’s Stage Sniper is an “awesome” tool because it digitizes one of the most respected frameworks in professional investing: Stan Weinstein’s Stage Analysis.
While many traders get lost in short-term noise, this script forces you to look at the “Big Picture” using institutional-grade logic. Here is why this specific Pine Script code is so effective:
The script mathematically defines the four phases of a market cycle, removing all emotional guesswork:
Stage 1 (Basing): Price crosses the MA, but the trend hasn’t started. It’s the “watch and wait” zone (Yellow).
Stage 2 (Markup): The “Profit Zone.” Price is above a rising MA with positive relative strength (Green).
Stage 3 (Topping): Momentum stalls and the price begins to churn around the MA (Orange).
Stage 4 (Decline): The “Danger Zone.” Price is below a falling MA (Red).
This is the “Pro” feature of the script. Most traders look at a stock in a vacuum; this script calculates Mansfield RS to compare the stock directly against a benchmark (like SPY).
It ensures you aren’t just buying a stock that is going up, but one that is outperforming the market.
In the code, a stock cannot enter a true Stage 2 unless
mansfield_rs > 0. This prevents you from buying “laggards” that are only rising because the tide is lifting all boats.
By adding an 8-Week EMA, the script provides an early warning system.
While the 30-Week MA is the long-term anchor, the 8-Week EMA acts as a “speedline.”
If the dashboard shows the Stage is 2 but the 8W EMA is “BROKEN,” it’s an immediate signal that the short-term momentum is waning, even if the long-term trend is still intact.
The script uses request.security to pull Weekly data regardless of what timeframe you are viewing. This is critical because Stage Analysis is designed to be a weekly trend-following system. It prevents you from being “faked out” by a single bad day on a daily chart if the weekly structure remains bullish.
Looking at the current S&P 500 chart, you can see the dashboard in action:
At a Glance: You don’t need to do math or squint at lines. The bottom-right panel tells you exactly where the asset sits in its cycle.
Institutional Bias: By color-coding the 30-week MA based on the Stage, the chart itself becomes a traffic light—telling you when to go heavy (Green) and when to get out (Red).
MetricBullish RequirementPurposeCurrent CycleStage 2 (Markup)Confirms the primary uptrend is active.30W MA SlopeRisingEnsures long-term institutional support.Mansfield RSPositiveConfirms outperformance vs. the S&P 500.8W EMAHoldingConfirms short-term momentum is still “fast.”
Copy and paste the source code below into the TradingView Pine editor, and save as ShortSeller’s Stage Sniper
Comments
Nothing yet. Say the first thing.
Sign in to join the conversation.