

For traders who thrive on the precision and power of technical analysis, understanding harmonic patterns is like unlocking the secret code of the market. These patterns are not just a tool — they are a language, a rhythm that speaks to those who know how to listen. As a devourer of harmonic patterns, I immerse myself in their complex structures, finding opportunities where others might see only noise. The ability to identify these patterns and translate them into actionable insights is what sets a seasoned trader apart.
In this post, I’ll guide you through some key stocks that are presenting harmonic patterns worth watching.

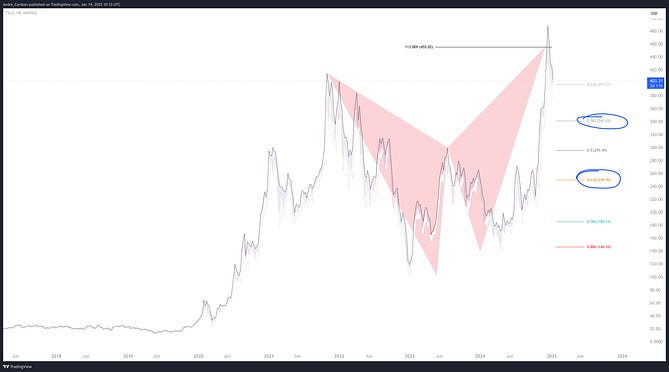
Tesla (TSLA) completed a bearish alt-bat pattern at $455, causing an immediate pullback to $373.
The pattern projects a target for the pullback at the .382% Fibonacci retracement level at $341, slightly below the most recent support.
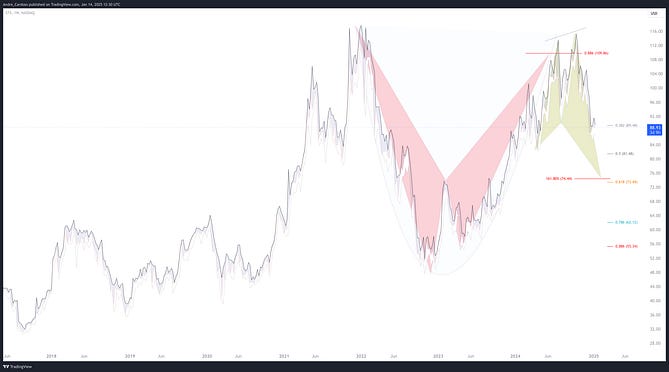
Seagate Technology (STX) has already experienced a pullback after forming the bearish bat pattern at $108.86. Now, attention is on the potential formation of a bullish shark pattern at $74.44, aligned with the .618% Fibonacci retracement.
If the stock manages to break the historical highs of January 2022, a higher-degree cup n’ handle pattern could manifest, offering new opportunities for upside.
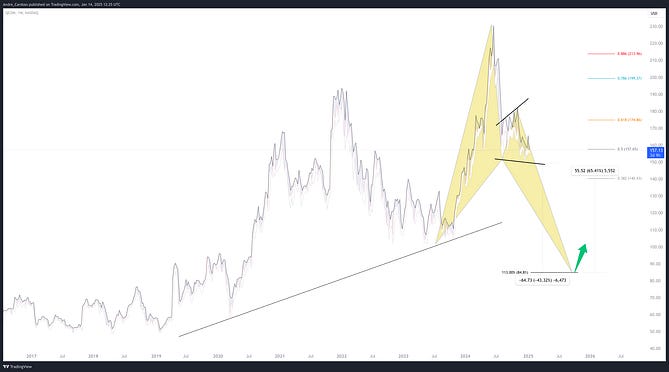
Qualcomm (QCOM) has yet to complete the anticipated harmonic pattern, but its support structure at around $150 remains strong. If this support fails, a more significant pullback may happen.
The bullish alt-bat pattern is projected to $84.81, implying a drop below the May 2023 lows.

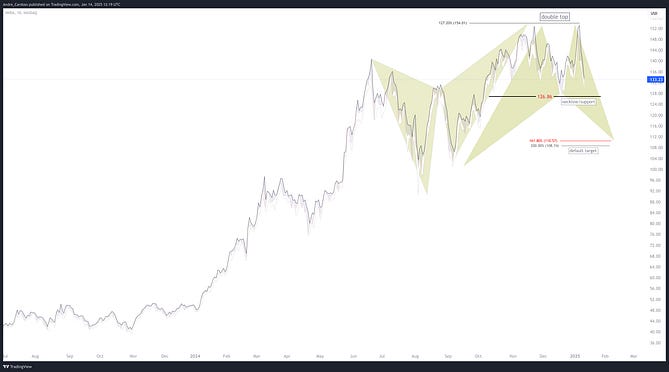
For Nvidia (NVDA), the neckline is clearly defined at $126.86.
If the stock drops below this support level, a pullback to $108.74 may occur, where a bullish shark pattern will form at the 161.8% Fibonacci extension, with the target projected at $110.57.
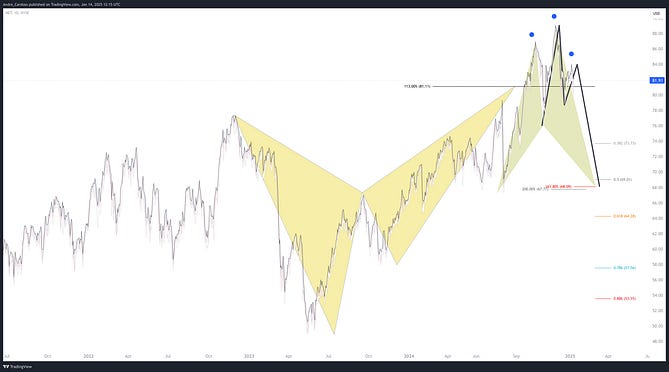
MetLife (MET) is showing signs of a potential head and shoulders pattern reversal, with key support at $76.
If the price breaks this support, the stock may pull back to $67.77, where multiple bullish patterns, such as shark and crab patterns, could form, converging at the 161.8% Fibonacci extension at $68.09.
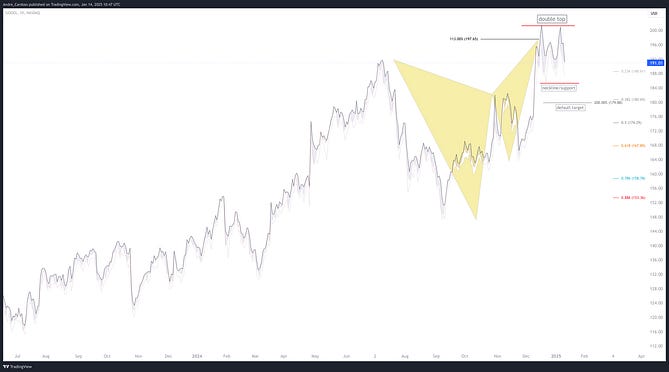
Google (GOOGL) completed a bearish alt-bat pattern at $197.65, suggesting a pullback to $180.69, aligning with the .382% Fibonacci retracement.
Additionally, there is the possibility of a double top with support established at $185.26.
If the price drops below this support, the target for the decline is projected to $179.88.

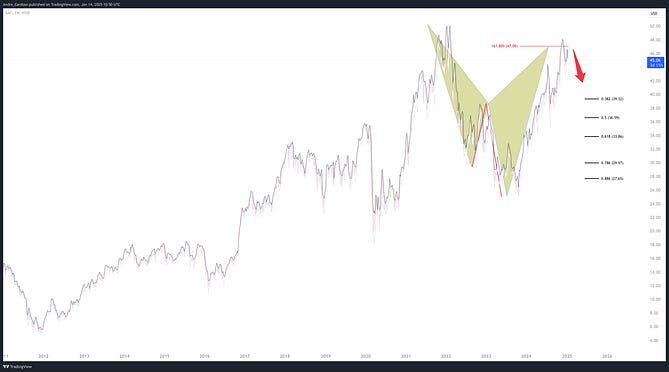
Bank of America (BAC) formed a bearish shark pattern at the 161.8% Fibonacci extension, indicating a potential pullback to $36.60.
At this level, a bullish 5–0 sequence could form, representing an opportunity for long positioning in the future.
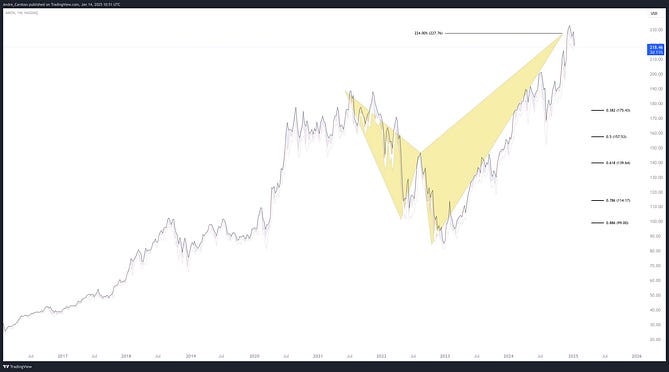
Amazon (AMZN) completed a bearish shark pattern at the 224% Fibonacci extension, reaching $227.76. This pattern suggests a significant pullback of around 27%, with a target projected to $157.53.
The pullback could present an opportunity to consider new positions at lower prices.
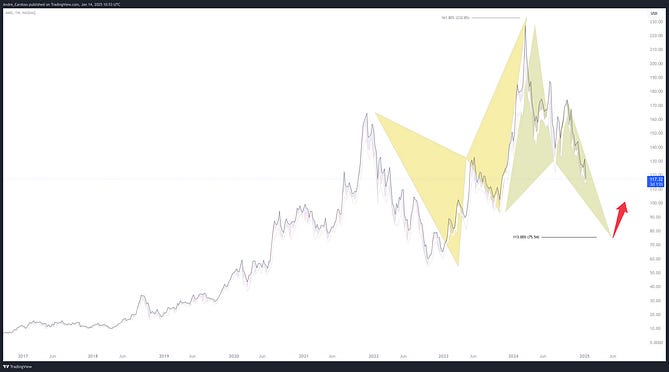
Advanced Micro Devices (AMD) is threatening to break the support structure and fractal formed at $121.70.
If the stock breaks this level, a significant decline may follow, with possible buy patterns forming at $75.54, particularly a bullish alt-bat pattern at the 113% Fibonacci extension.
If this pattern is validated, the stock may recover to $133.44.

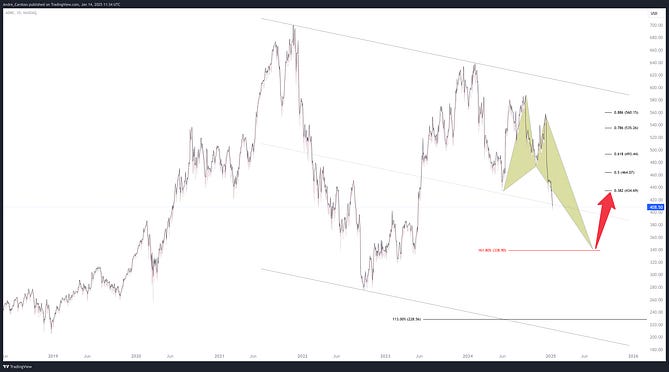
Adobe (ADBE) recently dropped below the established support at $433.97, opening the door for a potential bullish crab pattern. This pattern, projected to the 161.8% Fibonacci extension, suggests a possible return to $338.90.
If confirmed, the recovery targets point to $434.69, indicating a retest of the recently broken support.
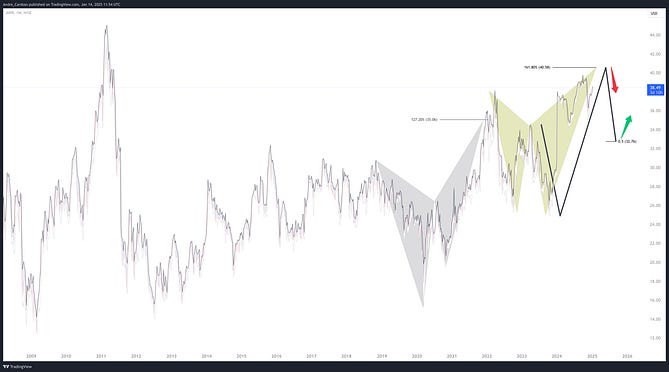
Juniper Networks (JNPR) is close to completing a bearish shark pattern, projected to reach $40.58, above the most recent resistance level.
If this pattern is confirmed, the stock may pull back to $35.76, where a bullish 5–0 sequence could form.
For those seeking in-depth technical analysis, with a focus on harmonic patterns in forex, commodities, equities, cryptocurrencies, and more, I invite you to check out my detailed and personalized analysis on Forex Analytix.
On Forex Analytix, you can follow my technicals, along with exclusive insights and analyses from our expert team covering a wide range of markets. The platform offers a unique and strategic view for traders of all levels, with a technical approach focused on specific price patterns and other crucial factors impacting your trades.

Don’t miss out! Subscribe now and gain direct access to my market analysis and updates from other members of our expert team. Join us and stay ahead with the best trading opportunities!
Happy Trading,
André Cardoso
Comments
Nothing yet. Say the first thing.
Sign in to join the conversation.