

My technical analysis of two key currencies: the Australian Dollar and the New Zealand Dollar. By analyzing the current technical patterns, I’ll uncover the resistance and support levels influencing the movement of these pairs.
Aussie (AUD/USD) Analysis:
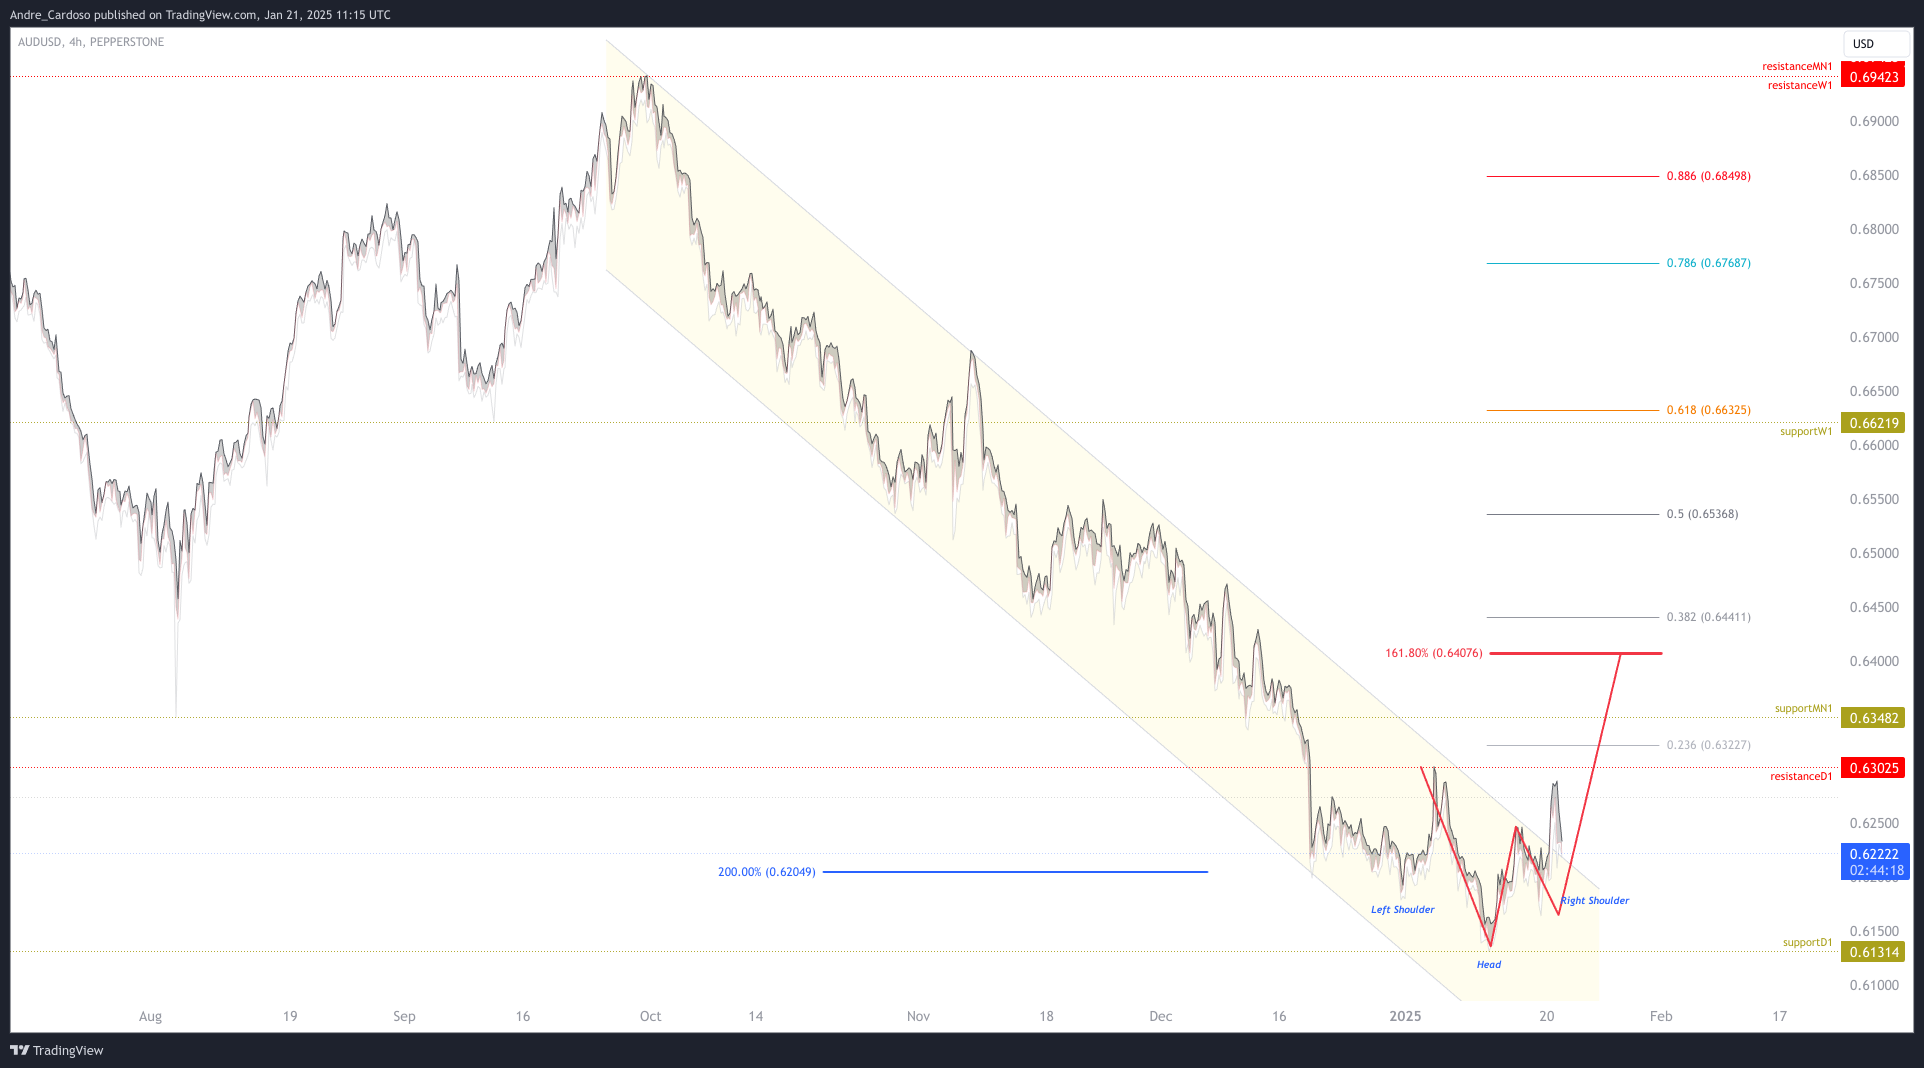
The Australian Dollar has recently broken through its daily fractal resistance level at 0.6246, only to form a new fractal resistance at 0.6289. This new level remains below the weekly fractal resistance at 0.6302, creating a zone of reinforced resistance. This could place additional pressure on the pair, as it may be seen as a potential neckline for an inverted head and shoulders reversal pattern. Alternatively, it could also be considered an “outside return” of the descending parallel channel. If the price manages to recover the channel it broke, it could be forced to follow its bearish trend, potentially breaking the most recent support levels.

Kiwi (NZD/USD) Analysis:
Similarly, the New Zealand Dollar is facing a comparable situation. The pair has recently broken its daily fractal resistance at 0.5650, establishing a new fractal near the weekly resistance at 0.5693. The outlook for the Kiwi mirrors the Aussie, with the possibility of an outside return or a potential inverted head and shoulders pattern forming, where the neckline is identified at the weekly fractal resistance level.
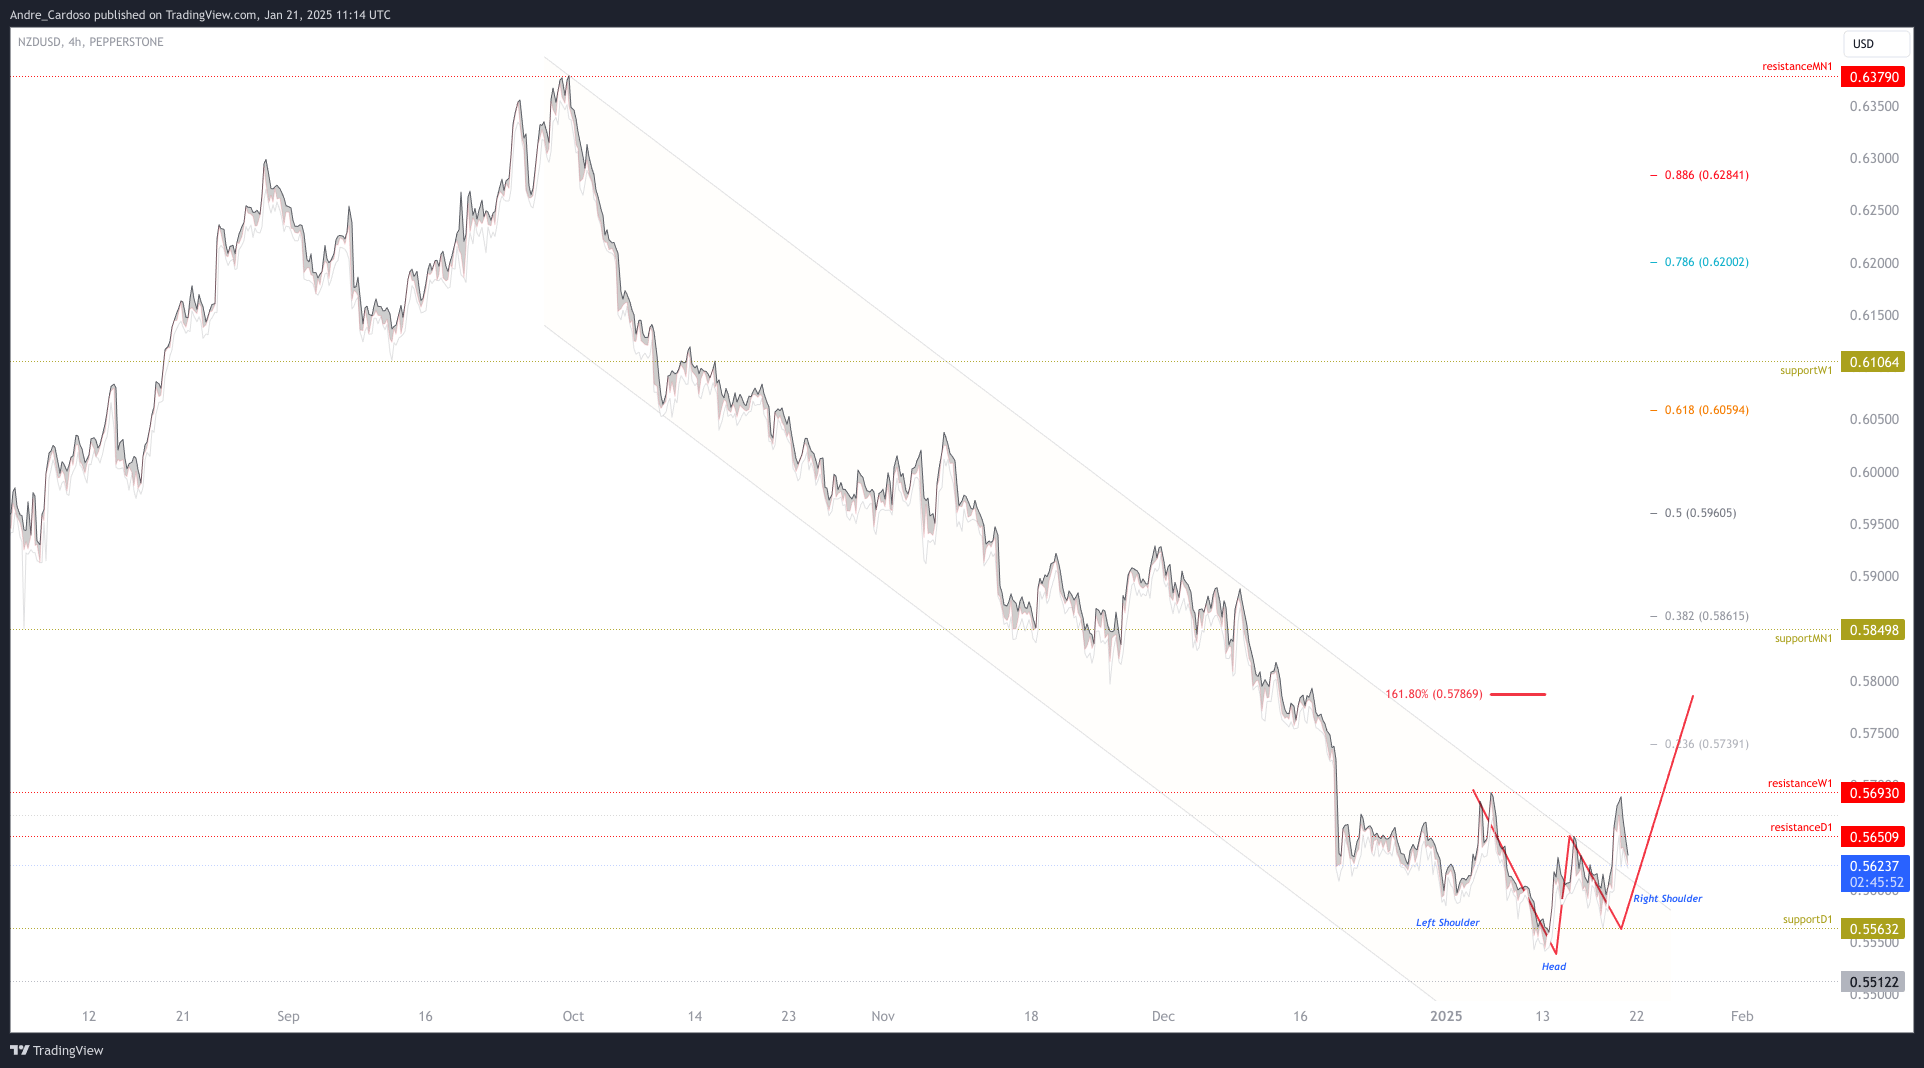

Both the Aussie and Kiwi are at critical resistance zones, where further developments could indicate potential reversals or a continuation of bearish trends. Traders should closely monitor these levels, as a breakout above the established resistance zones could signal a shift in momentum, while failure to break these levels could reinforce the ongoing downtrend.
Happy Trading,
André Cardoso

Risk Warning: Trading financial assets carries a high level of risk and may result in the loss of all your capital. Make sure to fully understand the risks involved before you start trading and carefully consider your investment objectives, level of experience, and risk tolerance. The data and information provided in this content do not constitute financial or investment advice and should not be considered as such. Only invest what you can afford to lose, and be aware of the risks associated with trading financial assets.
Comments
Nothing yet. Say the first thing.
Sign in to join the conversation.