

Today’s Read Time: 9 minutes
This week we’re talkin jobs: the ones the economy is shedding, the ones people are moving across the country to find, and the ones swinging hammers 651 feet above downtown Nashville. Plus, a record 105 million Americans are now neither working nor looking. Who they are, why they left, and what it means for rates and real estate.
Let’s get into it.
(👇 .01% from last week, 30-yr fixed mortgage)
The Sun Belt migration flattening — Tampa’s domestic immigration has reportedly dropped 70% in one year, Florida’s statewide net domestic migration has dropped roughly 80% from its 2022 peak, and United Van Lines now classifies both Texas and Florida as “balanced” between inbound and outbound moves, a first in recent memory. (Migration report, Mar 2026)
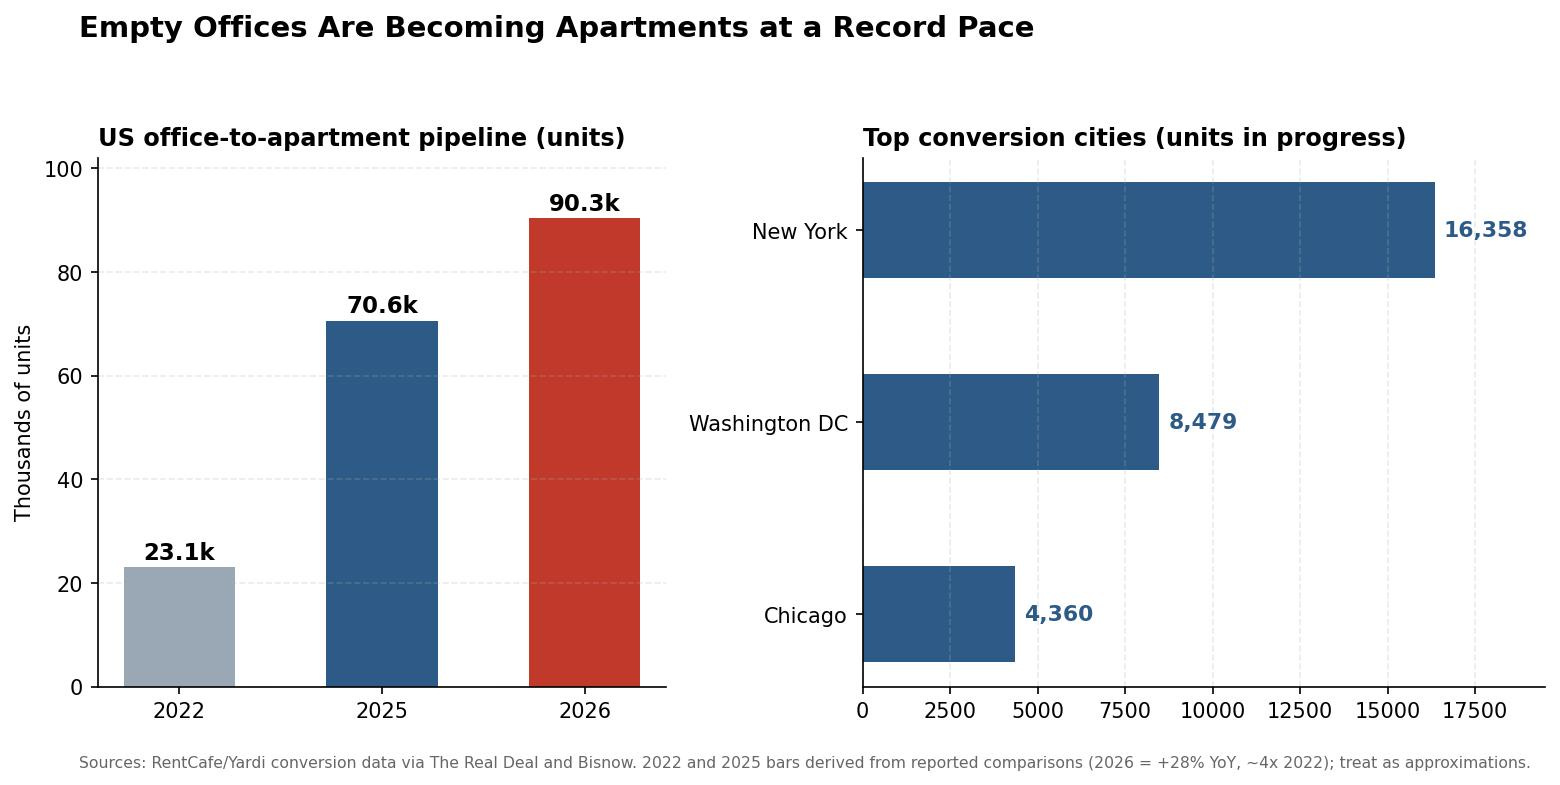
Empty offices are becoming apartments at a record clip — roughly 90,300 office-to-apartment conversion units are now in the national pipeline, up 28% from last year’s record and nearly four times the 2022 total, led by New York, Washington DC, and Chicago. (The Real Deal, Bisnow)
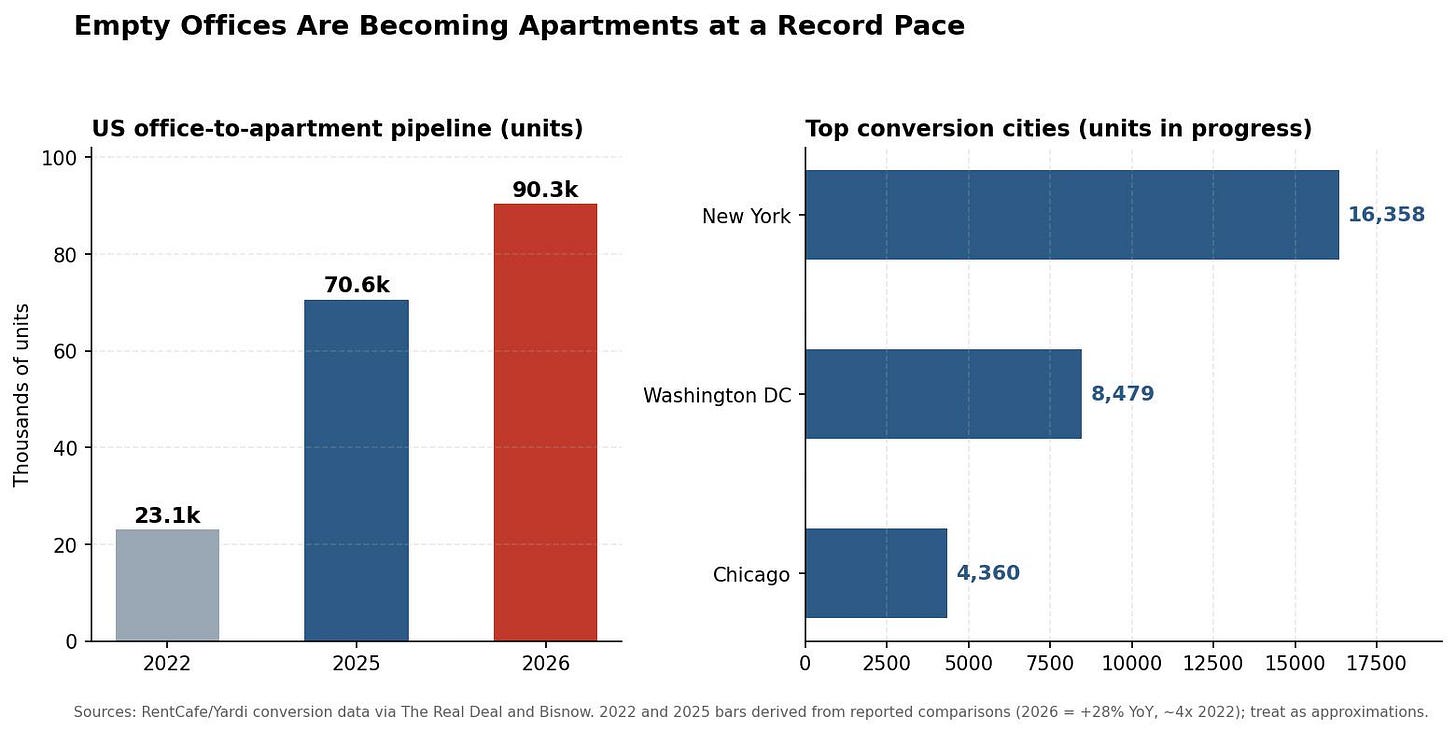
Office-to-apartment conversion pipeline. Sources: RentCafe/Yardi via The Real Deal, Bisnow. (Optional: delete if you want a leaner Weekly 3.) Good news for coffee drinkers — up to five cups a day appears safe for most adults and may even benefit heart health, according to a new scientific statement from the American Heart Association. (WSJ) Your morning habit is officially load-bearing. And if you’re going to a few cups, why not make em at home? Here is what I use: the AeroPress.
Ricky Skaggs & Kentucky Thunder at the Ryman — Tuesday, July 21, 7:30 p.m. Bluegrass royalty at the Mother Church. (Ryman calendar)
Orville Peck with Mickey Guyton, Margo Price, Dasha, and Kaitlin Butts — also Tuesday, July 21, 7 p.m. A stacked bill; pick your Tuesday-night poison. (NewsChannel5 events guide)
In June, roughly 832,000 people stopped working and stopped looking for work, all in a single month.
That pushed the number of folks outside the labor force to about 105.8 million, the most in American history. (BLS via FRED, “Not in Labor Force”) It’s approximately 2.2 million more people on the sidelines than at the 2020 pandemic peak, when the global economy was switched off. So far in 2026 alone, roughly 2.5 million Americans have exited. At the turn of this century, the sidelined population was 68.7 million; we’ve added about 37 million non-workers in a generation.
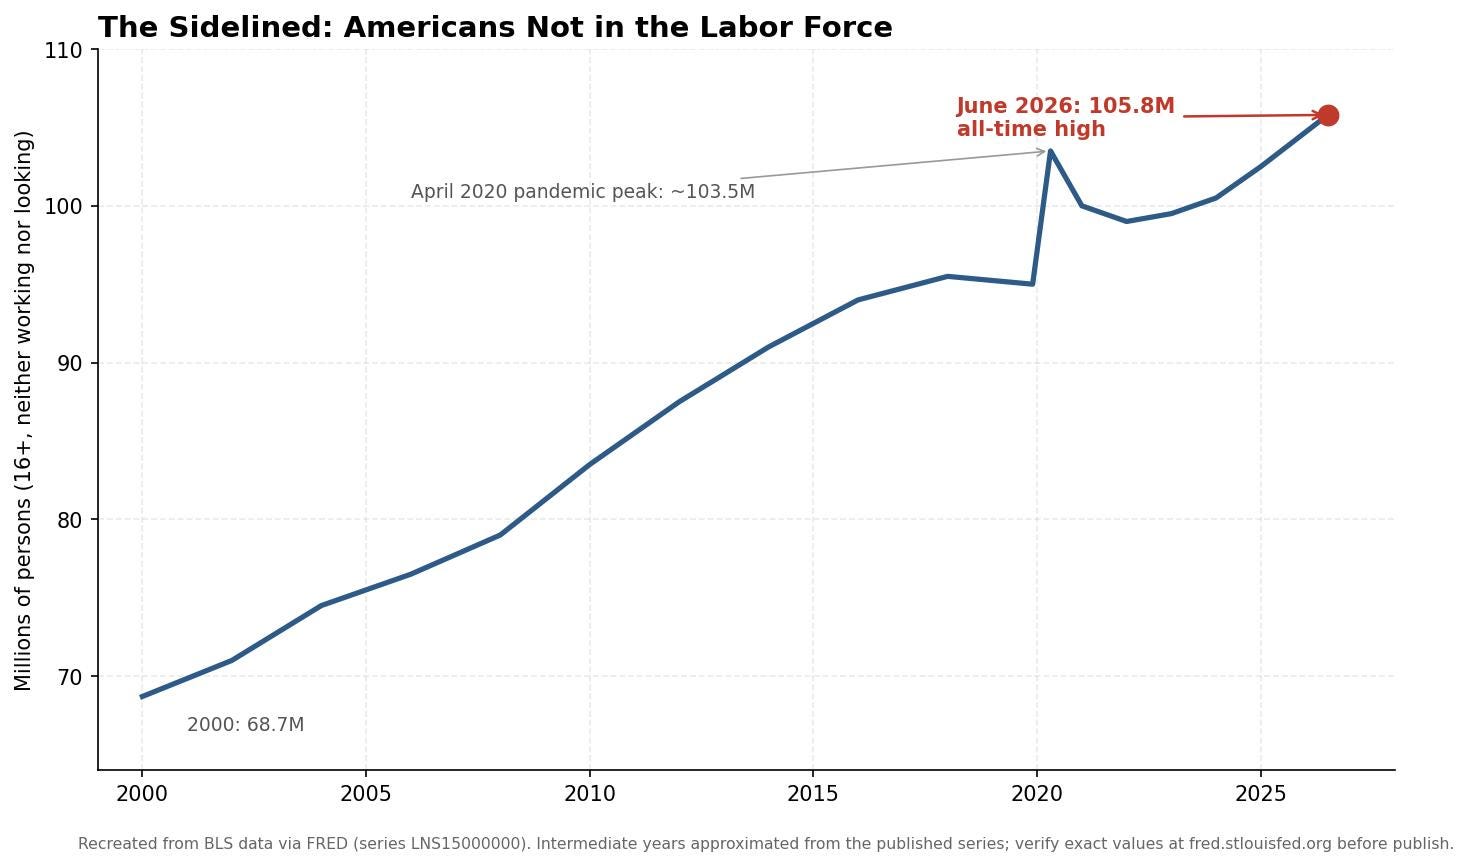
Nobody held a press conference. There was no walkout, no picket line, no dramatic resignation letter. Millions of working-age Americans simply, quietly, stopped. And because they stopped looking, they vanish from the unemployment rate entirely. Oddly, these folks are not considered unemployed, so the unemployment rate actually fell.
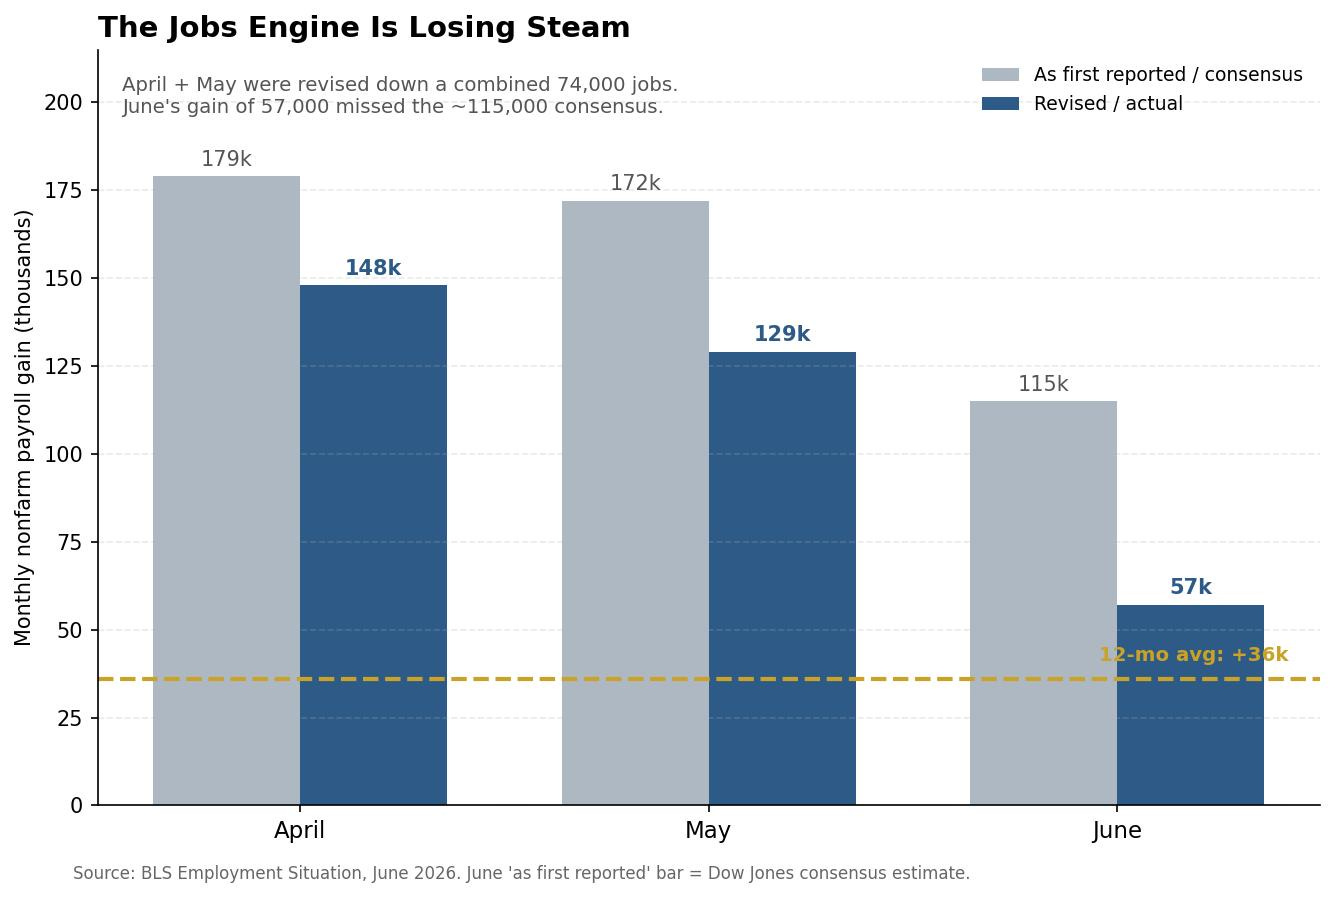
Employers added just 57,000 jobs in June, well short of the roughly 115,000 economists expected, and revisions erased another 74,000 from April and May combined. (BLS Employment Situation, CNBC) The unemployment rate fell to 4.2%, but only because the labor force participation rate dropped to 61.5%: excluding the Covid spring, that appears to be the lowest reading since June 1976. (CNBC) A shrinking denominator can make a weakening job market look healthy. It’s like raising your batting average by refusing to bat.
So who are the missing workers? The case file has several suspects, and the honest answer is that more than one of them did it.
Suspect one: the retiring Boomer. The demographic cliff is real. Participation among Americans 55 and older fell to 37.1% in June, a 21-year low, and Indeed’s economists project participation will keep sliding through 2034 on age structure alone. (Fortune, Indeed Hiring Lab) And this year gave older workers a golden parachute: a booming stock market has fattened 401(k)s to the point where many simply feel rich enough to retire. (Fortune) These retirements were expected, and they can’t explain the whole case.
Suspect two: the missing immigrant. Immigration policy has tightened sharply, and economists cite it as a meaningful contributor to the shrinking labor supply. (Fortune) Fewer arrivals means fewer workers counted, and industries that lean on immigrant labor, construction among them, feel it first. Regular readers will recognize this one from Eggs Are Cheap Again. Electricians, Not So Much.: the 349,000-worker construction gap doesn’t close when the labor pool is draining. Importantly, this bleeds over into rentals too, where far fewer laborers need housing, putting downward pressure on what had been consistently increasing rents.
Suspect three: the discouraged prime-ager. This is the one that should bother us all. The biggest June decline came not from retirees but from workers aged 25 to 54, whose participation dropped 0.6 points to 83.3%. (CNBC) People in their prime earning years don’t retire; they give up, care for someone, go back to school, or go sick. Caregiving duties and long, demoralizing job searches show up repeatedly in the reporting. (Fortune) When hiring slows to 57,000 a month, the line between “unemployed” and “done looking” gets thin.
Not good.
Suspect four: the vanishing male worker. Zoom out and a two-decade trend sharpens the picture: roughly one in three American men aged 16 and up is now neither working nor job hunting, the weakest male attachment to work since 1948 outside the pandemic. Male participation sits near 67%, down from 73.5% two decades ago. (Dallas Express, American Institute for Boys and Men) Part of the explanation may be a mismatch: recent job growth has concentrated in healthcare and education, fields that skew female, while manufacturing, transportation, and mining have been shedding positions. (Metaintro) The jobs being created are not the jobs many sidelined men are equipped for, or frankly, willing to take.
The partial verdict. Demographics set the stage, immigration policy thinned the cast, and a cooling job market pushed the discouraged out. No single suspect explains an 832,000-person exit in one month, but together they describe an economy whose labor engine is losing compression even while the dashboard reads 4.2% unemployment. As a share of the 16-and-up population, non-participation has reached about 38.5%, which appears to be the highest since the 1970s outside the pandemic window, back before women fully entered the workforce. The US job market may be considerably weaker under the surface than the headline rate suggests. That’s the answer to the case, or at least the part of it the data can prove.
Regular readers know I’ve been beating this drum since May: Forget Inflation. Watch the Labor Market. The argument then was that labor, not the CPI, would decide where rates go. June’s data appears to be making that case for me.
Quick Ad break: Cash App

Set it, forget it, and save for your goals
Make saving automatic with Cash App. Round up your spare change from every purchase, earn up to 3.25% interest, and transfer money between your balances whenever you want—all with no hidden fees or minimum balance requirements.
Make unlimited transfers between your Cash and Savings balances Keep your money safe with 24/7 fraud monitoring and built-in security features
Saving is easier with Cash App
At the register, June CPI cooled to 3.5% year-over-year, and the monthly index actually declined 0.4%, the largest one-month drop since April 2020. Energy did the heavy lifting, falling 5.7% in a single month. Core held at 2.6% annually, flat on the month. (BLS CPI) Upstream, producer prices fell 0.3% in June, with gasoline plunging 12% and final-demand goods posting their largest decline since July 2022. (BLS PPI) The pipeline that feeds consumer prices was draining, not filling, at least through June.
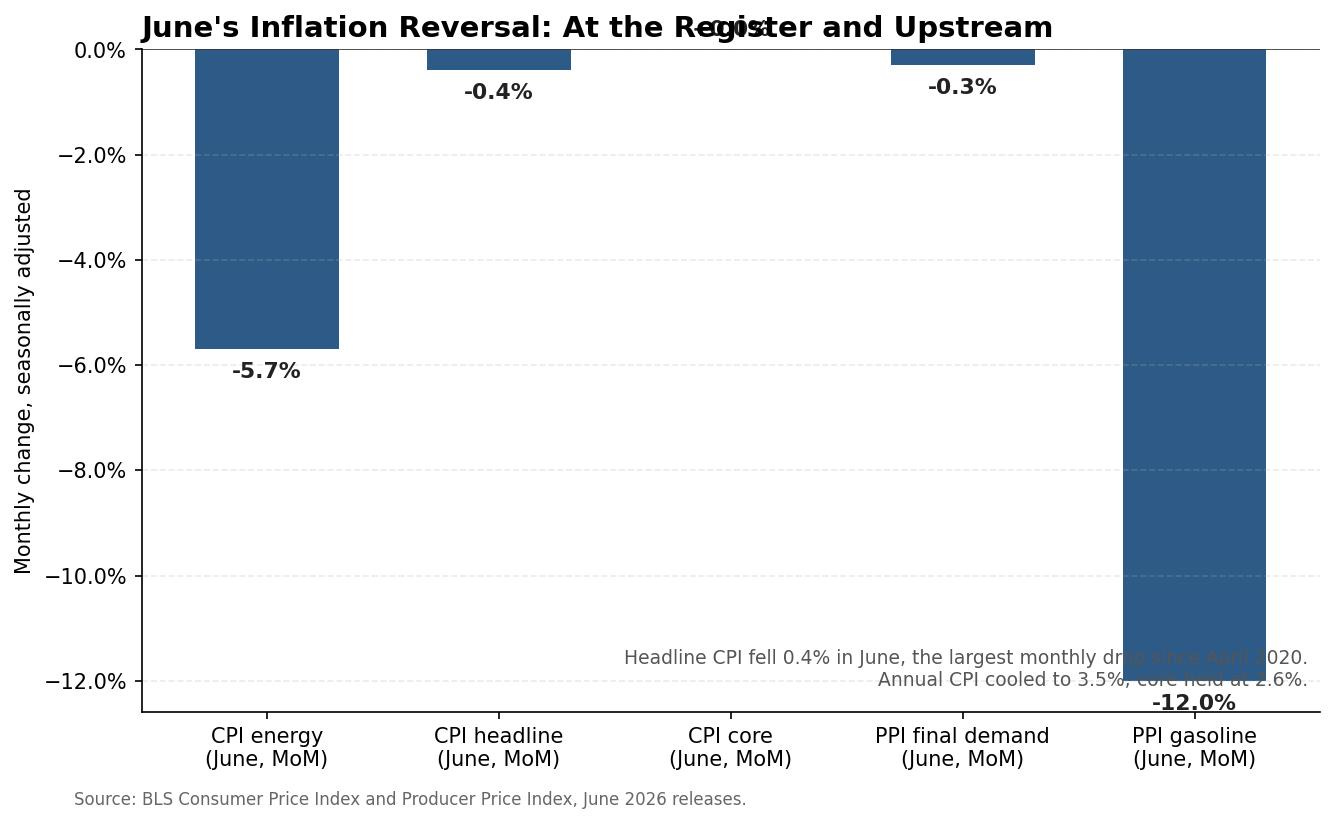
If this sounds familiar, it’s because it’s the thesis: the 2026 inflation scare has been substantially an energy story, and as oil normalizes, the rest follows. I laid it out in Inflation Reset and again in Why I Think the Next Fed Move Is a Cut. June was the strongest evidence yet.
This week tensions inflamed with Iran once again. Expect this to continue and oil prices to fluctuate. But the trend will continue down, and along with it, inflation.
The Bureau of Economic Analysis, the agency that produces the PCE index (the Fed’s preferred inflation gauge, distinct from the BLS’s CPI above), announced it’s overhauling how it calculates prices in three categories: portfolio management and investment-advice services, computer software and accessories, and legal services. The new methodology takes effect September 30, bundled into the annual GDP revision, and applies retroactively all the way back to 2021. (Axios)
I don’t hear anyone talking about this.
The stated reason seems legit. The old methods leaned on weak proxies. For portfolio management, the BEA has been extrapolating prices from employment data, which is a bit like estimating the price of a meal by counting chefs in the kitchen. For software, it blended dissimilar products into one composite index. The fix swaps in cleaner inputs, largely from the Producer Price Index, and economists have flagged these exact weaknesses for years. (Employ America)
But look at the effect.
Analysts estimate the changes shave roughly 0.2 percentage points off core PCE. Goldman Sachs figures May’s core reading gets revised from 3.4% down to about 3.2%; JPMorgan says 3.3%. Push the changes forward and some models put fourth-quarter core PCE near 2.8%, meaningfully below the Fed’s own 3.3% median forecast. (Cryptobriefing, KuCoin) The Fed’s target gauge moves closer to 2% without a single price in the real world falling.
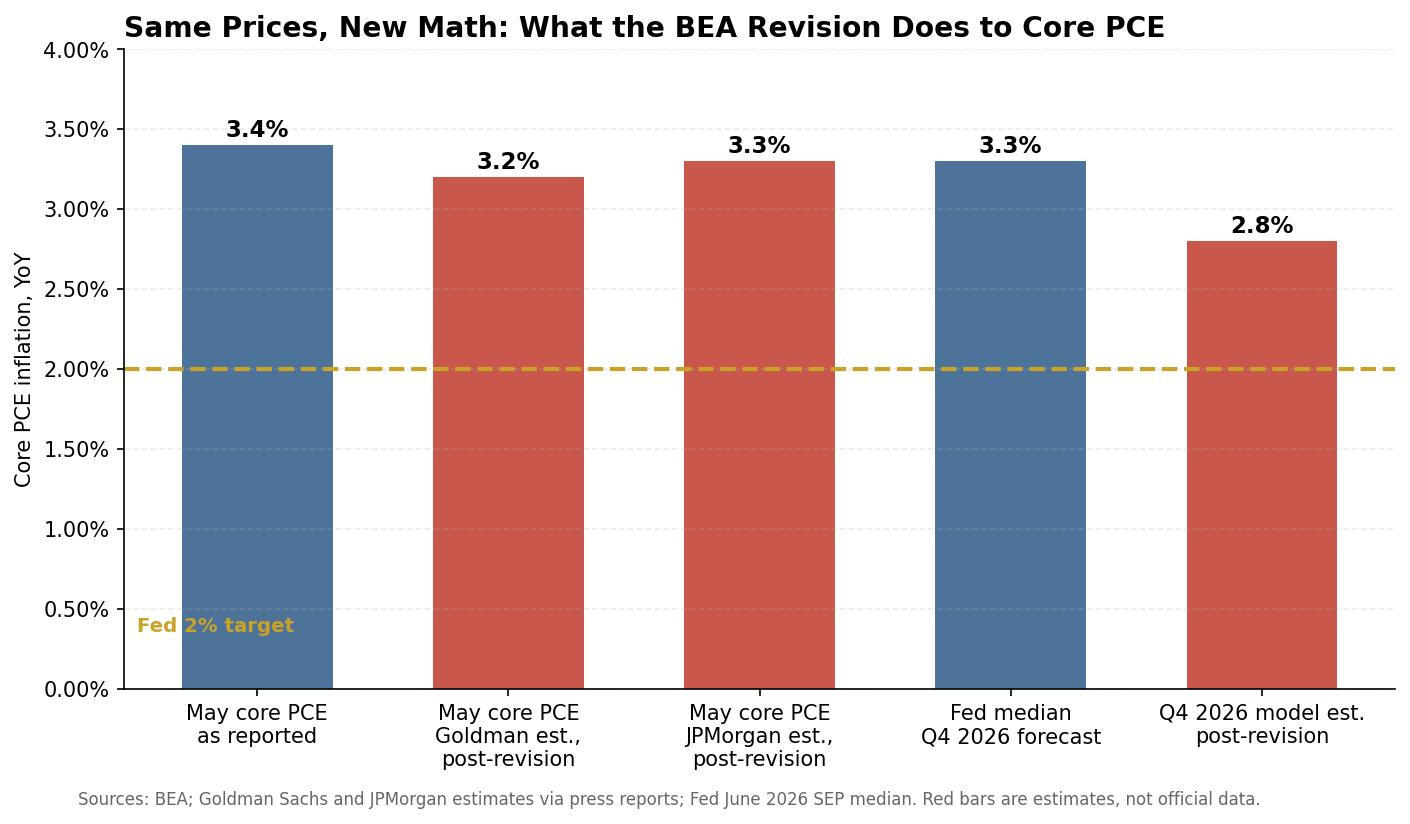
The skeptic in me can’t ignore the timing.
Every adjustment points the same direction: down.
And it lands amid open White House pressure on the Fed to cut, and amid a broader fight over the independence of the statistical agencies. UBS warned that thin transparency around the Fed’s preferred gauge makes the data “more susceptible to manipulation” if the agency bends to politics. (BigGo Finance) Others, like Fisher Investments, argue these are dry, overdue technical repairs and the hand-wringing is overdone. (Fisher)
But, both things can be true: the fixes are probably real, and a friendlier inflation number, retroactive five years, dropped in one coordinated sweep, is awfully convenient right now.
Put the pieces together: payroll growth stalling, a record 105.8 million Americans on the sidelines, hard June inflation data moving the right way, and an official gauge that’s about to be marked lower by rule change. All three push the same direction: toward cuts. The market seems to agree on the near term, pricing an 86.7% chance the Fed holds at 3.50%–3.75% at the July 29 meeting. (CME FedWatch)
My view hasn’t changed: the Fed holds here, then cuts 75 to 100 basis points as the energy-driven inflation continues to fade, over the next 12 months. Run that through the 10-year and a normalizing mortgage spread and you get a 30-year mortgage in the neighborhood of 5.5%.
Plot America’s large metros by how much housing they permit per resident against what a typical apartment costs, and the pattern is hard to miss: the places that build are the places that stay affordable. Austin permits roughly 17 homes per 1,000 residents a year and typical rent sits near $1,500. Raleigh and Nashville permit around 13 per 1,000 with rents in the same neighborhood.
Build Housing = keep rents in check. (shocking!)
At the other corner: Los Angeles, San Diego, and Boston permit 2 to 3 homes per 1,000 residents and rents run $2,350 to $2,450, while San Francisco, New York, and San Jose sit at $2,750 to $3,100. (Census building permits, Zillow ZORI)
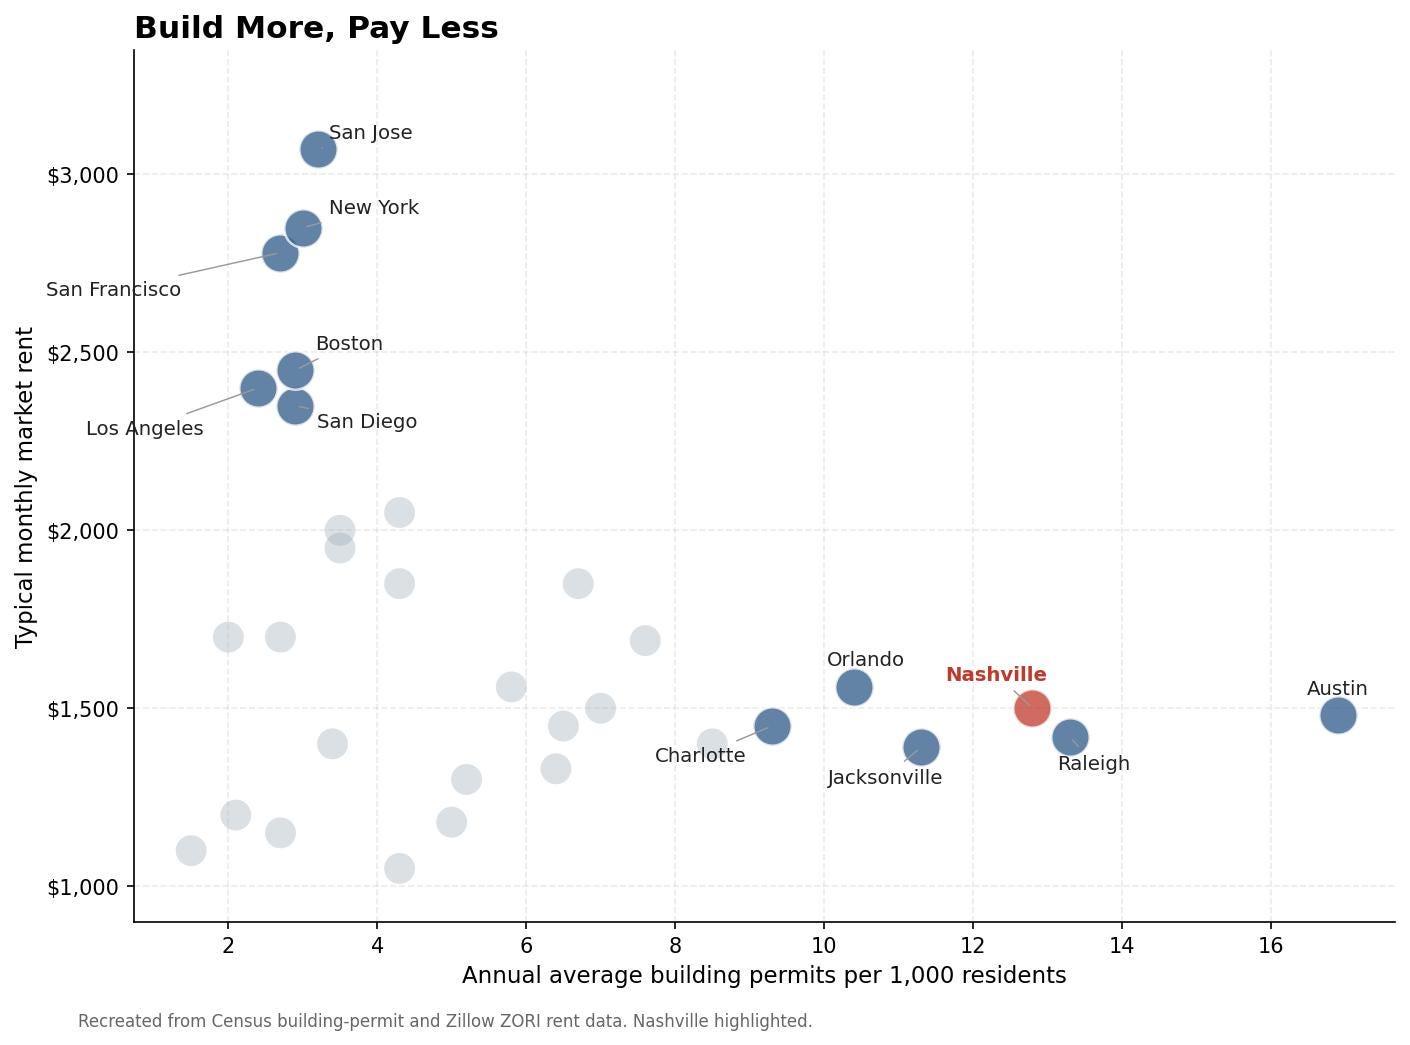
And this isn’t just a static correlation. You can watch the mechanism operating in real time. The same high-permit Sun Belt metros that overbuilt in 2023–2025 (Austin, San Antonio, Denver) are the only major markets where rents are still falling today, exactly what the chart predicts happens when supply runs ahead of demand. (RealPage Q2 2026) Nationally the tide appears to be turning: the median rent rose 0.4% in June, a fifth straight monthly increase, to $1,385, and the national vacancy rate is falling for the first time in four years. (Apartment List) Occupancy hit 95.5% in the second quarter with over 187,000 units absorbed. (RealPage)
For Nashville investors, Near term, that’s why our rents went soft: builders delivered a record wave.
Longer term, it’s why people and employers keep choosing Tennessee over other states, and why the jobs that anchor this week’s issue keep showing up here.
This is extremely bullish for long term investments in real estate.
Supply is one of the forces that quietly decides whether a rental market makes you money, a theme I dig into at length in my book on the five ways real estate builds wealth. Remember, rents / rent growth is only one of the five, and most investors don’t know how to run their numbers accurately.
Another Quick Break: Try My DealLab Calculator (Now with Advanced Mode)
Want help running numbers on your next deal (or an existing property you have)? I built a free real estate deal analyzer, and I just added Advanced Mode for the pros: DealLab, the deal analyzer. It’s in beta, which means two things: it’s free, and I want your feedback. Run your next deal through it, kick the tires, and reply to this email with what’s broken, what’s missing, and what would make it indispensable. Bookmark it. It will come in handy.

The curious case of the American non-worker doesn’t close with a single culprit. Boomers are retiring on schedule and on fat 401(k)s, immigration policy thinned the labor pool, and a cooling job market is quietly convincing prime-age workers to stop trying. Add it up: 57,000 jobs, 74,000 in downward revisions, and a record 105.8 million Americans outside the labor force entirely. Everyone stares at inflation; the sharper information this month may be coming from the people who stopped showing up.
For real estate investors, I think the move is to position for the world the jobs data is describing, not the one the cable-news inflation panic describes. Rates near 6.6% with a plausible path toward the mid-5s, national rents finding their footing, and a supply pipeline that thins out through 2027: that combination has historically rewarded people who bought before the consensus caught up. Protect the downside, underwrite today’s concessions, keep reserves for an oil-shock scenario, because the war has made that risk real again. But don’t confuse a noisy month with a broken thesis.
W. Edwards Deming, the statistician who taught postwar Japan how to build things, put it best: “In God we trust. All others must bring data.” The data this month says jobs are cooling and inflation, measured honestly or otherwise, is heading lower. Bring your own data, run your own numbers, and when the government changes the yardstick, measure twice.
Until next time. Stay Curious. Stay Skeptical.
Herzliche Grüße,
-The Skeptical Investor
-P.S. If this newsletter has been useful to you, the best gift you can give me is free: forward it to one person who’d benefit. I promise you 24 hours of good joo joo.
You can consult one-on-one on the phone with me, The Skeptical Investor!
Get professional advice from someone who actually owns, operates, and brokers real estate. Not just some partner in a fund making money off others.
Want to Grow? - Get clarity on how to grow your business or scale.
Stuck? - Get answers to your problem, let’s hop on the phone and figure it out.
No “guru” trying to sell you an expensive course. No BS. No fluff. Only results.
I’ll give you my frank, brutally honest advice. Book a call with me today.
It’s 2026. Be an owner.
Comments
Nothing yet. Say the first thing.
Sign in to join the conversation.