

Today’s Read Time: 9 minutes
This week, we’re talkin’ Inflation reaccelerated to a three-year high, Foreclosures hit a six-year high, which sounds alarming until you see what it’s actually measuring, and U.S. active for-sale inventory just turned negative year-over-year for the first time this cycle, could this mean an end the “buyer’s market?”
Then, of course: Nashville, where the local market is loosening just as the national one tightens.
Let’s get into it.
Today’s Interest Rate: 6.56%
(👇 .09% from last week, 30-year fixed)
The Weekly 3 in News:
Foreclosures hit a six-year high. This is normal. ATTOM’s Q1 2026 report counted 118,727 U.S. properties with a foreclosure filing, up 6% from the prior quarter and up 26% year-over-year, with foreclosure starts up 20% and bank repossessions up 45%. (ATTOM, April 16; HousingWire)
Skeptical Analysis: But, before you read that as consumer stress, this is really foreclosure activity rising “as the market continues to normalize.” Filings cratered to artificial record lows during the 2020 to 2021 moratoria; they are now climbing back toward, but still sitting below, pre-pandemic norms. A 26% jump off a suppressed base is arithmetic, not a wave. The states leading on volume are the big ones you would expect: Texas, Florida, and California. (ATTOM) File this one under “scary headline, ordinary number.”
Inflation reaccelerated to 3.8%, rates keep grinding higher. April headline CPI rose to +3.8% year-over-year, the hottest reading in three years, with core CPI around +2.8%, the firmest since late 2023. (BLS; via CNBC) Much of the April pop traced to an energy spike tied to the Hormuz Straight oil supply problem. This is the supply-side kind of inflation the Fed cannot fix.
Our Housing Data Sucks. Redfin’s chief economist, publicly questioned the reliability of the lagging, revision-prone headline data the industry still leans on. (@FairweatherPhD) Her point is important this week, because the National Association of Realtors’ existing-home-sales series is built on closings, which reflect contracts signed 30 to 60 days earlier, and it is benchmarked and revised against a sample of roughly 210 boards and MLSs. (NAR methodology) And she is not alone: Housing economist Logan Mohtashami has made the same case for years, saying the NAR sales reports lag the market by months and have a habit of pointing the wrong way. (@LoganMohtashami; HousingWire) When the two people most associated with reading this market in real time both say the headline data is a rear-view mirror, an investor should listen. This distinction is the plot of this week’s main article (keep reading).
A Few Fun Things Happening in Nashville This Week
CMA Music Festival, Nissan Stadium and free downtown stages, Thursday through Sunday June 4 to 7. The big one. Four days, hundreds of artists, nightly stadium headliners reported to include Keith Urban, Blake Shelton, Carly Pearce, and Ella Langley, plus free daytime riverfront stages and more honky-tonk spillover than the city can hold. If you own anything short-term-rentable downtown, this is your weekend. (CMA Fest)
The Wallflowers, Brooklyn Bowl Nashville, Friday June 5, 8 PM. Jakob Dylan and company in the Germantown room, a tidier alternative if CMA Fest’s stadium crowds aren’t your speed. (Brooklyn Bowl)
Builders Pulled Paper. They Didn’t Break Ground.
Rates just keep grinding.
The 30-year fixed stopped its decent near 6.23% in late April and has climbed every week since to 6.56% today. (Freddie Mac PMMS) That’s not a dramatic move but the narrative is negative, given the consensus entering 2026 was that rates would drift lower as the Fed eased.
But then we started the Iran sidequest. Right or wrong.
Instead, energy prices are lifting all inflation numbers. April inflation came in at a three-year high of 3.8% YoY, and interest rates levitate with energy prices.
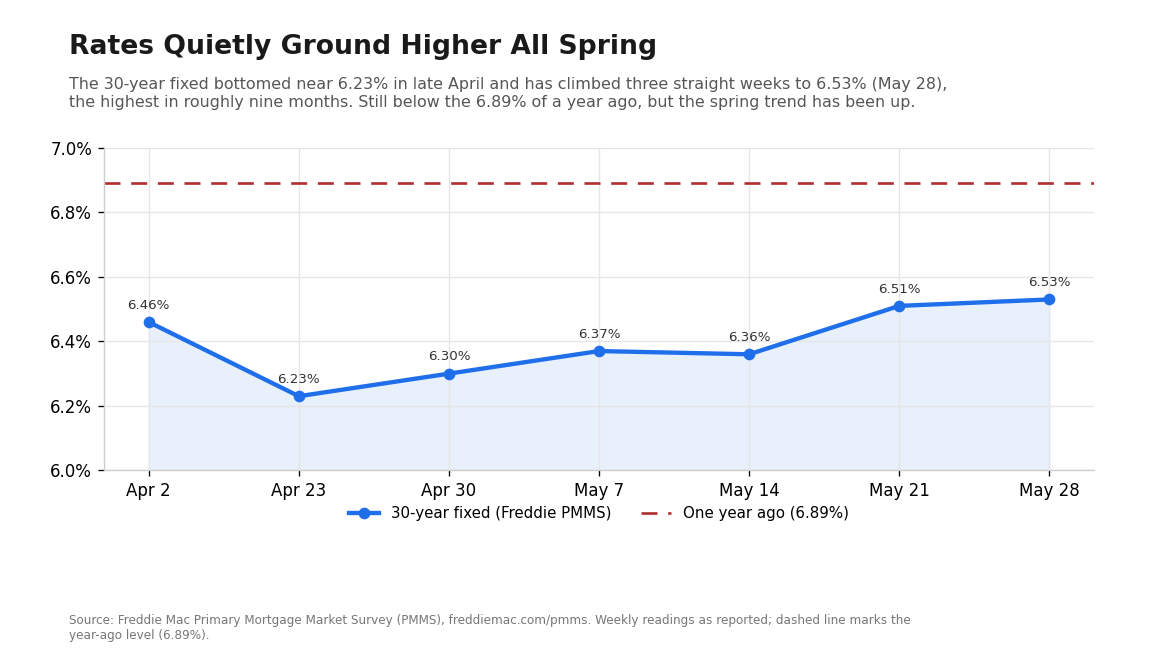
But contrary to some many analysis and the TV news trying to grab you with a salacious headline or two, the Fed can’t fix this by raising rates. They do not have control over the demand for energy/oil. In fact, raising rates may even make this inflation worse.
So as the Fed watches inflation spike, they will most likely just sit this one out.
When could this end?
If a credible Iran de-escalation holds, crude could enter free-fall (it already fell sharply through May on ceasefire reports), the energy contribution to CPI reverses, the 10-year follows it down, and the 30-year mortgage could be back near 6% within weeks.
But until then….stagnation.
Oh the humanity!
Rates just keep grinding.
The 30-year fixed stopped its decent near 6.23% in late April and has climbed every week since to 6.56% today. (Freddie Mac PMMS) That’s not a dramatic move but the narrative is negative, given the consensus entering 2026 was that rates would drift lower as the Fed eased.
But then we started the Iran sidequest. Right or wrong.
Instead, energy prices are lifting all inflation numbers. April inflation came in at a three-year high of 3.8% YoY, and interest rates levitate with energy prices.
But contrary to some many analysis and the TV news trying to grab you with a salacious headline or two, the Fed can’t fix this by raising rates. They do not have control over the demand for energy/oil. In fact, raising rates may even make this inflation worse.
So as the Fed watches inflation spike, they will most likely just sit this one out.
When could this end?
If a credible Iran de-escalation holds, crude could enter free-fall (it already fell sharply through May on ceasefire reports), the energy contribution to CPI reverses, the 10-year follows it down, and the 30-year mortgage could be back near 6% within weeks.
But until then….stagnation.
Oh the humanity!
Mortgage Demand Bent This Week. It Did Not Break.
If real demand is the engine of inventory, mortgage-application data is where you check the fuel gauge.
The Mortgage Bankers Association’s index fell 8.5% for the week ending May 22, which is the kind of number an internet doomer loves.
But, peel back one layer: purchase applications slipped just 0.4% on the week but were running +5% year-over-year; refinance volume dropped 18% on the week yet sat +19% above last year. (MBA Weekly Applications Survey)
A weekly drop alongside an annual gain has the signature of latent demand.
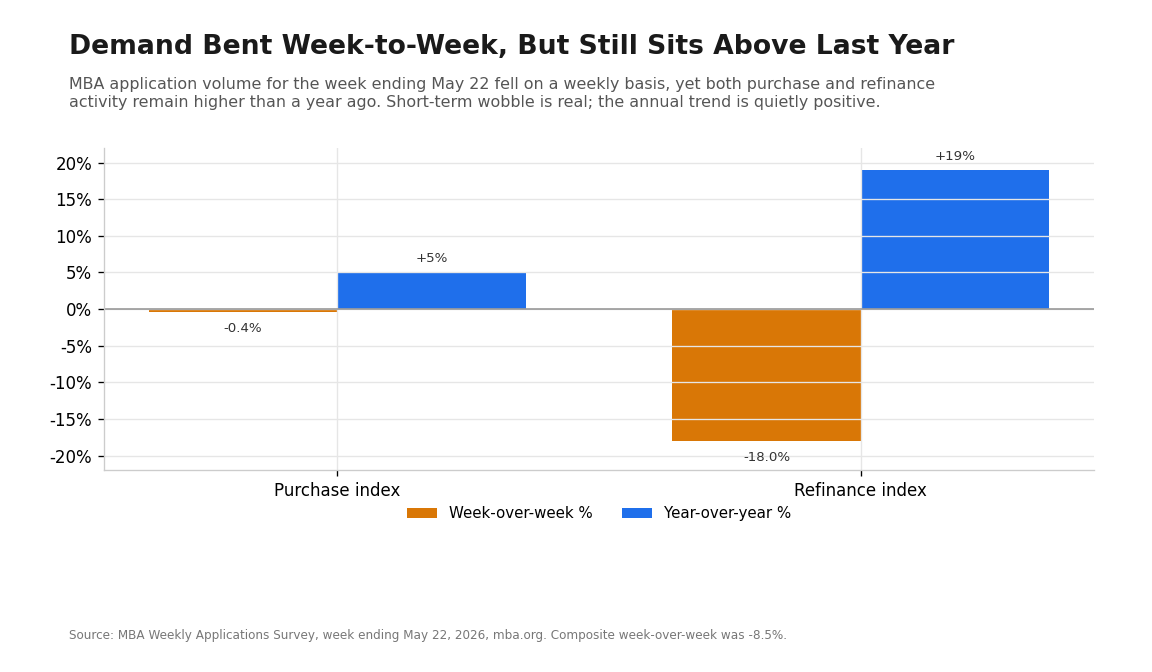
Buyers who wobble when rates tick up but who are, in aggregate, more active than they were a year ago.
That is consistent with what we have been arguing for months, that the marginal buyer is waiting in the wings rather than gone for good. It is also the micro-level confirmation of the macro inventory story. You do not get inventory falling below last year unless somebody is buying the houses, and the purchase index says somebody is.
Counterpoint, what if this is the top? A fair counter-thought I had, is that a year-on-year gain is a low bar, because last year was awful.
Year-over-year comparisons flatter a market that is still operating at roughly 4 million existing-home sales annualized, near the slowest pace in three decades. (NAR) A +5% purchase reading off a generational-low base is not a boom; it may be noise dressed as a trend, and the 8.5% weekly drop could be the leading edge of a rate-driven rollover if the 30-year pushes toward 7%. Consumer sentiment supports the bear here: the University of Michigan index hit a record-low 44.8 in May, its third straight monthly decline. (University of Michigan) A consumer that frightened does not usually go on to bid up housing.
But then again, poor consumer sentiment is almost always a bullish indicator, and a signal to buy.
A Quick Ad Break
Totally shamless plug for my little book.
If this is the kind of market read you want in your inbox every Sunday, the deeper version lives in my book: The 5 Ways: How Real Estate Investors Make Money and Build Wealth.
Real estate pays you five different ways simultaneously: cash flow, appreciation, loan paydown, tax benefits, and inflation hedging. Investors who win in choppy markets are the ones who understand they are never betting on just one of them. In a week where the data is sending mixed signals, that framework is the key to your success.
My book is the cliff notes. Just ~50 pages and you are ready to rock and roll.

Anyone can build wealth with real estate.
Even you.
The Buyer’s Market May be Dying
Here is the number that should make every real estate investor sit up.
Inventory just went negative.
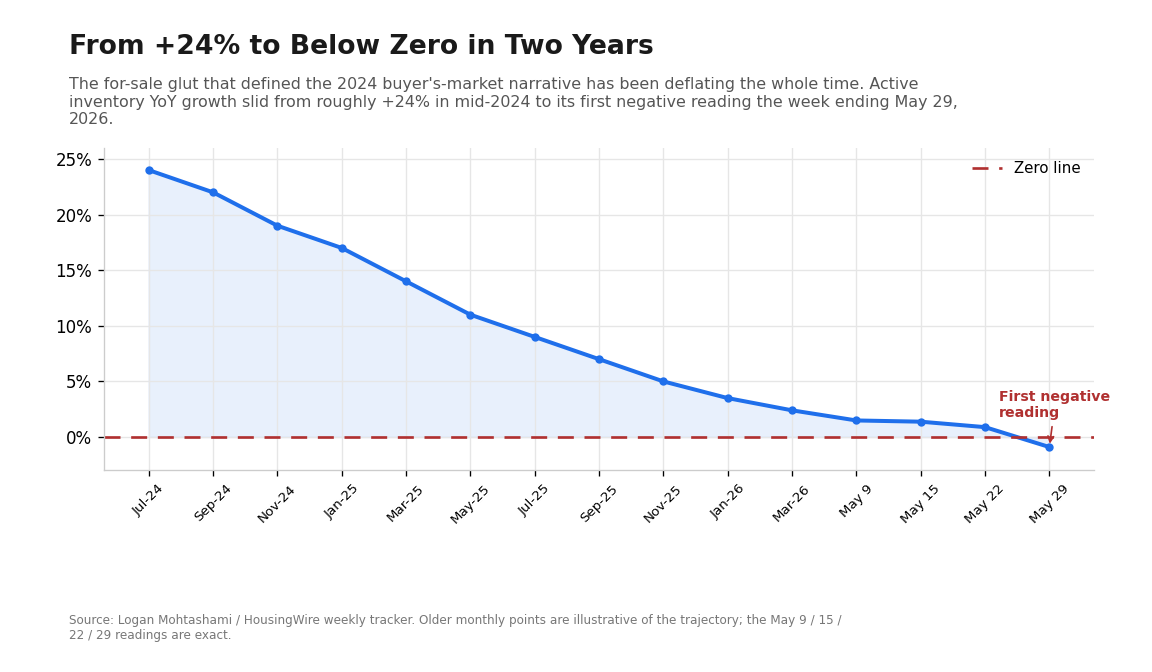
For the week ending May 29, 2026 active for-sale inventory just hit 795,921 listings, against 803,479 in the same week of 2025. That is roughly −0.9% year-over-year (calculated from the two counts), the first negative reading of this entire cycle (Housing economist Logan Mohtashami).
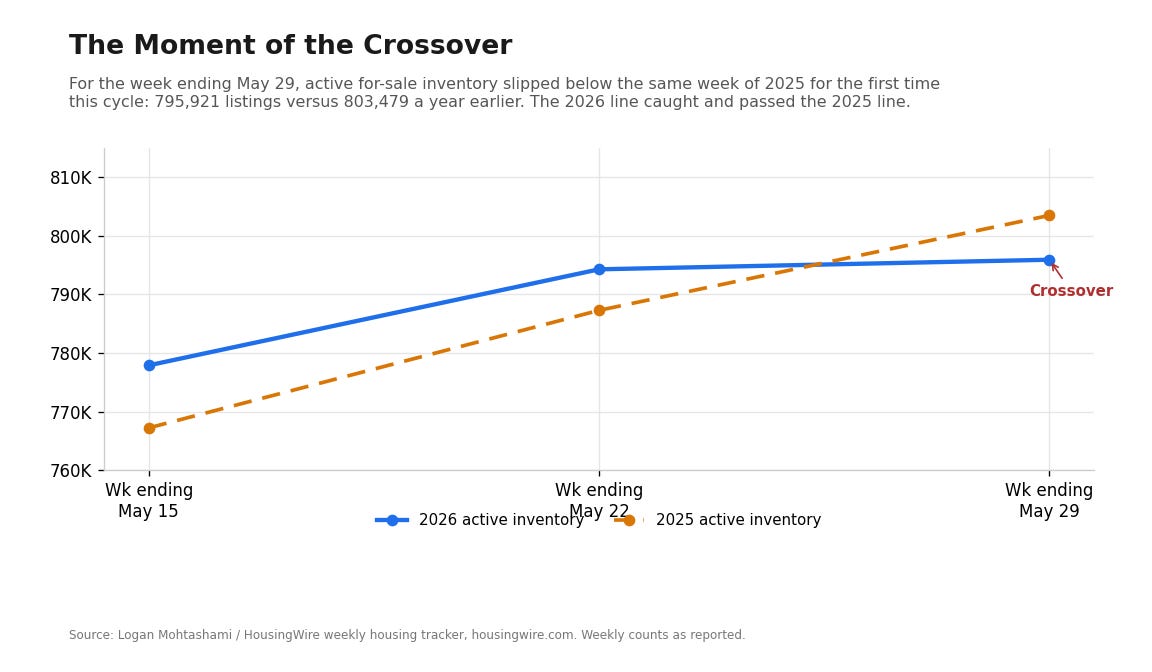
Rewind the tape and the move is even starker.
18 months ago, active inventory was growing around +24% year-over-year. The deceleration ran in a straight line: roughly +12%, then +5%, then this month’s sequence of +1.49% (May 9), +1.38% (May 15), +0.89% (May 22), and now negative. (HousingWire tracker) The slope is accelerating, with the largest single-week step coming right before the crossover.
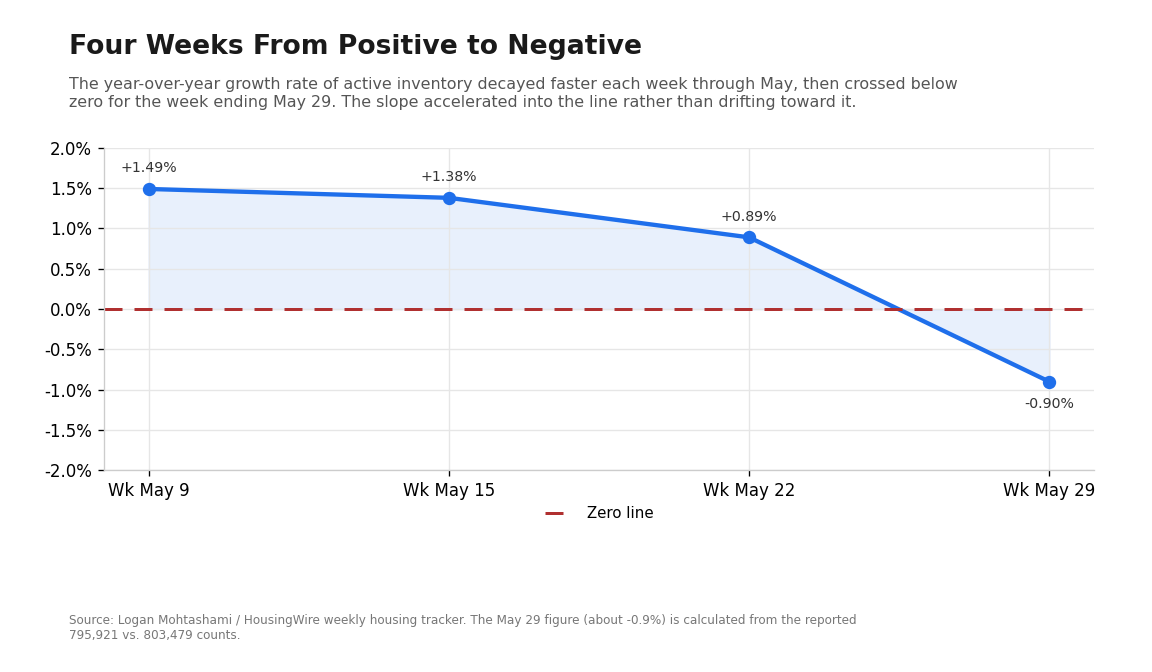
We are still in a national “buyer’s market,” but this narrative could be finally breaking. The for-sale glut narrative the press has run since mid-2024 has finally crossed the line.
And almost nobody is talking about it, because our housing data sucks.
More on that in a moment.
Why is inventory falling? Two forces, both real.
First, sellers appear to be stepping back. They are not getting the price they want adn they are still employed so they do not need to sell. (we have few forced sellers, as we may during a recession/high unemployment).
When months-on-market climbs and price cuts pile up, would-be sellers pull listings, rent the house instead, or simply stay put. The lock-in effect that defined 2023 and 2024 has not gone anywhere; a homeowner carrying a 3% mortgage still has little reason to sell into a 6.5% market.
In fact, the organic seller pool, the divorces, job moves, and downsizes that have to transact, is small and getting smaller relative to demand.
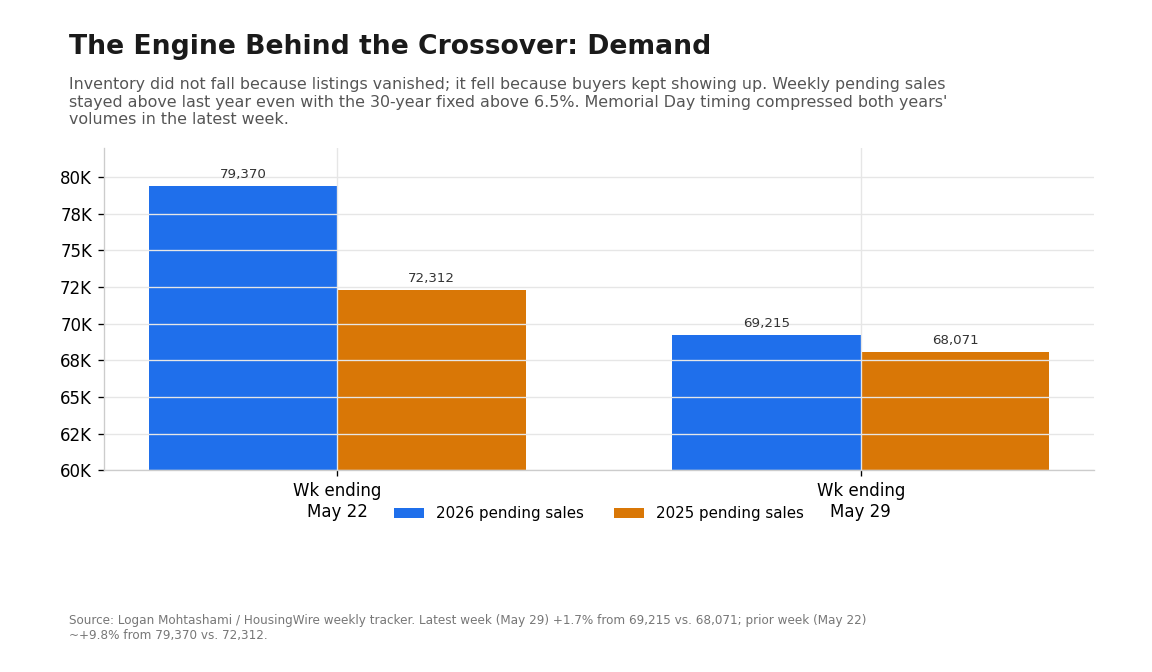
Second, demand is more durable than the headlines suggest. The same tracker shows weekly pending sales of 79,220 versus 74,212 a year ago, ~ +6.7%, with demand at multiyear highs. (HousingWire) Crucially, that demand is showing up at rates above 6.5%, which tells you it is grounded rather than speculative.
When supply growth collapses and demand grinds higher, the math takes over.
Months of supply compress, days-on-market fall, and the share of listings cutting price stops expanding.
Eventually, prices firm.
That is the cycle turn setting up underneath a market that still believes it is a buyer’s market.
The honest caveat, stated plainly so nobody can ambush you with it. This is the weekly tracker, built on Altos and Realtor.com real-time data. The monthly series most outlets quote, including Realtor.com’s and the NAR-style closings data, still reads positive year-over-year because it lags by design (and recall Fairweather’s point from the Weekly 3 about exactly this kind of lag and revision risk). The two are not in conflict; the monthly series is decelerating hard toward the same crossover, it is just a step behind.
Just as important: Mohtashami himself frames this as a positive, demand returning as rates flirt with the low 6s, not a distress signal, and inventory at 795,921 is still near multiyear highs, nowhere close to the 2021 scarcity lows. This is normalization and a cycle turn, not a supply collapse. The skeptical-but-grounded read, in other words, not the panic one.
What changes if this holds.
Why is this important?
First, the “buyer’s market” headline will start to disappear. And this matters.
The major portals and real-estate desks tend to pivot their language within a couple of months of a turn like this: “buyer’s market” softens to “balanced,” then “competitive.”
Buyer psychology shifts the day the framing does.
Two, price cuts shrink. The elevated share of listings with reductions is a function of a year-long supply build. Reverse the build and sellers slowly regain footing. The fastest-moving number over the next 90 days may be the share-of-listings-with-a-price-cut.
Three, the deep-discount buy gets harder. Investors who have been picking off motivated sellers at a wide margin had leverage because they were often the only serious bid.
If supply tightens and prices steady, that bid widens and the discount narrows.
The deals are still there; they appear to be getting more competitive.
This is the moment the diligence has to get sharper, not looser. When you are the only bidder you can be sloppy on price and still win. When the bid widens, your underwriting is the edge. If you run your numbers yourself (I hope you all are!), as I still do, you need a deal analyzer. And guess what, I just built one, free for you as a reader of the newsletter 🙂 .
You can access it for free here: Deal Lab. I’m still building it out so please email me with any feedback so I can make it even better.

This should cut the time it takes to run your numbers in half. Fewer keystrokes, no spreadsheet required when you’re standing in a driveway deciding whether to offer.
Enjoy.
Nashville Market Corner: Inventory Up, But So Are Prices.
Let’s talk Nashville, which is looking like a leading indicator of where the real estate market is nationally.
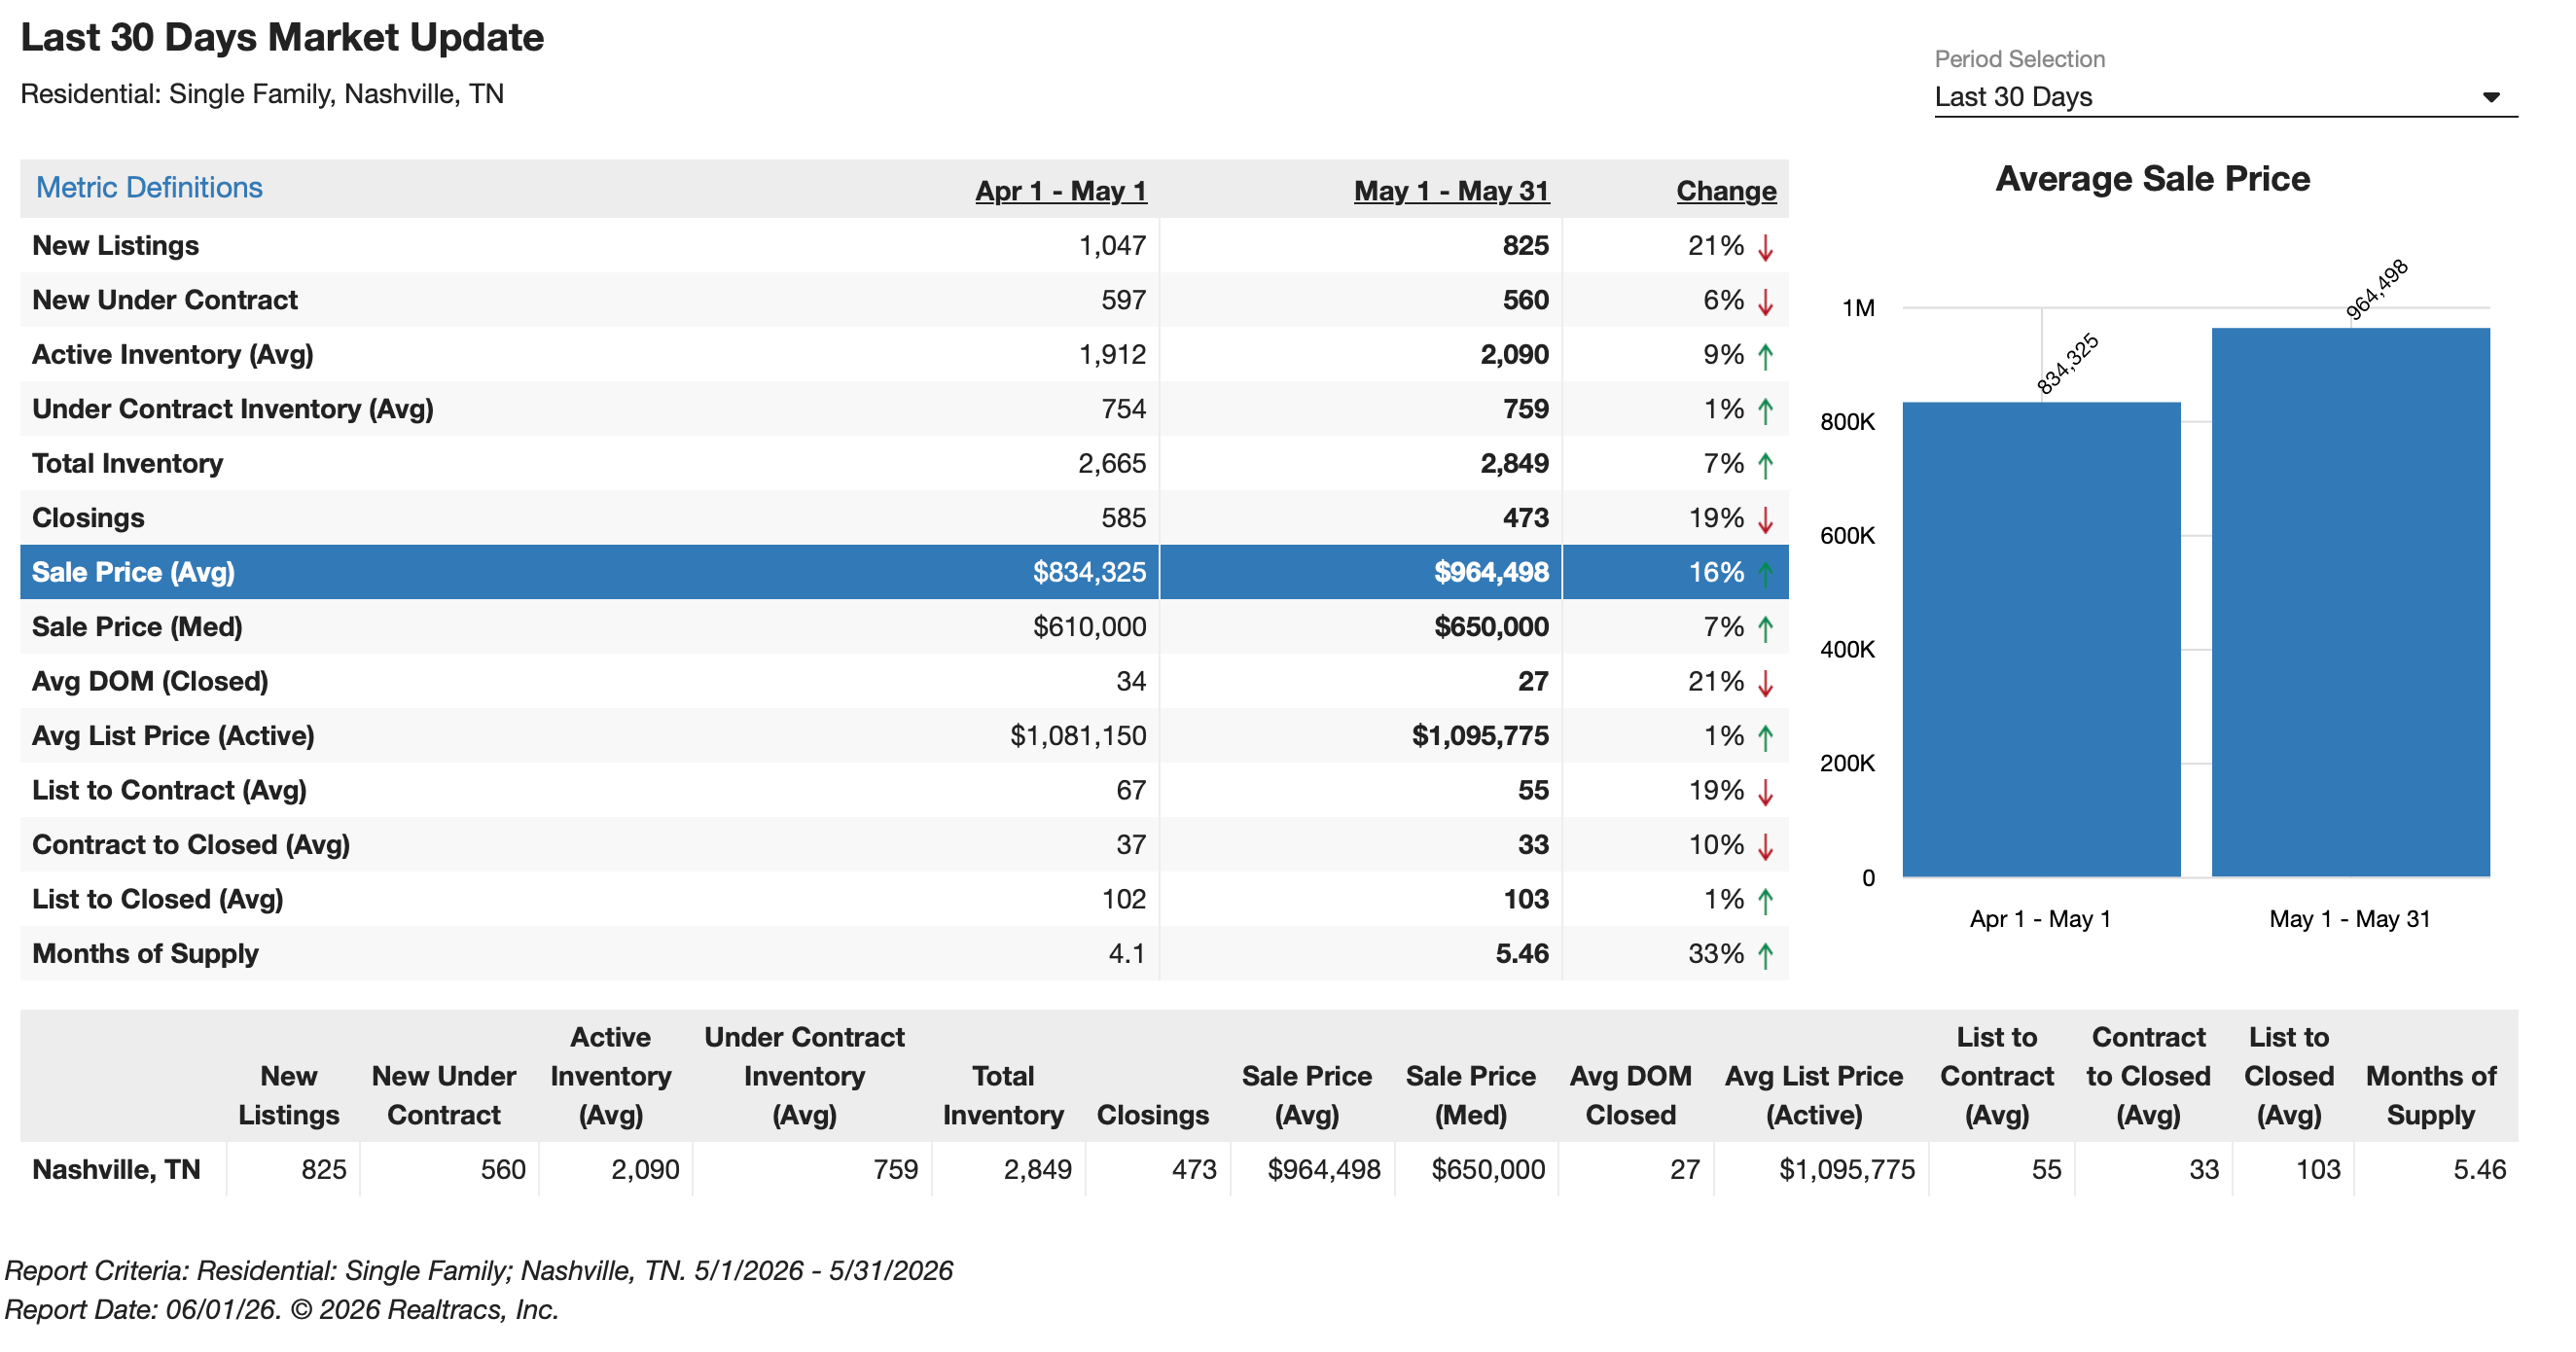
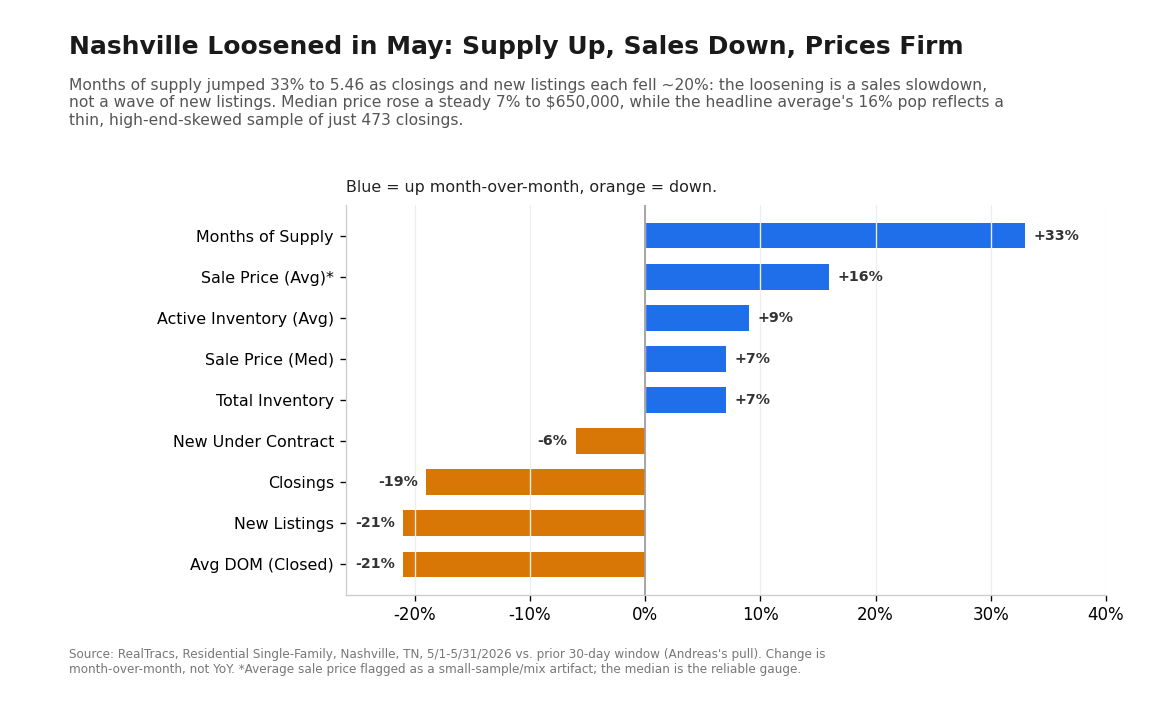
Single-family inventory in the city proper rose to 5.46 months of supply, up big (33%) from the prior 30-day period. Average active listings increased 9% to 2,090, and total inventory climbed 7% to 2,849. (RealTracs MLS) The build ran counter to the national trend, where active for-sale inventory turned negative year-over-year for the first time this cycle.
This is more about a slowdown in sales than to a wave of new supply.
New listings fell 21% to 825, and closings dropped 19% to 473. Months of supply, a measure of inventory relative to the pace of sales, widened largely because transactions cooled faster than listings did.
And despite all of this, prices rose and homes sold fast.
The median sale price rose 7% to $650,000, and homes that sold moved more quickly, with average days on market for closed listings falling to 27 from 34. (RealTracs)
For investors, the numbers point to a narrow window of buyer leverage in Nashville even as that leverage shifts back toward sellers across the country. The opening appears concentrated at the upper end of the market: the average active list price stood at $1,095,775, well above the $650,000 median sale.
This pattern is instructive for those of us operating in the Nashville trenches.
The city proper is not mirroring the broader national tightening; instead, it is offering a brief period of relative balance at the premium segment. Sellers at the high end appear disciplined—new listings contracted sharply, which limits the risk of a sudden flood—but demand has cooled enough to give buyers breathing room on properties listed above the median.
As default skeptics, we view I development with caution rather than celebration. The median price advance of 7% confirms underlying strength, supported by Nashville’s structural advantages: sustained job growth in key sectors, continued in-migration, and constrained developable land in the core. Yet the drop in closings reminds us that higher borrowing costs and selective buyer caution can still slow absorption. Days on market remain historically low at 27, signaling that well-priced, desirable homes continue to move without extended exposure.
In other words, this looks not like weakness in the market, but normalization after years of compressed supply.
Stay tuned.
My Skeptical Take
Our housing data sucks. (as I’ve lamented many times before).
Almost every headline is built on data that looks backward.
“Foreclosures up 26%” sound spooky, until you see it is really just normalization off a low base.
The most-quoted inventory and sales numbers still describe a buyer’s market that the real-time data says is already ending. Even the inflation numbers we get are lagging and particular to a short term energy spike. As Mr Buffett has said:
“In the business world, unfortunately, the rear-view mirror is always clearer than the windshield.”
— Warren Buffett
We, as real estate operators, have an edge and its not access to data; everyone has the data now.
The edge is reading the leading version of it and being willing to act before the crowd.
So, the real-time inventory series flipped negative this week while demand held positive year-over-year and rates ground higher. If that holds, the “wait for the buyer’s market to deepen” plan that so many sidelined buyers are running may turn out to be a plan to miss the turn. I would rather be early and underwritten to today’s rates than late and chasing a narrative that already moved. My ears are perked, with my eyes looking over the horizon at how the bond market reacts over the coming 3-6 weeks.
As always, this is one investor’s read of the data, not advice for your specific situation. Run your own numbers, and if you want the framework I run mine through, it’s all in the book.
Until next time. Stay Curious. Stay Skeptical.
Herzliche Grüße,
—
P.S. Want to level up your real estate game?
You can consult with me, The Skeptical Investor! Get professional advice from someone who actually owns, operates, and brokers real estate.
Want to Grow? - Get clarity on how to grow your business or scale.
Stuck? - Get answers to your problem, let's hop on the phone and figure it out.
No "guru" trying to sell you an expensive course. No BS. No fluff. Only results.
I'll give you my frank, brutally honest advice. Book a call with me today.
It’s 2026. Be an owner.
Schedule your 1-on-1 call now.
Comments
Nothing yet. Say the first thing.
Sign in to join the conversation.