Decentralized exchanges (DEXs) have revolutionized the way digital assets are traded by eliminating the need for intermediaries. Among these, Uniswap has emerged as a leading protocol, with its latest iteration, Uniswap v3, introducing concentrated liquidity, allowing liquidity providers (LPs) to allocate capital more efficiently within specified price ranges. However, this design also introduces new complexities, particularly concerning Loss Versus Rebalancing (LVR), a form of impermanent loss that LPs experience due to arbitrageurs' interactions with the pool.
LVR quantifies the difference between an LP’s earnings and the theoretical optimal returns they could have achieved by actively rebalancing their positions. Unlike traditional AMMs, where liquidity is uniformly distributed across all possible prices, Uniswap v3’s concentrated liquidity model requires a more nuanced approach to measuring LVR. Since liquidity is allocated within specific price ranges, LPs may face significant losses when asset prices move beyond these ranges, leading to inactive capital and missed arbitrage opportunities. This problem is further exacerbated by the presence of dynamic fees, which affect LP profitability in ways that are not present in previous AMM iterations.
This study is crucial for understanding the economic viability of providing liquidity in Uniswap v3. By analyzing the impact of price volatility, liquidity depth, and trading activity on LVR, this research provides insights into the profitability and risks associated with LP participation. The findings will help LPs optimize their strategies, such as adjusting liquidity ranges dynamically or employing algorithmic rebalancing techniques. Additionally, this research contributes to broader discussions on AMM design improvements by highlighting the trade-offs between concentrated liquidity, capital efficiency, and risk exposure.
This research aim to answer the following questions
Is there a significant difference in LVR across different trading pairs?
Does different fee tiers attract different levels of trading activity and risk, and what impact does it have on the overall returns and LVR for liquidity providers?
How does market volatility impact LVR on Uniswap v3?
Data Source
The data for this analysis is sourced from Flipside Crypto, a platform that provides structured blockchain data, enabling precise and efficient extraction of relevant metrics for various chains. We used SQL queries to extract the required data from Flipside Crypto and then downloaded it for further processing.
Blockchain and Timeframe Selection
We focus on the Ethereum blockchain for the period February 28, 2024, to February 28, 2025. The rationale behind selecting Ethereum is:
High Liquidity & Trading Volume: Ethereum hosts the deepest liquidity pools and the most active Uniswap V3 markets, making it ideal for measuring LVR accurately.
Institutional and Retail Participation: A diverse mix of participants ensures realistic market conditions, affecting price impact and arbitrage opportunities.
Reliable and Extensive Data: As Ethereum is the most mature DeFi ecosystem, it provides comprehensive historical transaction data for accurate LVR quantification.
Pool Selection
We analyze three key liquidity pools on Uniswap V3:
USDC-USDT
WBTC-ETH
ETH-USDT
These pools are chosen because they are the top three liquidity pools on Ethereum, ensuring:
High trading frequency, leading to more rebalancing events.
Significant arbitrage activity, which directly impacts LVR.
Diverse asset types (stable-stable, blue-chip crypto, and ETH-based pairs), allowing for a broad examination of LVR dynamics across different market structures.
By focusing on these high-liquidity pools, we ensure that the results reflect real-world trading conditions and provide meaningful insights into the impact of LVR on Uniswap v3.
Data Processing & Visualization
For analysis and visualization, we use Python along with the following libraries:
Pandas: For data cleaning, transformation, and statistical calculations.
Matplotlib: For generating visual representations of LVR trends, pool rebalancing, and price movements.
These tools allow us to efficiently process large datasets from Flipside Crypto and create insightful visualizations to illustrate LVR trends over time.
Automated Market Makers (AMMs) are smart contract-based trading protocols that facilitate decentralized trading by algorithmically determining asset prices. Unlike traditional order book exchanges, AMMs rely on liquidity pools, where users deposit tokens to enable automated swaps. The most well-known AMM model is the constant product formula, introduced by Uniswap v2, which maintains the invariant:
where and are the token reserves, and is a constant. This equation ensures that the product of the two token reserves remains unchanged after each trade, leading to a smooth pricing curve. While this model allows for permissionless trading, it exposes LPs to impermanent loss, which occurs when asset prices shift relative to the initial deposit conditions. This form of loss is exacerbated in highly volatile markets, where price fluctuations create arbitrage opportunities that benefit traders at the expense of LPs.
Uniswap v3 introduced concentrated liquidity, allowing LPs to provide liquidity within a custom price range instead of across the entire curve. This design significantly improves capital efficiency, as liquidity is allocated more effectively within active trading ranges. LPs can adjust their positions dynamically, selecting price bands where they expect trading activity to occur. However, this also means that if the price moves beyond the specified range, their liquidity becomes inactive, resulting in reduced fee earnings and potential capital inefficiencies.
Additionally, Uniswap v3 introduced variable fee tiers (0.01%, 0.05%, 0.30%, and 1%), allowing LPs to select the most appropriate fee structure based on market conditions and asset volatility. This feature adds another layer of complexity to liquidity provision, as LPs must balance fee earnings with the risk of their position being arbitraged. The interplay between concentrated liquidity and dynamic fees is a critical factor in determining the profitability of LPs and plays a central role in understanding LVR in Uniswap v3.
Uniswap v1 (2018) - The Foundation
Liquidity Pools: Users provided liquidity in a 50:50 ratio of two tokens, earning fees from trades.
Limitations: Lack of flexibility, inefficiency in capital allocation, and exposure to impermanent loss.
Uniswap v2 (2020) - Enhancing Functionality
ERC-20/ERC-20 Pairs: Allowed direct swaps between two ERC-20 tokens without requiring ETH as an intermediary.
Flash Swaps: Enables users to borrow assets temporarily and return them within a transaction.
Price Oracles: Introduced time-weighted average price (TWAP) oracles to improve price reliability.
Limitations: Capital inefficiency as liquidity was uniformly distributed across all price ranges.
Uniswap v3 (2021) - Capital Efficiency & Concentrated Liquidity
Concentrated Liquidity: Liquidity providers (LPs) could allocate capital within custom price ranges instead of distributing it evenly across all prices.
Active LP Management: LPs had to manage their positions actively, adjusting price ranges to maximize fee earnings.
Non-Fungible Liquidity Positions: Each liquidity position became unique and represented by an NFT instead of fungible LP tokens.
Lower Slippage & Higher Efficiency: Improved efficiency in liquidity use, benefiting traders and LPs.
LVR is a refinement of impermanent loss, capturing the opportunity cost LPs face when they do not actively rebalance their liquidity positions. In traditional AMMs, LPs suffer impermanent loss as asset prices shift, but in Uniswap v3, the problem is compounded by the fact that liquidity is no longer passively spread but concentrated within selected price bands. Arbitrageurs play a significant role in extracting value from these pools, often at the expense of LPs who do not dynamically adjust their positions. The key drivers of LVR include:
Price Volatility: Higher volatility leads to greater arbitrage opportunities, increasing the rate at which LPs experience LVR.
Liquidity Depth: Shallow liquidity pools are more susceptible to large price swings, amplifying LVR effects.
Fee Structure: Different fee tiers impact the rate at which LVR accumulates, as higher fees can offset some of the losses.
Rebalancing Frequency: LPs who rebalance their positions more frequently may reduce LVR but incur higher gas costs, creating a trade-off between optimization and cost efficiency.
Recent research has explored the impact of LVR on LP profitability. Studies indicate that high volatility markets lead to greater LVR, as arbitrage opportunities increase with price fluctuations. Additionally, dynamic fee structures in Uniswap v3 influence the extent to which LVR affects LPs, making it essential to analyze LVR under varying market conditions. Understanding LVR is vital for both LPs and AMM designers, as it highlights fundamental inefficiencies that could be mitigated through improved mechanisms such as automated liquidity management and dynamic pricing models.
Arbitrage Exploitation: LPs provide liquidity within a price range, but when prices change, arbitrageurs rebalance at their expense.
Slippage & Market Impact: Since LPs cannot adjust their positions instantly, they often suffer from adverse price changes.
Higher Concentration: Higher LVR Risk: While concentrated liquidity improves fee revenue, it also increases exposure to LVR if the price exits the chosen range.
To measure Loss Versus Rebalancing (LVR), we use the following key metrics:
LVR (bp): Calculated as σ² / 8 and converted to basis points (bp) for better interpretability.
Daily Variance (σ²): The variance of logarithmic returns based on AMM prices within each day, serving as a measure of daily price fluctuations.
LVR in USD: The estimated financial impact of LVR, obtained by multiplying LVR (decimal) by daily total value locked (TVL) in the pool.
Total Fees: Uniswap v3 trading pools operate under different fee tiers. We analyze 0.3% and 0.1% fee tier pools and sum up the daily trading fees, representing the revenue earned by liquidity providers.
Number of Transactions: The total daily swap count, used as a proxy for trading activity and market engagement.
Average AMM Price: The mean daily price of assets denominated in USDT, offering insight into price trends within each pool.
These metrics collectively allow us to assess LVR’s magnitude, its financial implications, and its relationship with liquidity provider (LP) revenue.
We analyzed three high-liquidity Uniswap V3 pools on Ethereum Chain, with two pools operating at 0.3% fee tier and one operating at 0.01% fee tier, each of which plays a crucial role in determining LP earnings and the effectiveness of LVR strategies.
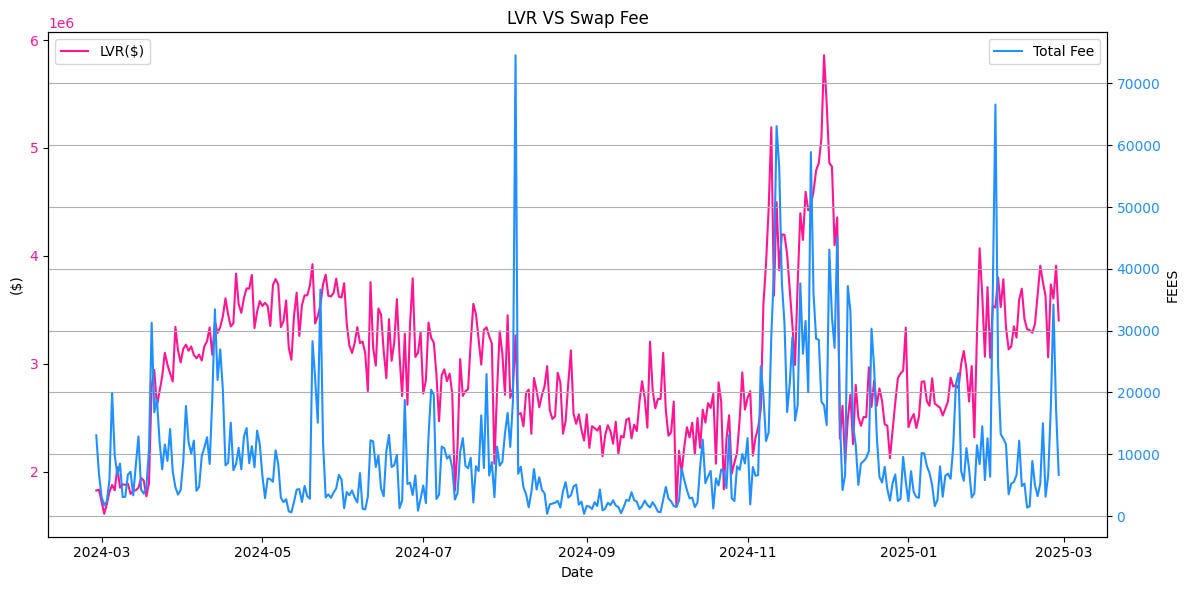
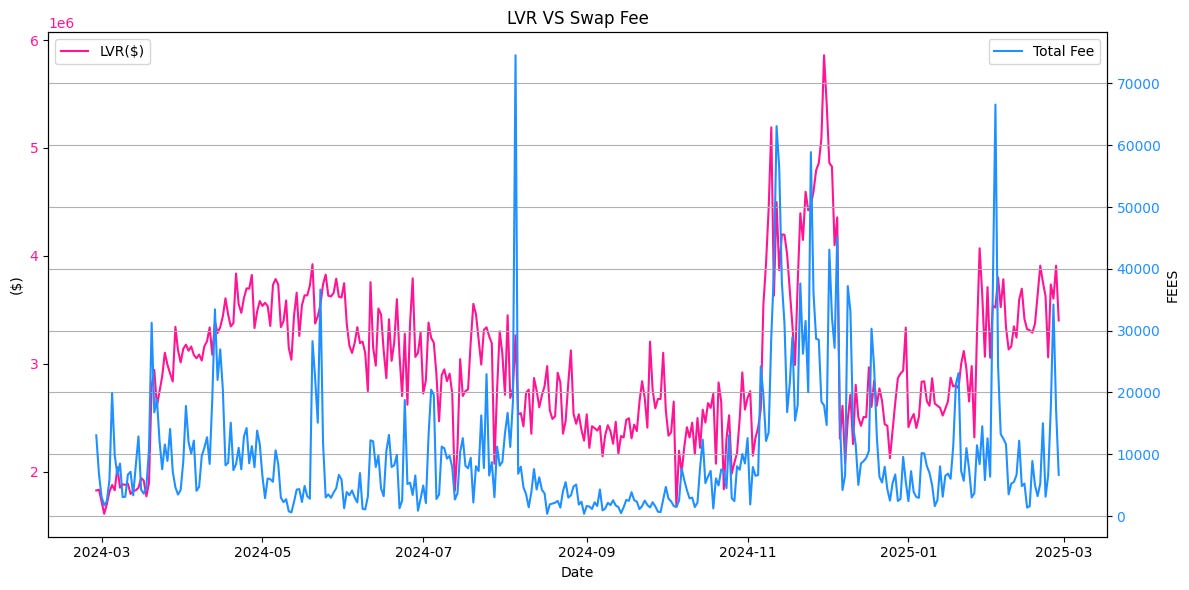
ETH-USDT (0.3% Fee Tier): A major ETH-stablecoin pair with high market activity and significant trading volumes. The 0.3% fee tier ensures LPs earn competitive fees, balancing the risk of LVR.
Figure 1: LVR VS Swap Fee (ETH-USDT POOL)
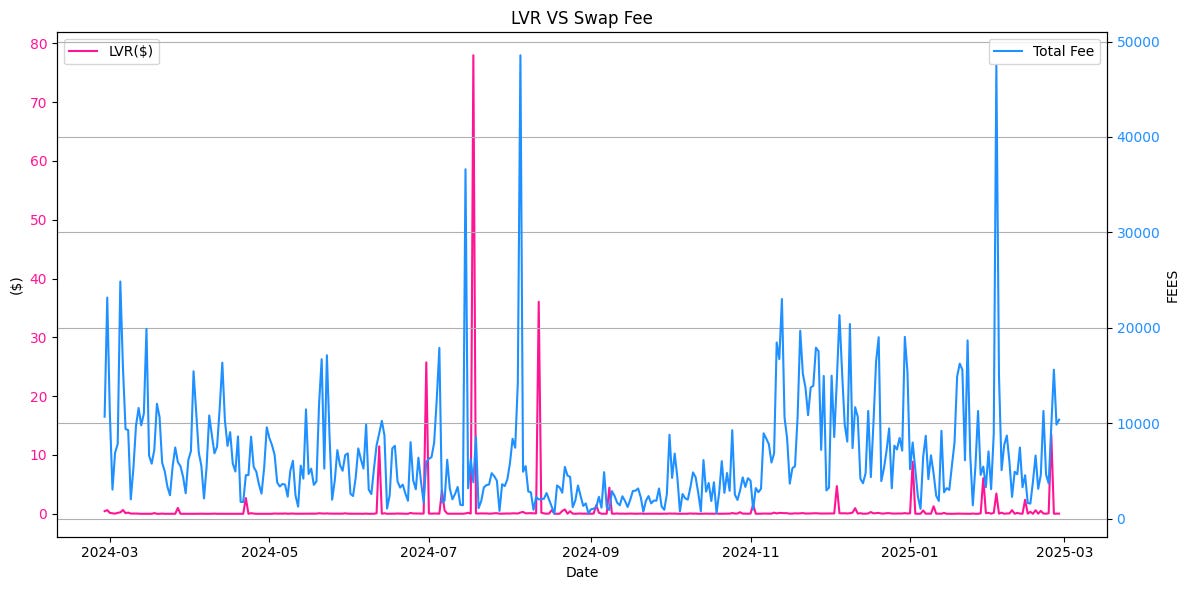
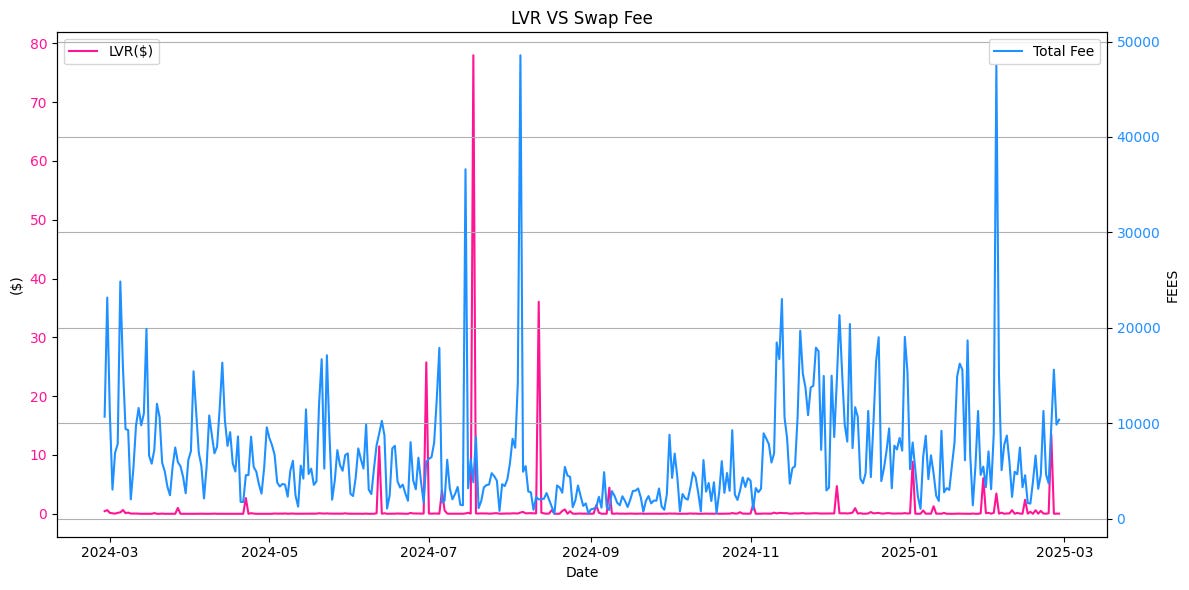
USDC-USDT (0.01% Fee Tier): A stablecoin pair with low volatility and high trading frequency. The lower fee tier is designed to attract large trading volumes but results in lower revenue per trade for LPs.
Figure 2: LVR VS Swap Fee (USDC-USDT POOL)
WBTC-ETH (0.3% Fee Tier): A blue-chip crypto pair with higher volatility and larger price swings, leading to higher potential LVR. The higher 0.3% fee tier helps compensate LPs for the increased impermanent loss risk.
Figure 3: LVR VS Swap Fee (WBTC-ETH POOL)
Daily Rebalancing Approximation: We assume rebalancing occurs at a daily level based on aggregated trading activity, rather than modeling each individual trade.
Log Returns as a Proxy for Volatility: We approximate price volatility using logarithmic returns within daily time windows, which may not capture intraday price swings perfectly.
While these assumptions simplify our approach, they provide a robust framework for quantifying LVR’s impact in a computationally efficient manner.
Our analysis and findings reveals key insights into the relationship between LVR, fee structures, and LP earnings across the selected Uniswap v3. Below, we break down the observed trends and their implications for liquidity providers.
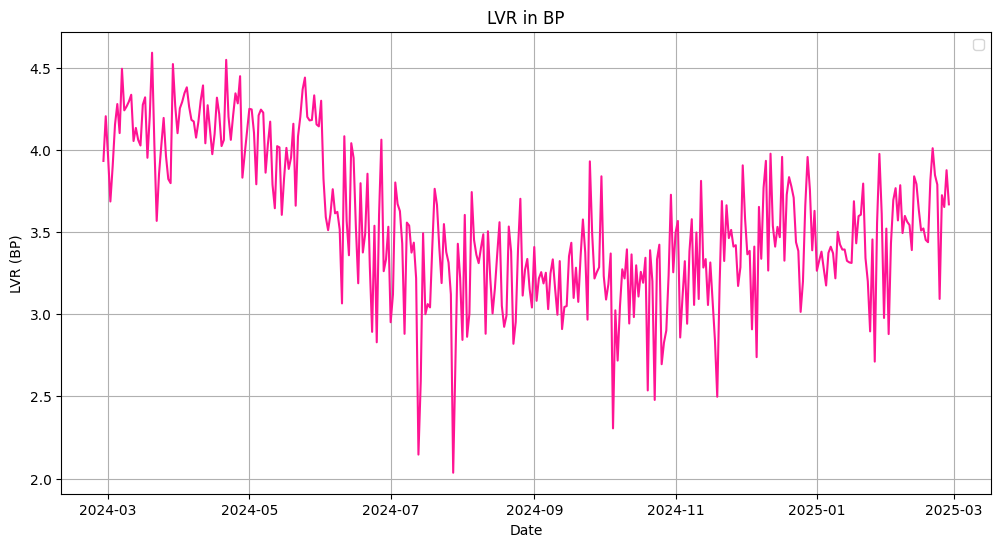
The ETH-USDT pool on Uniswap v3 (0.3% fee tier) demonstrated clear patterns in Loss Versus Rebalancing (LVR) throughout the observed period:
The LVR consistently fluctuated between 2.0-4.5 basis points, with distinct seasonal variations
Early 2024 saw relatively high LVR (3.5-4.5 BP), followed by a gradual decline through mid-2024
July 2024 marked the lowest point (approximately 2.0 BP), after which LVR began recovering
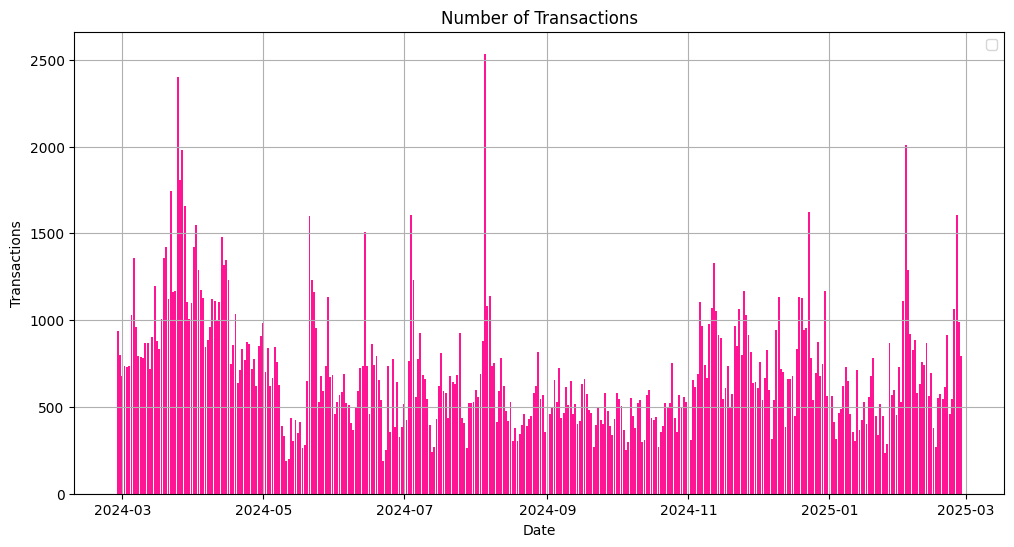
Transaction volume showed an interesting inverse correlation with LVR during certain periods, most notably during high-transaction months (March-April 2024)
The pool experienced three major fee spikes (July, November 2024, February 2025) that coincided with LVR fluctuations
By February 2025, LVR stabilized around 3.5-4.0 BP, returning to levels comparable to mid-2024
The data clearly indicates that while the 0.3% fee tier provides some protection against impermanent loss, it cannot fully shield liquidity providers during periods of extreme market volatility. This relationship between market conditions and LVR creates a complex risk-reward dynamic for liquidity providers in this popular trading pair.
Figure 4: LVR IN BP (ETH-USDT POOL)
Figure 5: Number of Transactions (ETH-USDT POOL)
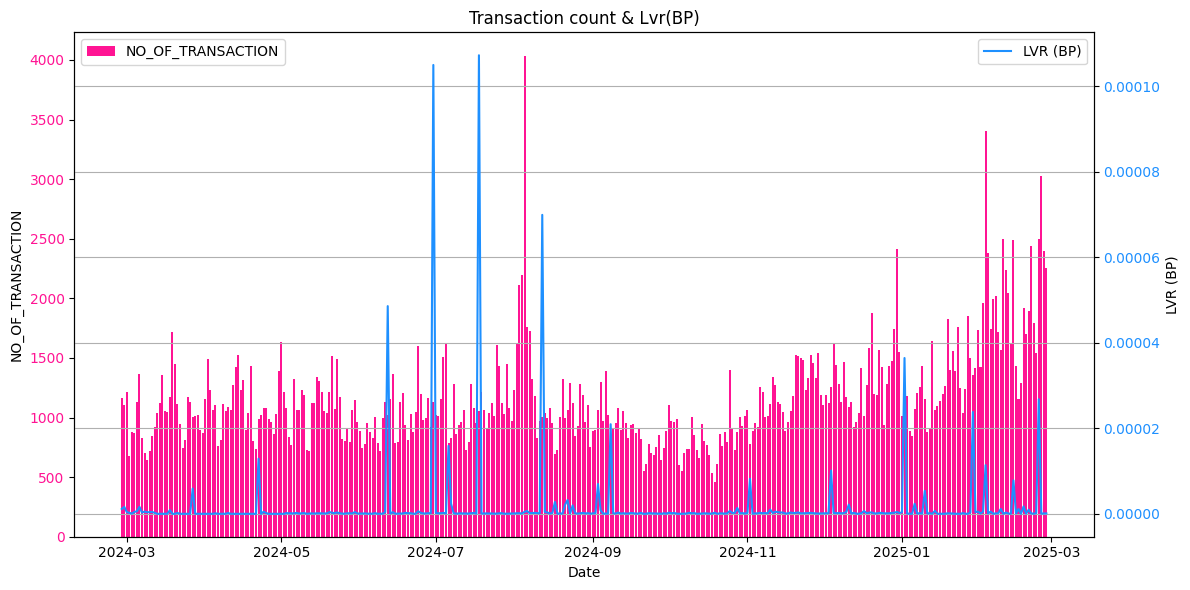
Figure 6: Transaction Count vs Lvr (ETH-USDT POOL)
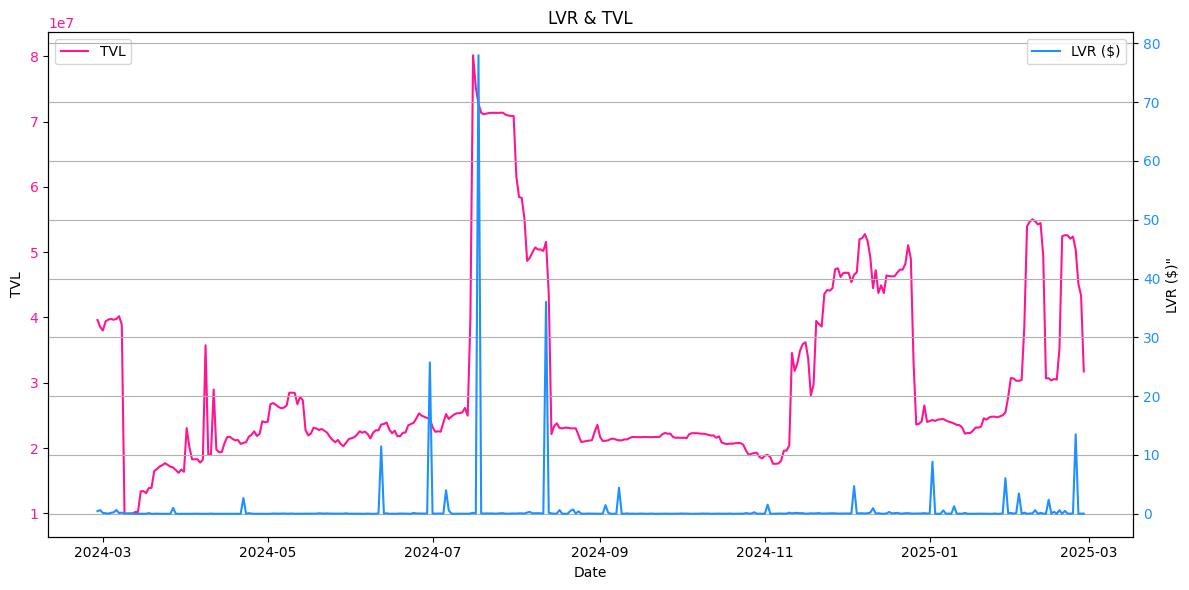
Figure 7: LVR and TVL (ETH-USDT POOL)
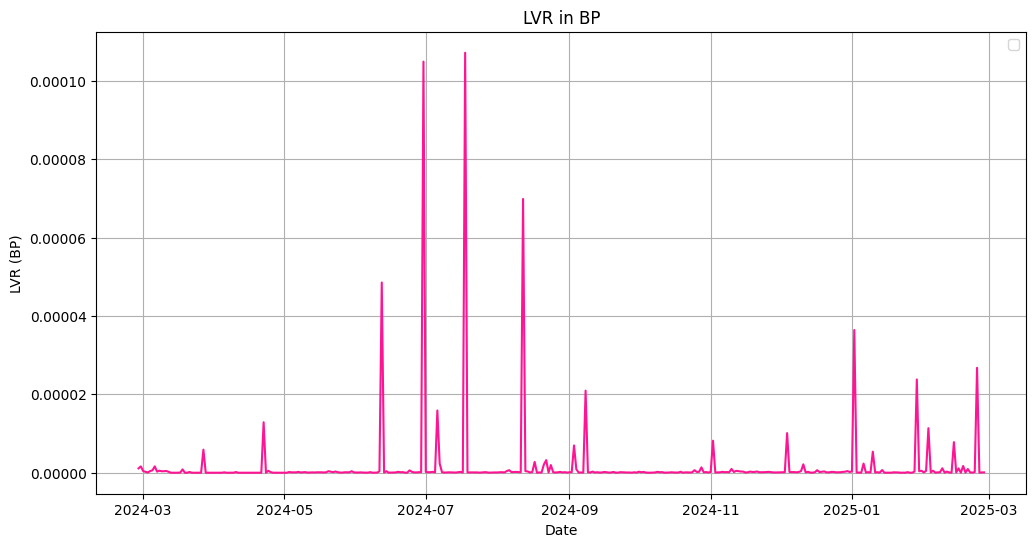
The USDC-USDT pool on Uniswap v3 (0.01% fee tier) shows distinctly different LVR patterns compared to typical volatile token pairs:
LVR remains extremely low most of the time, with occasional sharp spikes reaching up to 0.00011 BP
The most significant LVR spikes occurred in July 2024, with two major peaks exceeding 0.0001 BP
In dollar terms, LVR typically remains below $1, except during volatility events when it spikes to $60-80
Strong correlation between TVL increases and LVR spikes, particularly evident around July 2024
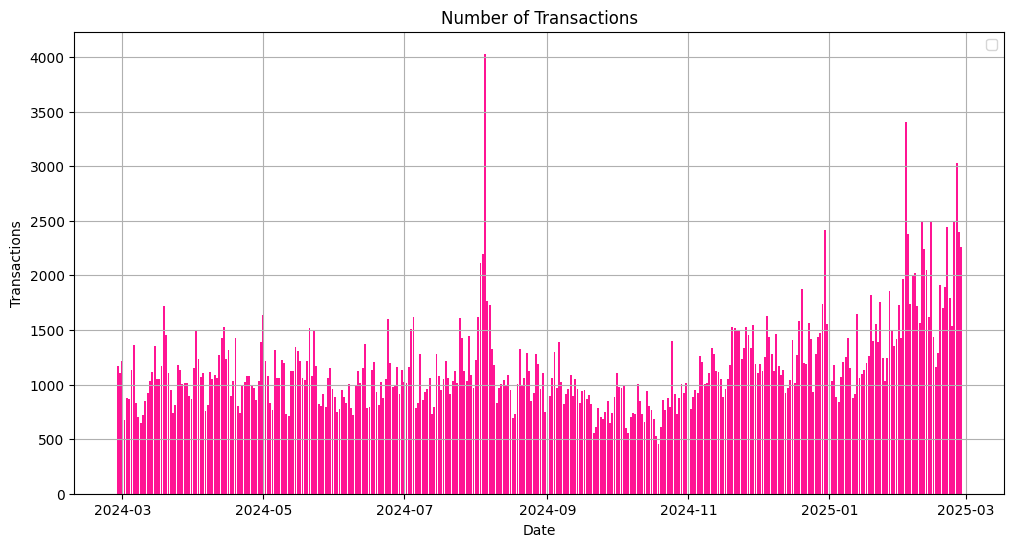
Transaction volume shows minimal correlation with LVR for most of the period, though the August 2024 transaction spike (4000+ transactions) occurred shortly after the major LVR spike
Transaction activity significantly increased in early 2025, but this had minimal impact on LVR
Swap fees show periodic spikes that sometimes align with LVR movements, particularly evident in July 2024 and February 2025
The data demonstrates that the USDC-USDT pool's 0.01% fee tier is generally appropriate for these highly correlated stablecoins, as LVR remains minimal during normal market conditions.
Figure 8: LVR IN BP (USDC-USDT POOL)
Figure 9: Number of Transactions(USDC-USDT POOL)
Figure 10: Transaction Count vs Lvr(USDC-USDT POOL)
Figure 11: LVR and TVL (USDC-USDT POOL)
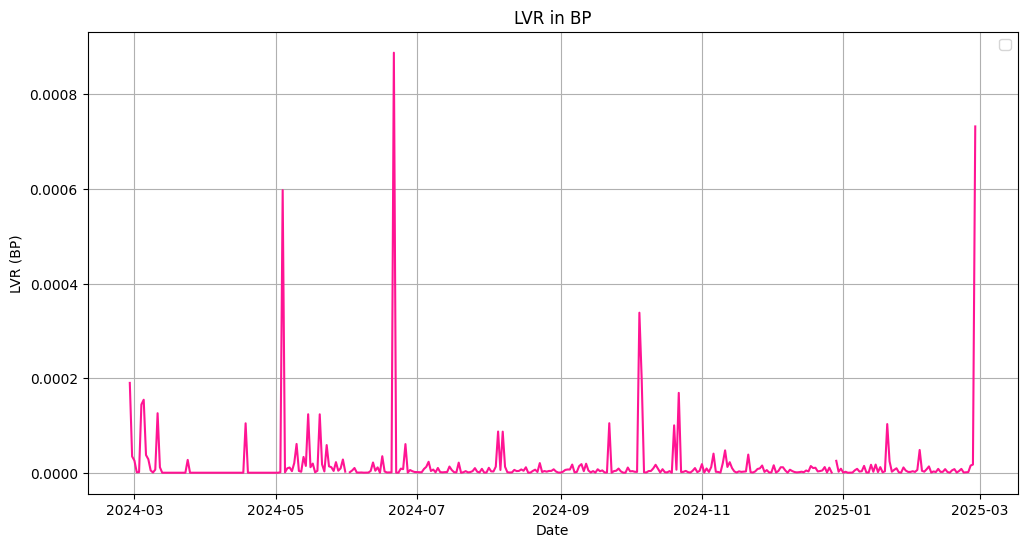
Based on the data presented in these graphs for the WBTC-ETH pool on Uniswap V3 (0.3% fee tier), the LVR metric shows several significant spikes throughout the March 2024 to March 2025 period, with particularly notable peaks in June 2024 and February 2025. These spikes indicate periods when liquidity providers experienced greater impermanent loss compared to what they would have faced with a simple rebalancing strategy.
Key observations:
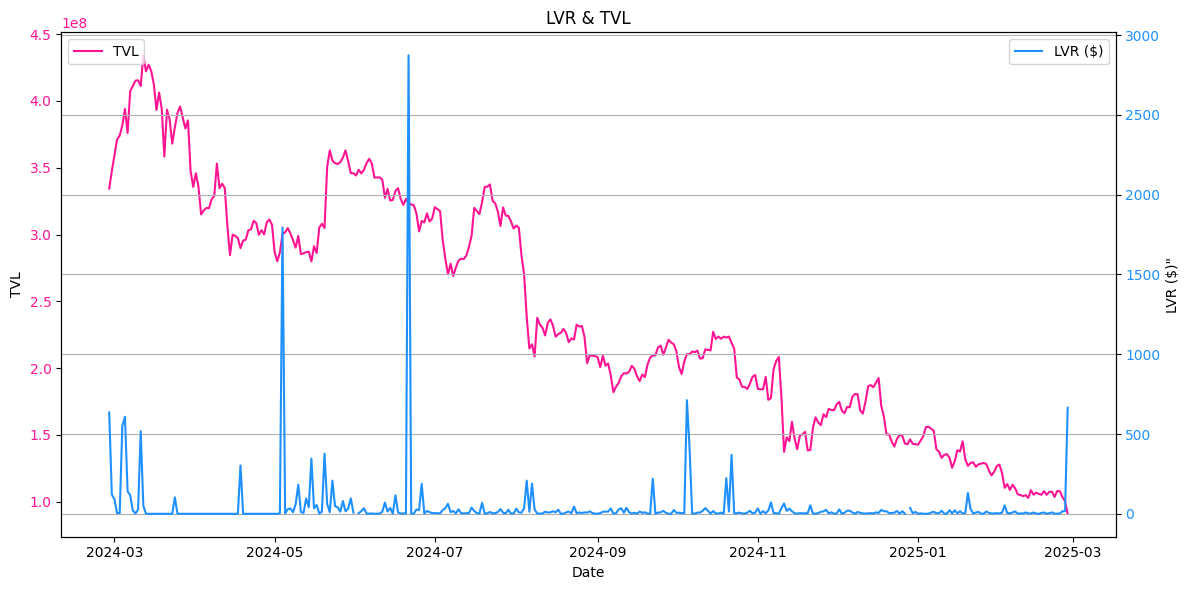
The LVR($) and TVL graph (Figure 15) graph shows that while baseline LVR typically remains below $200, there are dramatic spikes reaching as high as $2,900, suggesting periodic extreme divergence between pool performance and optimal rebalancing.
When comparing LVR with Total Fee (Figure 3), there appears to be some correlation where fee collection increases during periods of higher LVR, suggesting that increased trading activity (and fees) coincides with conditions that create impermanent loss. We also notice that the fees earned consistently cover for the losses incurred on this pool.
Also, the LVR($) and TVL chart (Figure 15) shows a steady decline in TVL throughout the period, dropping from approximately $430M to about $100M, while LVR spikes don't consistently correlate with TVL movements.
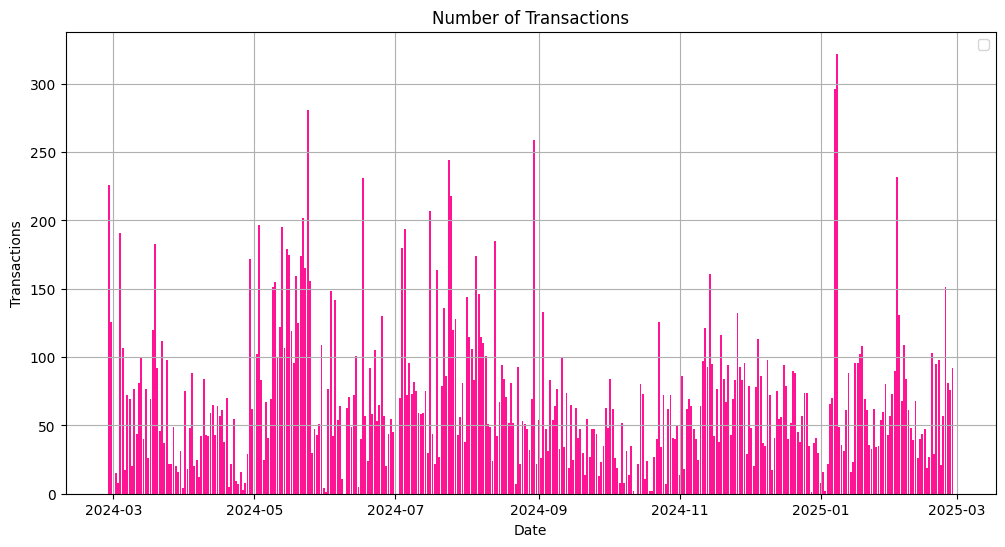
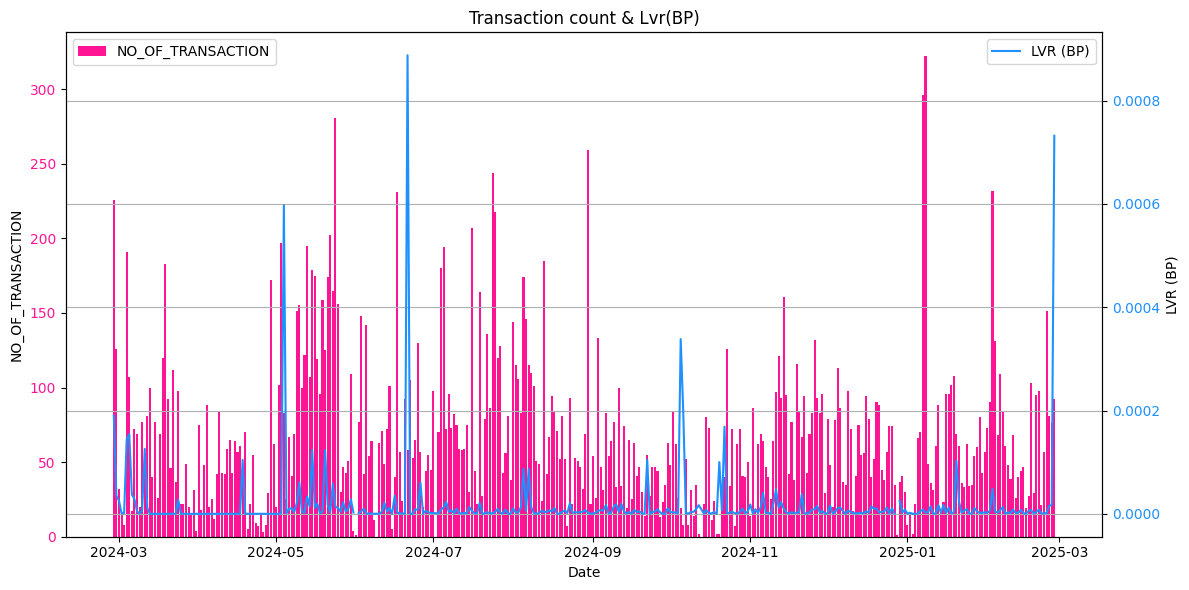
Transaction count data (Figure 13) demonstrates that high transaction volume doesn't always translate to high LVR, indicating that impermanent loss is more connected to price divergence between WBTC and ETH than mere trading activity.
The LVR(BP) measurements (Figure 12) show that when normalized by basis points, the pattern of spikes remains consistent with the dollar value measurements.
Market volatility impacts LVR in this pool primarily through directional price movements between WBTC and ETH. When these assets experience significant price divergence, liquidity providers face higher impermanent loss compared to a simple rebalancing strategy. The 0.3% fee tier, while generating revenue during volatile periods, doesn't always compensate for the LVR experienced during major market movements.
The cyclical nature of these spikes suggests that providers should be particularly cautious during periods of market stress or significant news events that might cause decorrelation between BTC and ETH prices.
Figure 12: LVR IN BP (WBTC-ETH POOL)
Figure 13: Number of Transactions (WBTC-ETH POOL)
Figure 14:Transaction Count vs Lvr (WBTC-ETH POOL)
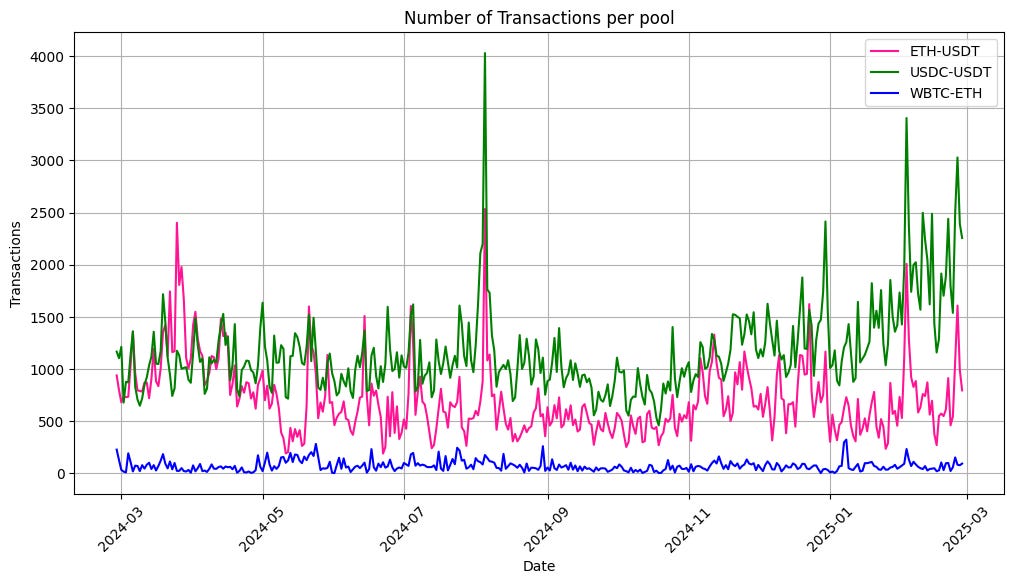
The figure above (Figure 16) represents the daily number of transactions for three Uniswap V3 pools: ETH-USDT (pink), USDC-USDT (green), and WBTC-ETH (blue) over the observed time frame.
Key Observations:
USDC-USDT (Green) Dominates in Transaction Count: The USDC-USDT pool consistently has the highest transaction volume, with significant spikes, particularly in early July 2024 and early 2025. This aligns with the expectation that stablecoin pairs tend to have the highest trading activity due to their frequent use in arbitrage and stablecoin conversions.
ETH-USDT (Pink) Shows Moderate Activity with Volatility: The ETH-USDT pool experiences fluctuating transaction volumes, peaking at various points but generally maintaining lower counts than USDC-USDT. This suggests that ETH-USDT, while actively traded, sees periods of higher volatility and trading cycles.
WBTC-ETH (Blue) Has the Lowest Transaction Volume: The WBTC-ETH pool consistently has the fewest transactions, with relatively small fluctuations. This is expected since WBTC (Wrapped Bitcoin) is used primarily for larger, less frequent trades, making its pool less active in daily transaction counts.
Increasing Trend Toward Late 2024 and 2025: Both USDC-USDT and ETH-USDT show an upward trend in transaction count, indicating growing trading activity over time. The spike in early 2025 suggests a potential market event or increased trading demand.
Looking at the LVR data across the different trading pairs shown in the images above:
Yes, there is a significant difference in LVR across different trading pairs :
Different scales of LVR values: The ETH-USDT pool has LVR in Basis Points ranging from 2.2 - 4.5 BP, the WBTC-WETH and WBTC-WETH pool shows much smaller values, basically under 0 BP
Different relationships with Total Value Locked (TVL): The correlation between LVR and TVL varies significantly between pairs, with some showing strong correlation and others showing more independent movement
The data suggests that different trading pairs have fundamentally different LVR characteristics, likely influenced by factors such as asset volatility, pool liquidity, trading volumes, and market conditions specific to each pair.
Different fee tiers do appear to attract different levels of trading activity and risk:
Risk profiles: Higher fee tiers typically attract more volatile pairs, which is reflected in the dramatically different LVR spikes across charts
Overall returns impact: Pools with higher fees show more dramatic LVR spikes relative to TVL (Total Value Locked), suggesting a risk-return tradeoff where higher fees compensate for higher impermanent loss risk
LVR differences: Lower fee tier pools (likely stablecoin pairs) show more consistent and lower LVR values, while higher fee pools display more extreme LVR events
Market volatility impacts LVR on Uniswap v3 in several key ways:
Direct correlation: The charts clearly show that periods of market volatility (especially July and November 2024) coincide with dramatic spikes in LVR
Amplification effect: Concentrated liquidity positions in Uniswap v3 amplify the impact of volatility on LVR compared to traditional AMMs
Price movement thresholds: LVR spikes when prices move beyond position bounds, visible in the dramatic but infrequent spikes in Image 5 and Image 12
Impermanent loss risk: Higher volatility periods correspond with higher LVR, indicating greater risk of impermanent loss during market turbulence
The data suggests that liquidity providers face a significant tradeoff between earning higher fees and managing LVR risk, particularly during volatile market conditions.

Comments
Nothing yet. Say the first thing.
Sign in to join the conversation.