
Welcome to new readers of the American Geographical Society’s weekly, the AGS Globe! The Globe shares articles on geography and geospatial, along with exciting opportunities and news from our network. Our pieces fall under four categories: Exploring the World, Championing Geography, Mapping the News, and EthicalGEO. As the world revolves, geography evolves. The mission of the AGS Globe is to bring our storied legacy of exploration and thought leadership into the frontiers of the future.

By Betty Huang
Only a very small portion of Earth’s water isn’t in the ocean — about two percent can be accounted for as frozen glaciers and ice caps, and less than one percent is freshwater. Meanwhile, the ocean covers more than 70 percent of Earth’s surface, but much of it remains inadequately studied or monitored. The ocean is deeply connected to processes that regulate Earth’s climate, support marine ecosystems, and provide resources people depend on, like food, energy, and even medicine!
Ocean monitoring is essential for identifying changes and understanding how ocean conditions shift over time. Strong monitoring coverage is consistent and long-term, extends beyond the ocean surface, and measures key physical, biological, and chemical parameters. It is most effective when conducted through a standardized framework - the Global Ocean Observing System (GOOS) is a coordinated, international program that brings together governments, agencies, and research institutions to observe the world’s oceans systematically. This information helps scientists better understand ocean change, predict climate and weather patterns, and inform decisions related to conservation and resource management.
Despite the perception that the ocean is well-monitored through buoys, satellites, and Argo floats, global ocean observation remains uneven, selective, and largely disconnected. Many programs operate in isolation, collecting valuable data that never gets integrated into the broader scientific record. Bridging the gaps between collection systems would build more comprehensive datasets, stronger cross-regional comparisons, and accelerated scientific development in our understanding of ocean change.
Essential Ocean Variables (EOVs) were developed under GOOS as a set of key measurements that scientists have agreed are the most important for understanding how the ocean is changing. GOOS organizes EOVs into three groups:
Physical - sea surface temperature, salinity, sea level, currents, sea ice
Biogeochemical - oxygen, nutrients, inorganic carbon, nitrous oxide, transient tracers
Biological/Ecosystem - phytoplankton, zooplankton, fish abundance, marine turtles, seabirds, marine mammals
The GOOS EOV framework is best for defining and establishing international standards because variables such as dissolved oxygen, nutrients, and ocean carbon don’t fit neatly into either physical or biological categories.
Of the three most common parameter groups, physical parameters are the most consistent and extensively monitored, followed by biogeochemical, with biological/ecosystem parameters having the least global coverage.
The 40-year failure of the annual upwelling in the Gulf of Panama highlights the importance of monitoring to detect long-term or seasonal changes. Every year, Panama’s Pacific coast depends on powerful seasonal winds that drive cold, nutrient-rich waters to the surface. This process is important for sustaining fisheries and protecting coral reefs. In 2025, for the first time in at least four decades, the expected seasonal drop in temperature and surge in productivity did not occur. The ocean eventually cooled, six weeks later than usual, and lasted only 12 days instead of the normal two months. Scientists suspect that a significant reduction in wind patterns, linked to broader climate disruptions, was the cause of this unprecedented event.
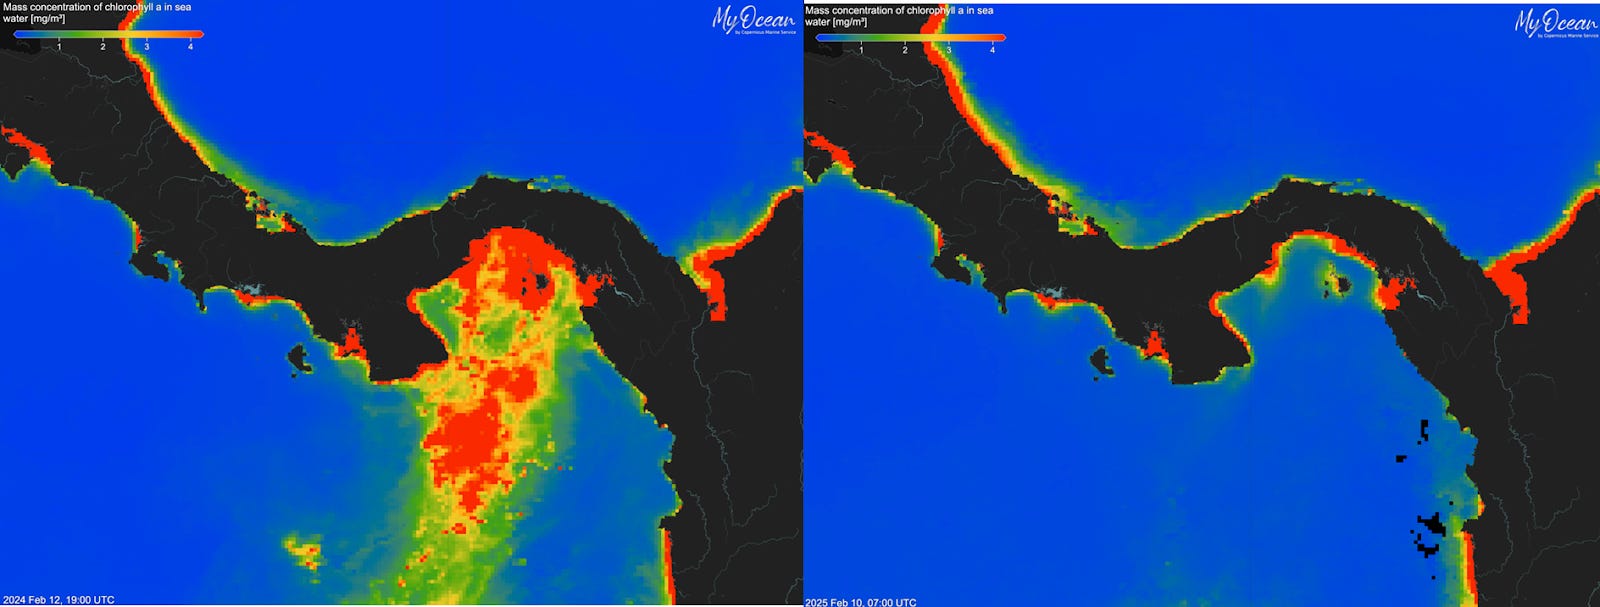
Image courtesy of Aaron O’Dea.
Without the expected annual upwelling of cold, nutrient-rich water, phytoplankton blooms that feed the marine food web were suppressed, and fisheries productivity declined. Coral reefs also lost their yearly thermal buffer, leaving them exposed to heat stress. This event was documented because the monitoring infrastructure was in place. In less-watched regions, a failure of the same magnitude could pass entirely unrecorded. This is why biological monitoring matters so much.
The deep sea is defined by the Intergovernmental Panel on Climate Change (IPCC) as the region below a depth of 656 feet (200 m). It is the largest habitat on Earth by both volume and area, representing about 66% of the planet’s surface. As illustrated in the Deep Ocean Observing Strategy (DOOS) map, monitoring relies on a combination of platforms, including fixed sites/moorings, research cruises, satellites, and instruments on the seafloor. Autonomous systems like Argo and Deep Argo floats collect data as they move through the water, often reaching depths of 1.2 miles (2 km) or more. While these technologies have greatly improved our ability to observe the ocean, they are unevenly distributed, and large parts of the deep ocean are still barely monitored.
Using data gathered from approximately 44,000 deep-sea dives with observations conducted since 1958, across the waters of 120 different countries, the DOOS study is the most comprehensive global estimate of deep-sea benthic observations to date and highlights the disparity in global exploration efforts. In their analysis, they found that 65% of all visual seafloor observations in their dataset were within 200 nautical miles (230 miles / 370 km) of just three countries: the United States, Japan, and New Zealand. Additionally, they found that just five countries, the United States, Japan, New Zealand, France, and Germany, are responsible for 97% of all deep-sea submergence observations, due to the high cost of ocean exploration.
Nippon Foundation-GEBCO Seabed 2030 Project estimates that 27.3% of the global seafloor has been mapped. The total mapped area increased from roughly 6% in 2017 to 27.3% in 2025. The absence of detailed underwater topography, or bathymetric data, greatly hinders our ability to manage global marine resources and protect coastal communities. According to a 2025 article, it would take over 22 years for GEBCO’s full seafloor map to be complete, at the same rate of 3.2% per year since 2019. This would mean 100% mapping would not be complete until 2047, which is well beyond the targets of Seabed 2030.
According to researchers, the Indian Ocean remains the least mapped, with only 17.5% coverage (Niyazi et al.). Once again, a vast majority of the general gap in seafloor mapping is from the deep seafloor. The majority of the ocean, or 74.9%, lies between 2000 and 6000 m (2-6 km) below sea level, yet the majority of our observations are from depths shallower than 2000 m (2 km). While deep-sea dive activity has increased 4x since the 1960s, the proportion of dives occurring deeper than 2000 m has decreased from 58.4 to 25.9% (Bell et. al.). This biased view of depth zones for mapping has led to major data gaps, biased against deep seas, especially considering the relative area of the seafloor they occupy globally.
Bell, K. L. C., Johannes, K. N., Kennedy, B. R. C., & Poulton, S. E. (2025). How little we’ve seen: A visual coverage estimate of the deep seafloor. Science Advances, 11(19), eadp8602. https://doi.org/10.1126/sciadv.adp8602
National Oceanic and Atmospheric Administration, National Ocean Service. (2024, June 16). How much water is in the ocean? https://oceanservice.noaa.gov/facts/oceanwater.html
NOAA Ocean Exploration. (2026, January 27). How much of the ocean has been explored? https://oceanexplorer.noaa.gov/ocean-fact/explored/
Niyazi, Y., Thomas, E. A., Pucino, N., Swanborn, D. J. B., Stewart, H. A., & Jamieson, A. J. (2025). Status of global seafloor mapping effort and priority areas for future mapping. Frontiers in Marine Science, 12, Article 1543885. https://doi.org/10.3389/fmars.2025.1543885
O’Dea, A., Sellers, A. J., Pérez-Medina, C., Pardo Díaz, J., Guzmán Bloise, A., Pöhlker, C., Chiliński, M. T., Aardema, H. M., Cybulski, J. D., Heins, L., Paton, S. R., Slagter, H. A., Schiebel, R., & Haug, G. H. (2025). Unprecedented suppression of Panama’s Pacific upwelling in 2025. Proceedings of the National Academy of Sciences, 122(36), e2512056122. https://doi.org/10.1073/pnas.2512056122
Seabed 2030. (n.d.). Our mission. https://seabed2030.org/our-mission/
Sellers, A., & O’Dea, A. (2025, September 1).
Upwelling failure. Smithsonian Tropical Research Institute. https://stri.si.edu/story/upwelling-failure
Thanks for reading The AGS Globe! This post is public, so feel free to share it.
Did you enjoy reading this? Support the American Geographical Society today with a donation of $50 to help us support Geography education.

Members of the American Geographical Society enjoy reduced-price access to AGS events and free access to the online version of Geographical Review.


Attention APHG Teachers - Join AGS in New York City this November as a Geography 2050 Teacher Fellow! In addition to regular symposium sessions, our fellows participate in 2 days of specialized workshops where they can connect with other educators, get access to new classroom tools, and learn about college and career pathways for their students. Applications will be open from April 6th to June 14th and can be found on the Geography Educator Initiative page of our website.
A new Focus on Geography photo essay titled “Beyond the Postcard: Counter-Mapping Australia’s Cultural and Environmental Terrain” has been published! The continent of Australia presents a striking cartography, from expansive coastlines to a vast arid interior. A sustained presence on location reveals not only Australia’s expansiveness and environmental diversity—from interior deserts to tropical rainforests—but also the social, environmental, and political questions inscribed within place. Read more here.
This year’s Geography 2050 website is up! Save the date for our annual fall symposium, Geography 2050: Africa Shaping Tomorrow, taking place this November 19-20, 2026, in New York City! By 2100, over one-third of the world’s population will live in Africa, already the world’s youngest and fastest-growing continent, with profound implications for the interconnected human and environmental facets of the transformative demographic and technological boom across Africa. You can view this year’s Geography2050 website here.
Comments
Nothing yet. Say the first thing.
Sign in to join the conversation.