
A 20% annual return sounds great.
But if you drew down 40% to get there, did you actually build something you can trade long-term? Or did you just get lucky with the order the losing trades showed up in?
This is the question most performance reporting is designed to hide. A return number on its own tells you nothing about whether a strategy or a portfolio, is something you can actually sit through in real time with real capital behind it.
In Part 1, I set the goal for the Darwinex Zero futures portfolio: survive any single strategy’s failure, keep portfolio max drawdown below 50% of the sum of individual strategy drawdowns and hit a MAR ratio worth defending. In Part 2, I covered the filter that decides what belongs in the portfolio: drawdown correlation, not instrument count.
This part is about the scoreboard. Once the portfolio is built, how do you actually know if it’s working?
Two strategies both return 20% a year. Strategy A does it with a 10% max drawdown. Strategy B does it with a 40% max drawdown.
On a return basis, they’re identical. On every basis that actually matters to a trader who has to hold the position through the bad stretch, they’re not remotely comparable.
Strategy B needs the market to move in its favour roughly four times harder, relative to the pain it puts you through, just to arrive at the same number. And the psychological cost isn’t linear either. A 40% drawdown doesn’t just hurt more than a 10% one, it changes your behaviour. It’s the point where manual overrides start to creep in and you likely will start to change parameters or remove strategies from the portfolio. A strategy that requires you to override it to survive isn’t really fully systematic anymore.
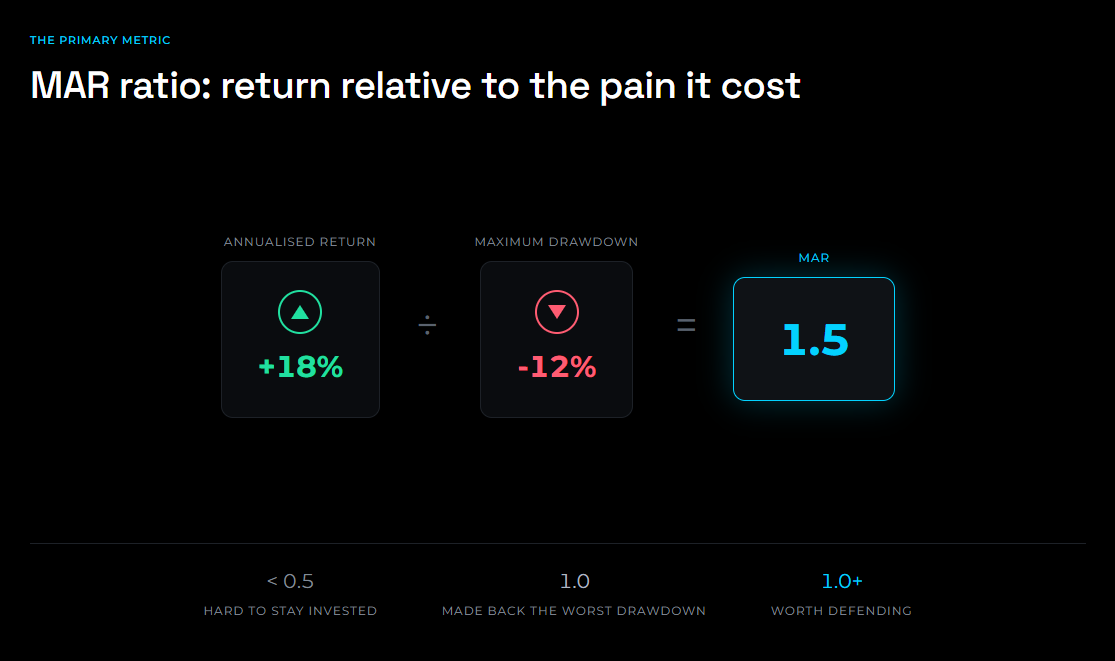
This is why my primary metric when measuring almost everything in this series is the MAR ratio: annualised return divided by maximum drawdown.
MAR doesn’t ask “how much did this make.”
It asks “how much did this make relative to the worst pain it put you through to get there.”
Return without a drawdown is a number without a cost basis.
A strategy or portfolio with a MAR of 1.0 made as much per year, on average, as its worst peak-to-trough decline. A MAR of 2.0 made twice that. In my experience, below roughly 0.5 you're entering a zone where many traders struggle to stay invested long enough to realise the expected return of the portfolio.
It’s not a perfect metric. It says nothing about the shape of the drawdown (a fast, sharp 30% decline and a grinding 18-month 30% decline score identically, but feel completely different to trade through) and it says nothing about how the return was distributed. That’s why it’s the primary ratio I use but not the only one.
MAR is the headline, but on its own it can hide things. A portfolio’s measurement needs a few more numbers to be complete.
MAR Ratio: Annualised return ÷ maximum drawdown. The primary metric. This is the number I look at first and the one that decides whether a strategy or portfolio configuration is even worth further analysis.
Maximum Drawdown: The largest peak-to-trough decline in the equity curve. This is the number that determines whether you can actually stay in the seat. Every other metric is somewhat abstract; max drawdown is the one you feel in real time and it’s the one that decides position sizing, not the other way around.
Expectancy: (Win rate × average win) − (loss rate × average loss), expressed per trade. Where MAR tells you whether the equity curve as a whole was worth the pain, expectancy tells you whether the underlying edge is real on a trade-by-trade basis, independent of how the trades happened to be sequenced.
MAR and max drawdown are both path-dependent: run the exact same set of trades in a different order and you get a different drawdown, a different MAR, sometimes a dramatically different one, even though nothing about the edge itself has changed. Expectancy doesn’t care about sequence. A strategy with positive expectancy has a genuine statistical edge per trade; a rough stretch of sequencing can still produce an ugly drawdown, but the edge underneath it hasn’t moved. That’s a very different diagnosis from a strategy whose expectancy has actually gone flat or negative, where the drawdown isn’t bad luck, it’s the edge disappearing.
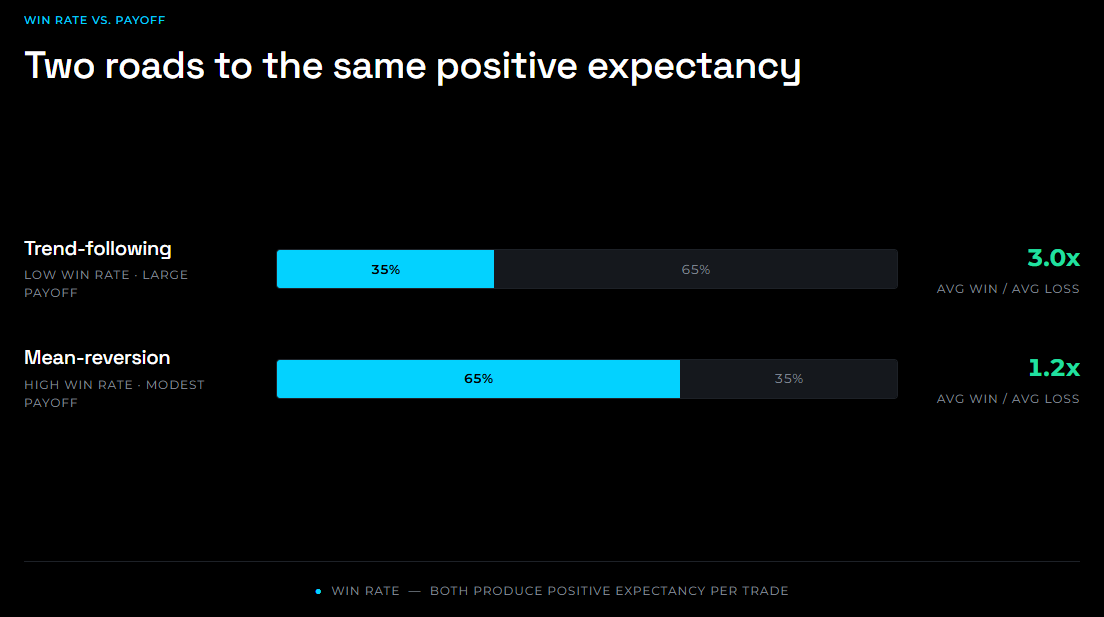
It also forces a useful separation between two things that get blended together when you only look at MAR: win rate and payoff. A strategy can have positive expectancy with a 35% win rate if its average win is large enough relative to its average loss, which describes most of the trend-following systems in my database or it can have positive expectancy with a 65% win rate and a modest payoff ratio, which describes most of the mean-reversion systems.
Neither is more “correct”, it’s just two different styles of trading. But if a strategy’s win rate starts drifting away from its historical range while the payoff ratio stays fixed, or vice versa, that’s often the first sign of edge decay and it usually shows up in the expectancy number well before it’s obvious in the equity curve.
At the portfolio level, I look at expectancy per strategy rather than expectancy for the portfolio as a whole. A blended figure across strategies with different trade frequencies and holding periods gets muddy fast. What’s actually useful is confirming that every strategy still contributing capital has an expectancy consistent with its own backtest, not that the portfolio’s average expectancy looks fine because two strong strategies are masking one that’s quietly stopped working.
Maximum/Average Drawdown Length: How long, in absolute time, has the equity curve spent below its previous peak? Two strategies with identical max drawdown can have completely different time-under-water profiles and the one that recovers faster is the one you can actually run with more confidence.
Together, these metrics answer the only question that matters: is the pain worth the outcome and has that relationship held up over time?
The performance between a portfolio and an individual strategy can look very different and they should do.
At the individual strategy level, a MAR of 0.2-0.8 with a clean, explainable edge is a perfectly reasonable building block. You’re not expecting any single strategy in the database to carry the whole portfolio. You’re expecting it to do one job well: behave differently from the others during a drawdown.
At the portfolio level, the bar should be meaningfully higher than the best individual strategy inside it, not just the average. If diversification is doing what it’s supposed to do, combining several 0.2-0.8 MAR strategies with genuinely low drawdown correlation should produce a portfolio MAR north of what any single one of them achieves alone. The drawdowns don’t fully overlap, so the denominator shrinks faster than the numerator does.
If that doesn’t happen, if the portfolio MAR is roughly equal to, or worse than the best strategy in it, it usually means one of two things: either the correlation work from Part 2 was wrong and the strategies are more coupled than the matrix suggested or the position sizing across strategies is off, with too much capital concentrated in the more volatile pieces. Either way, it’s a sign to go back to the correlation matrix before adding anything else.
This is worth sitting with, because it’s counterintuitive to a lot of traders coming from single-strategy trading: the portfolio isn’t supposed to be a diluted average of its parts. It’s supposed to outperform its best part on a risk-adjusted basis. That’s the entire justification for building one instead of just trading your single best strategy at larger size.
A portfolio built once and left untouched won't hold up as a long-term portfolio. The construction process from Parts 1 and 2 isn’t a one-time gate, it’s a recurring process.
Three things move over time and each has a different trigger:
Adding strategies: New candidates from the database get run through the same correlation filter from Part 2, checked against the current surviving set, not against some original list. A strategy that looked redundant six months ago might now fill a genuine gap if the portfolio’s composition has shifted.
Removing underperformers: This is the harder one, because it requires separating “this strategy is in a normal drawdown for its own history” from “this strategy’s edge has actually degraded.” The test I use: is the current drawdown still within the range the backtest already showed and is the strategy still losing money the same way it always has (same regime, same trade types), or has the character of the losses changed? A changed loss profile is the actual removal signal, not depth or duration of drawdown on its own.
The last thing you want to end up with is a losing strategy staying in your portfolio consistently losing money without you taking any action against it.
Rebalancing position sizing: Because every strategy sizes its own trades dynamically off current ATR, no single position ever grows oversized just because a strategy has been on a good run, that part is handled automatically, trade by trade. What actually needs periodic review is the capital allocated to each strategy at the portfolio level: the percentage of total portfolio risk each strategy is assigned to trade with. That allocation is set when a strategy enters the portfolio based on its historical volatility and drawdown profile and it can go stale. A strategy whose realised volatility has shifted from its backtest or one that's proven more (or less) resilient than expected during a live drawdown, is quietly carrying a risk weight that no longer matches what it's earned. Reviewing and adjusting those allocation percentages periodically is less exciting than adding or cutting strategies, but it's doing more of the actual risk-control work than either.
The goal across all three isn’t to chase the highest possible MAR at every point in time. It’s to keep the portfolio’s structure, the thing that makes the MAR-above-any-single-strategy result possible in the first place, intact as conditions change.
Here’s the part of this that goes beyond personal trading and it’s the reason Darwinex Zero was the structure I picked over a standard prop firm model, as I covered in Part 1.
A backtest is a claim. A live P&L screenshot or tracker is a slightly more credible claim, but still one you’re taking on trust: which trades, what slippage, what sizing, since when. Neither is independently verifiable by someone who isn’t you.
A DARWIN is structurally different. Every trade is timestamped, executed on real infrastructure and reported through Darwinex’s platform rather than curated by the person who made the trades.
It’s also why the metrics in this article aren’t abstract theory for me. MAR, max drawdown and expectancy aren’t just numbers I report after the fact, they’re the numbers that determine whether the DARWIN itself becomes viable as an investable instrument. Darwinex’s own scoring of a DARWIN weights consistency and drawdown control, not raw return, which is the exact same priority ordering this whole series has argued for from Part 1 onward. The incentive structure and the trading philosophy point the same direction, which is rare.
That’s the long-term bet underneath this entire series: build something measurable enough and risk-controlled enough, that the track record itself becomes the asset, not just the returns it produced along the way.
A well-constructed portfolio should have better risk-adjusted performance than any single strategy inside it. If it doesn’t, something is wrong, either the correlation assumptions, the position sizing, or both and it’s worth stopping to find out which before adding anything else.
Return tells you what happened. MAR tells you whether it was worth it. A live track record tells you whether anyone else should believe it.
That’s the full arc of this series: build with correlation as the filter, measure with MAR, drawdown and expectancy and let the DARWIN prove the rest in public.
This closes out the framework side of the series, correlation as the filter, MAR and expectancy as the scoreboard. The portfolio itself starts going live on Darwinex Zero sometime this summer and from there this shifts from theory to tracking. I’ll be sharing performance updates as real trades accumulate. Looking forward to share both my existing strategies in MT5 format and the new Darwinex track record.
Note: Premium Annual is €399/year and includes the complete strategy database, upcoming MT5 Expert Advisor code for every strategy and access to the portfolio analysis tool once it’s released.
Get Premium Annual Access → €399
Disclaimer: I am not a financial advisor and I don’t recommend you trade my strategies. This article is for informational and educational purposes only. Trading involves risk and you can lose money. Always do your own research.
No posts
Comments
Nothing yet. Say the first thing.
Sign in to join the conversation.