
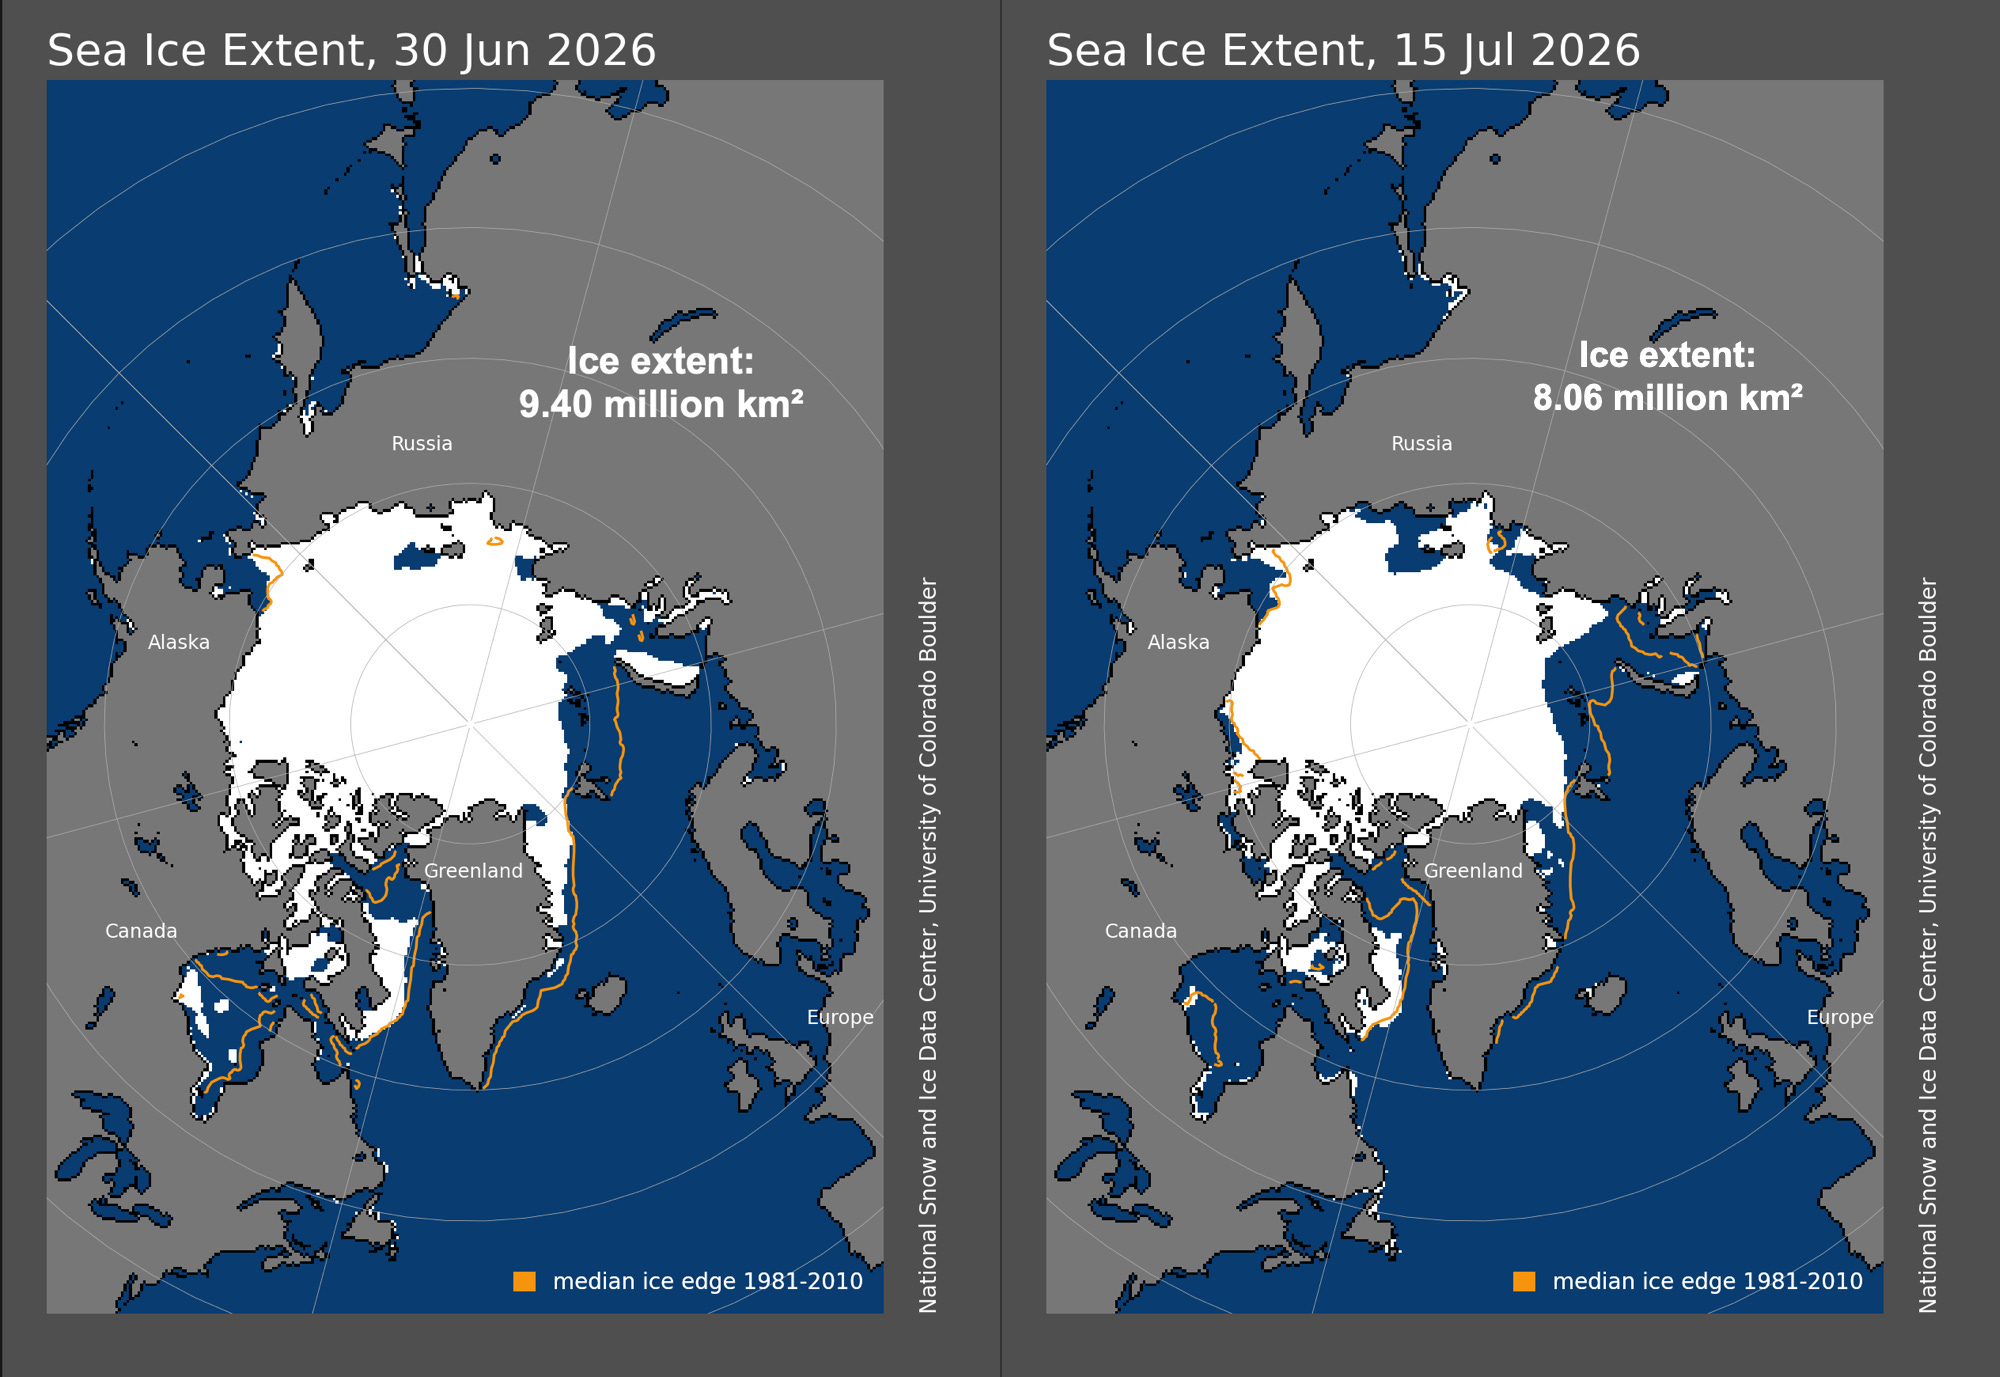
Arctic sea ice extent decreased about 14 percent between the end of June and July 15th (Fig. 1), which is close to the long term average decline during this period.
Sea ice distribution continues with what has become a familiar pattern over the past few summers, with low ice extent on the Atlantic side of the Arctic and higher extent on the Pacific side. The ice edge is well north of the 1981-2010 median in virtually the entire Atlantic sector of the Arctic, with open water northeast of Svalbard extending as far north as 84°N. There is also an unusually large area of open water east of the New Siberian Islands, in the western East Siberian Sea. In contrast, sea ice extent on the Pacific side of the North Pole, north of the Bering Strait, was above median, with only a modest increases in open water north of 70°N during the first half of July.
As of July 15th, Arctic-wide sea extent rankings (since 1979) were similar across the major analyses:
6th lowest EUMETSAT OSI SAF Sea Ice Index
7th lowest National Snow and Ice Data Center (NSIDC) Sea Ice Index
8th lowest Japanese Aerospace Exploration Agency (JAXA)
9th lowest U.S. National Ice Center/NSIDC Multisensor Analyzed Sea Ice Extent (MASIE)
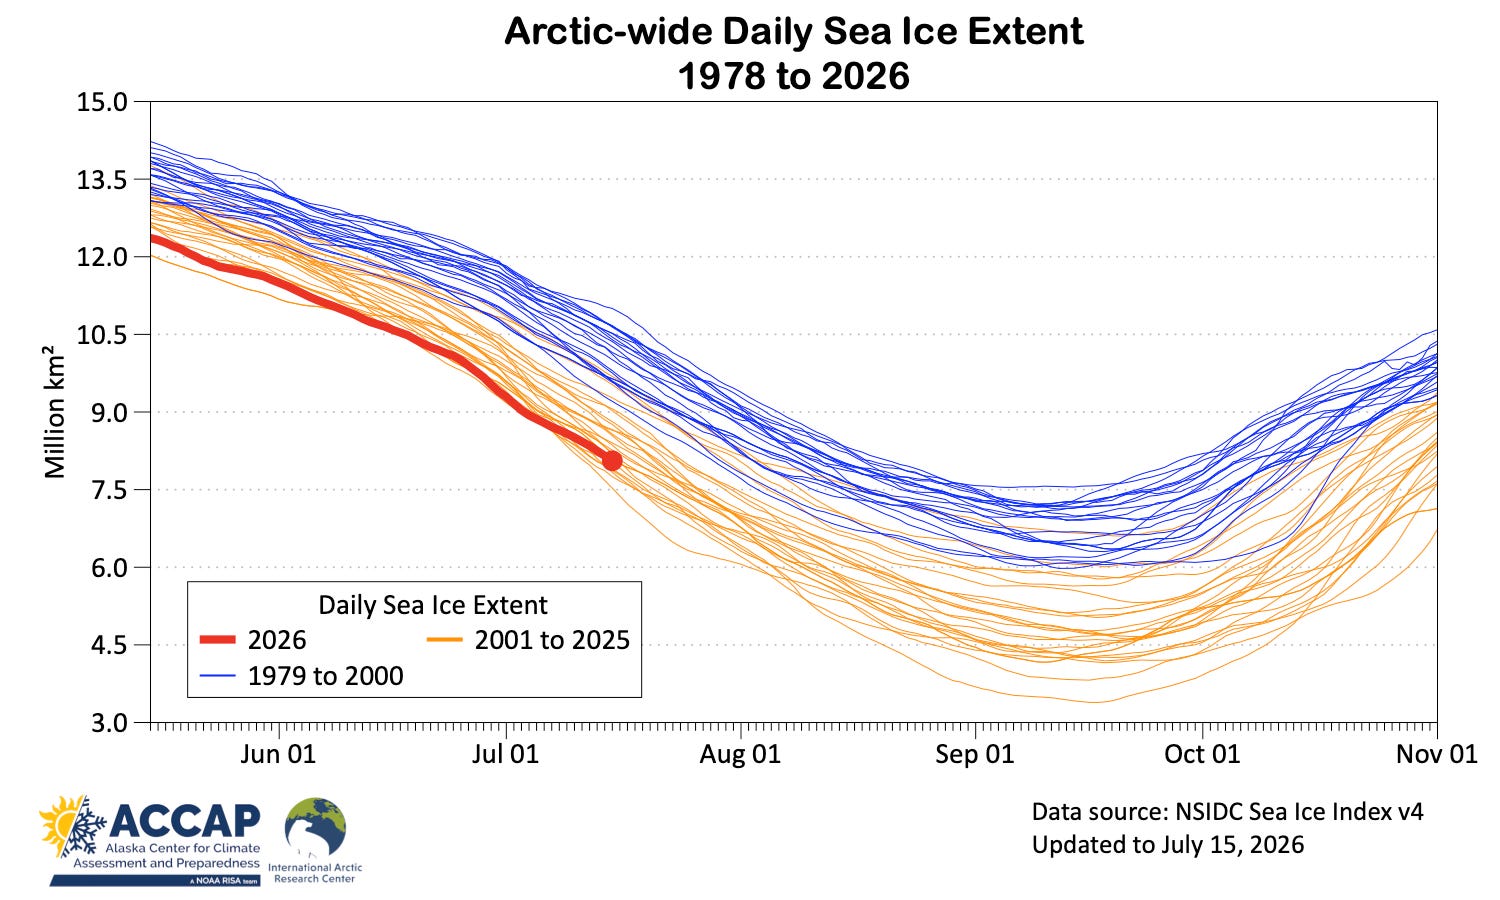
The daily sea ice extent from the NSIDC Sea Ice Index (Fig. 2) shows ice extent is well below the later 20th century cluster but not especially close to record low level for this point in the season (which for most of July occurred in 2020). As of July 15th, ice extent is slightly higher than the same date last year but nonetheless about 11 below the 1991-2020 median.
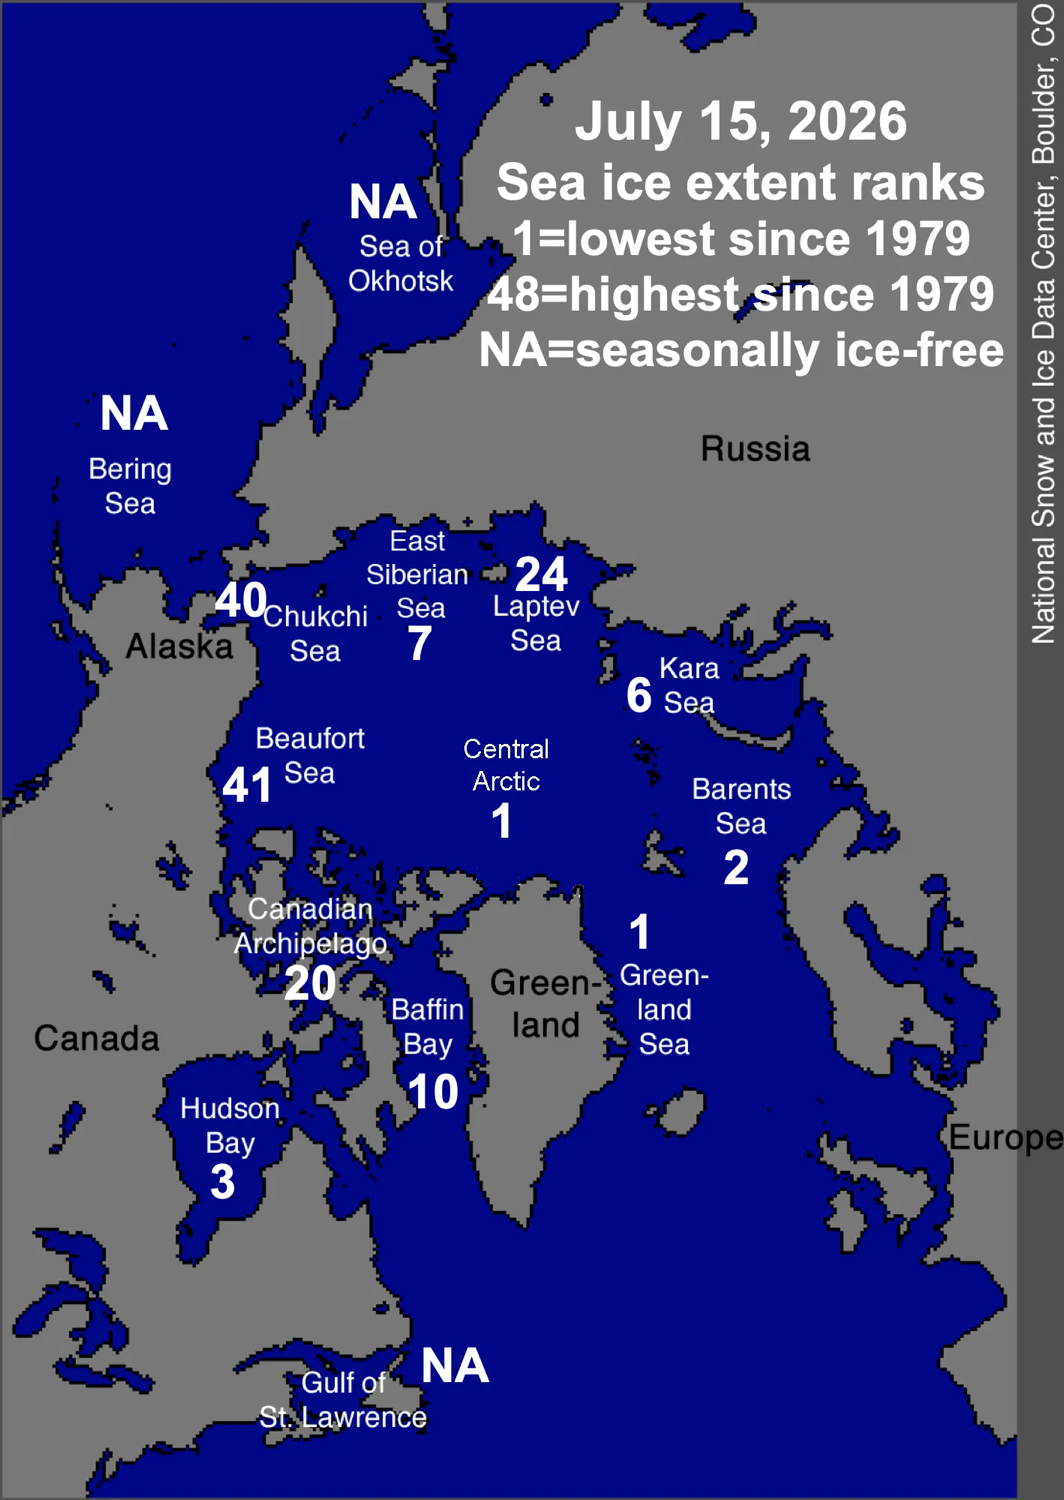
The stark dichotomy in sea ice extent between the Atlantic and Pacific sectors continues. Based on NSIDC data, sea ice is basically gone from Barents Sea and is the lowest in the satellite era (since 1979) in the Greenland Sea and in the Central Arctic basin. However, ice extent is very high for this point in the summer north of the Bering Strait. In the Chukchi Sea, ice extent is highest for July 15 since 1994 and the Beaufort Sea ice extent is tied with last year for the highest since extent since 2006.
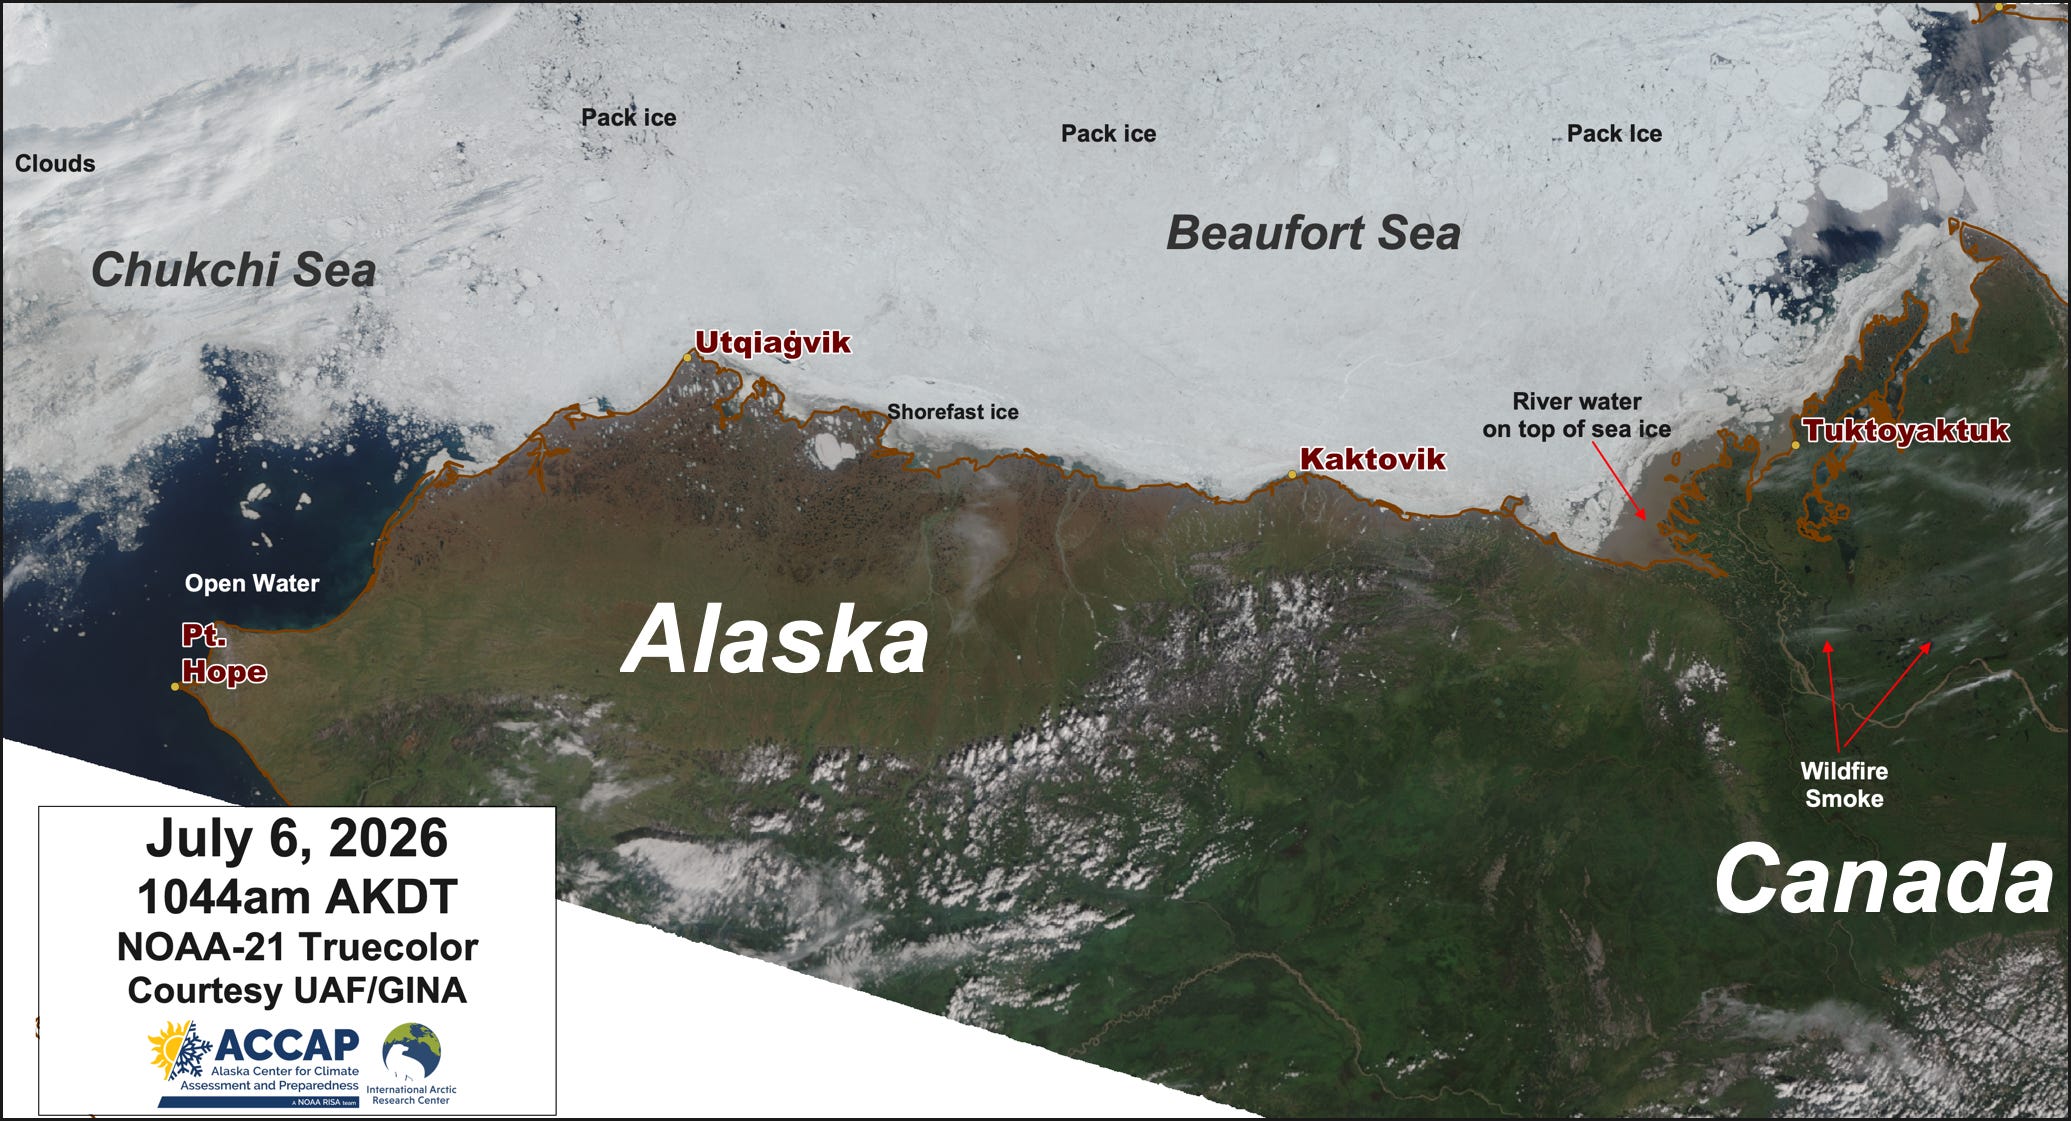
I posted about this separately, but it’s such a great image I’ll share it again: a rare summer cloud-free view of the southern Beaufort Sea presented itself on July 6 (Fig. 4), showing the solid pack ice right to the coast. See my post here for a fuller discussion.
Modeled sea ice thickness for July 15 this year and the same date last year (Fig. 6) from the Danish Meteorological Institute show broad similarities but also some important differences, especially in the southeast Beaufort Sea and near the North Pole (thicker ice) and in the western Laptev Sea (thinner ice).
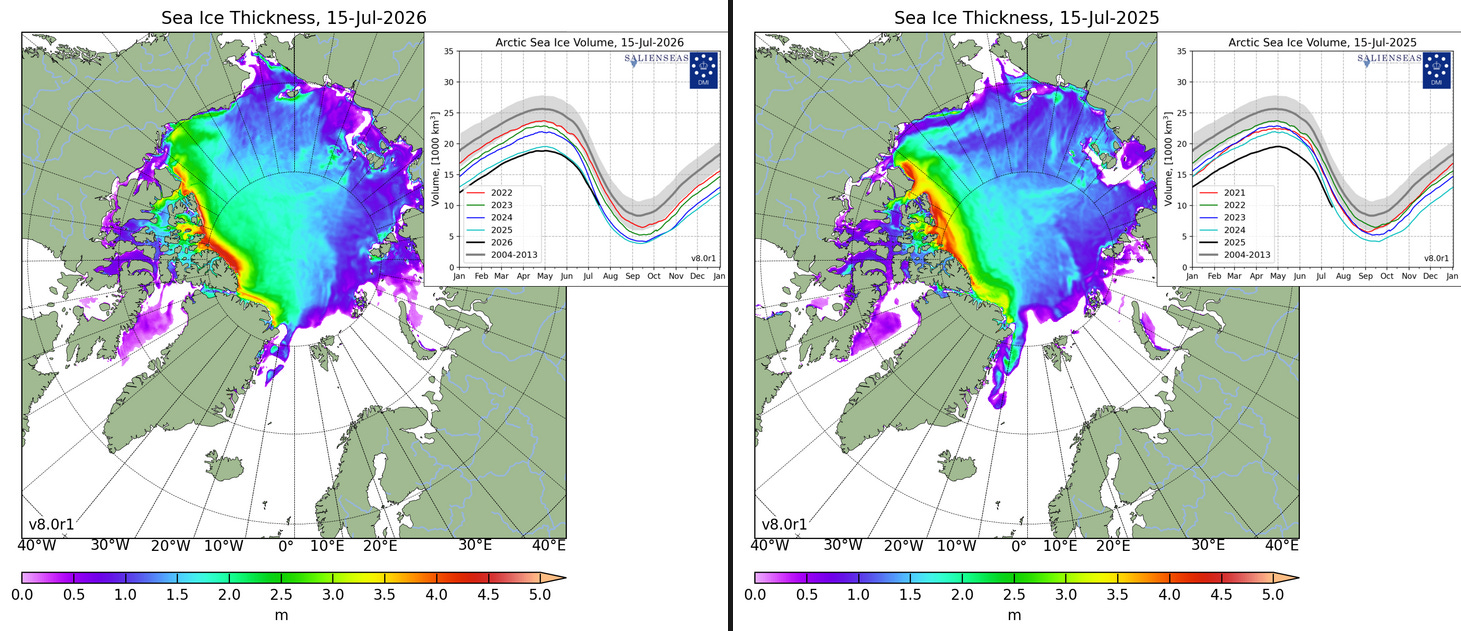
Modeled sea ice volume, after running at or very close to record low level for much of the first half of 2026 is now about the same as both mid-July 2024 and last year.
Technical details and underlying data sources
As usual in this newsletter, Arctic means “poleward of 60°N” unless otherwise specified except for sea ice, where “Arctic” means all northern hemisphere sea ice.
NSIDC Arctic Sea Ice information, graphics and data available here.
Products from the OSI SAF High Latitude Processing Center (including but not limited to sea ice) are available here.
Arctic-wide sea ice extent data is available from JAXA here.
MASIE information and data available from NSIDC here.
Landing page for Alaska and vicinity satellite imagery from Geographic Information Network of Alaska (GINA) is here.
Modeled sea ice thickness and volume from the Danish Meteorological Institute is available here.
No posts
Comments
Nothing yet. Say the first thing.
Sign in to join the conversation.