
This post covers temperatures and precipitation for the Arctic and Alaska for June 2026. The June sea ice and wildfire summary is here.
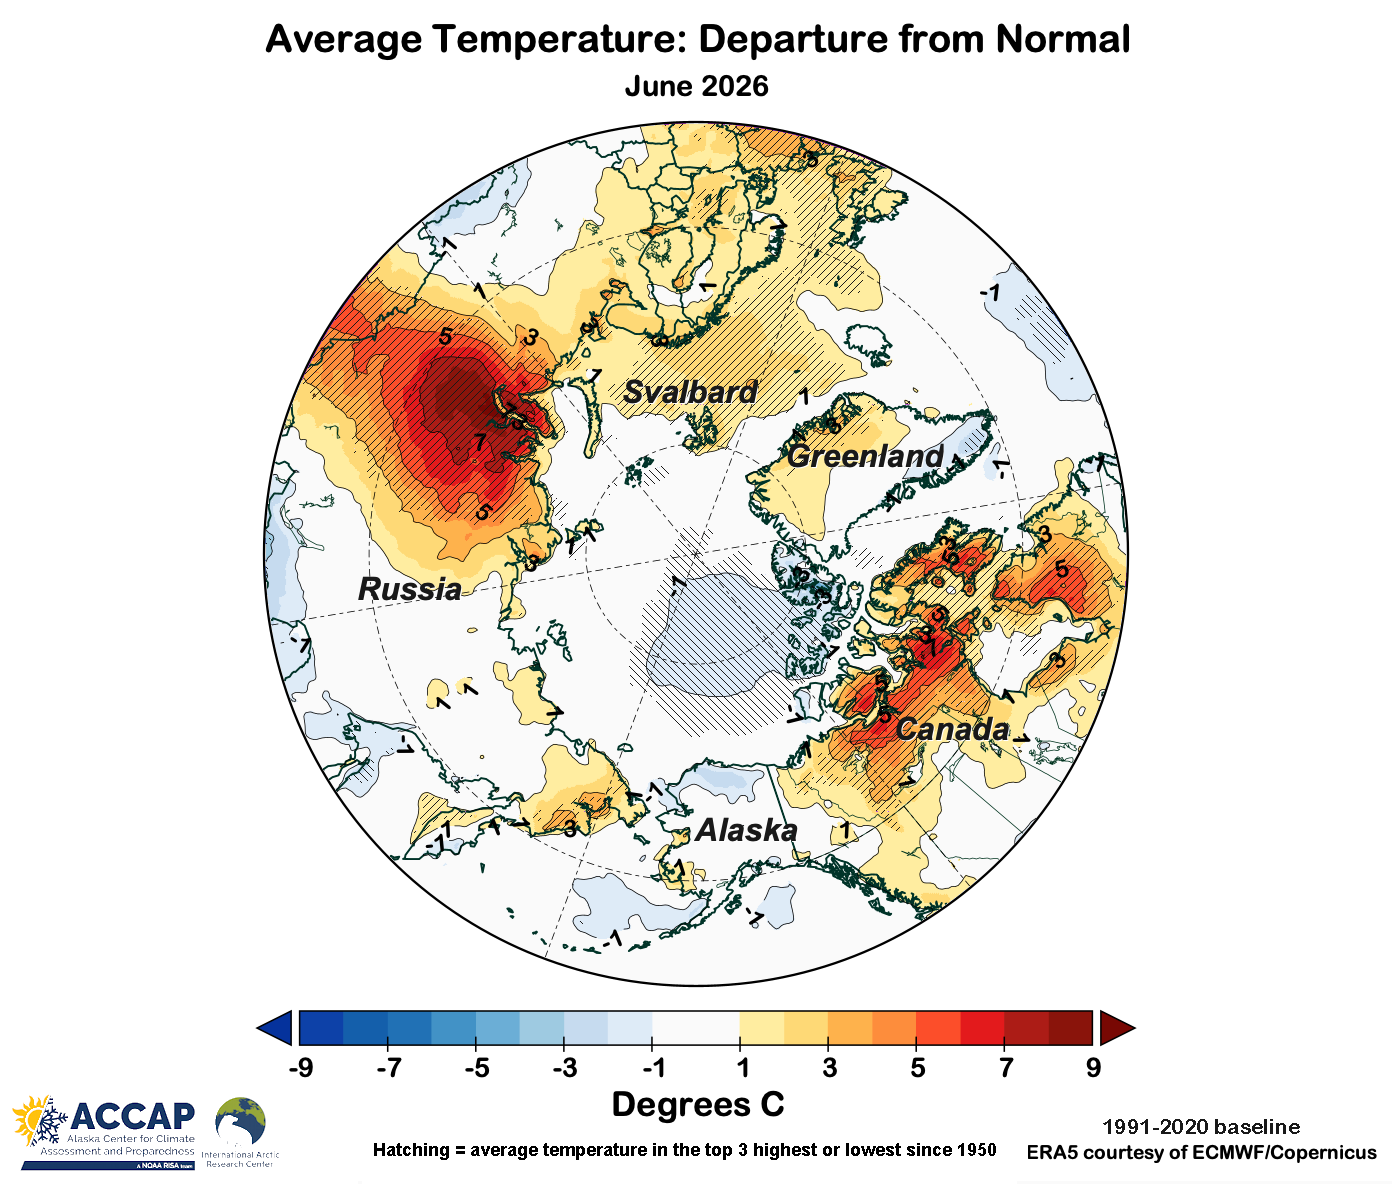
June was very mild over a large part of the Arctic. About 70 percent of the Arctic (land and seas poleward of 60°N) had a warmer than average June relative to the 1991-2020 baseline (Fig. 1). But almost 85 percent of Arctic land areas were milder than normal. About 12 percent of the Arctic had the warmest June since 1950 in ERA5 reanalysis, while only 1 percent had the coldest June in the past 77 years.
The warmth was most dramatic in western Siberia. For Yamalo-Nenets Autonomous Okrug this was by far the warmest June on record. For the third time in the past five years, Svalbard had the warmest June on record. Parts of the Northwest Territories and southern Nunavut, Canada also had the warmest June on record. Areas with below normal temperatures were more restricted. June was quite chilly north of about 75N over the Canadian Arctic Islands and westward into the Arctic basin east of the dateline as well as on Alaska’s North Slope.
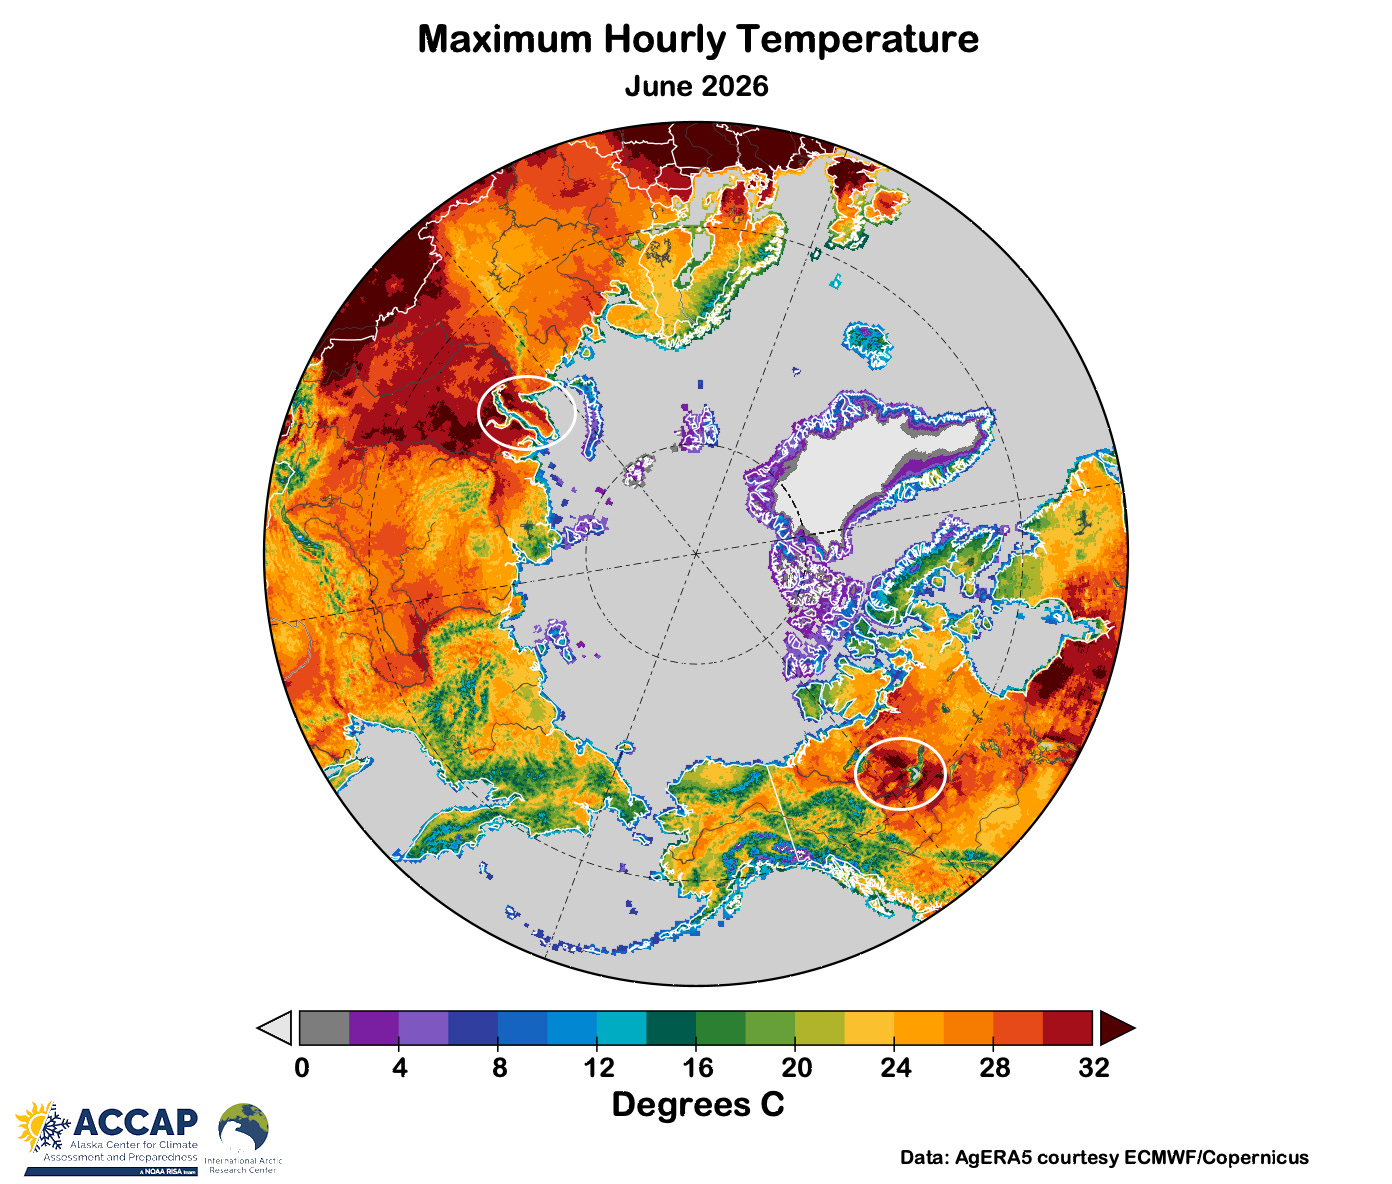
Of special note was the extreme warmth in northwest Siberia on June 25. Beliy Island (73.3°N), just offshore of the Yamal Peninsula, reached 28.3C (83F) and circled on Fig. 1b. According to M. Herrera on his “Extreme Temperatures Around the World” Bluesky account, this is (apparently) the highest temperature on record so far north anywhere in the world. This heat was concurrent with the late June western and central European heatwave but was entirely distinct, as Russia east of Ural Mountains was generally cooler than normal during this time. Parts of the Northwest Territories around Great Slave Lake also saw temperatures exceed 32C during the month, including 33.3C at Ft. Providence on the June 30th.
Since 1950, this was easily the warmest June on record for the Arctic overall (Fig. 2) and the mildest since 2020. Arctic lands also had the highest June average temperature.
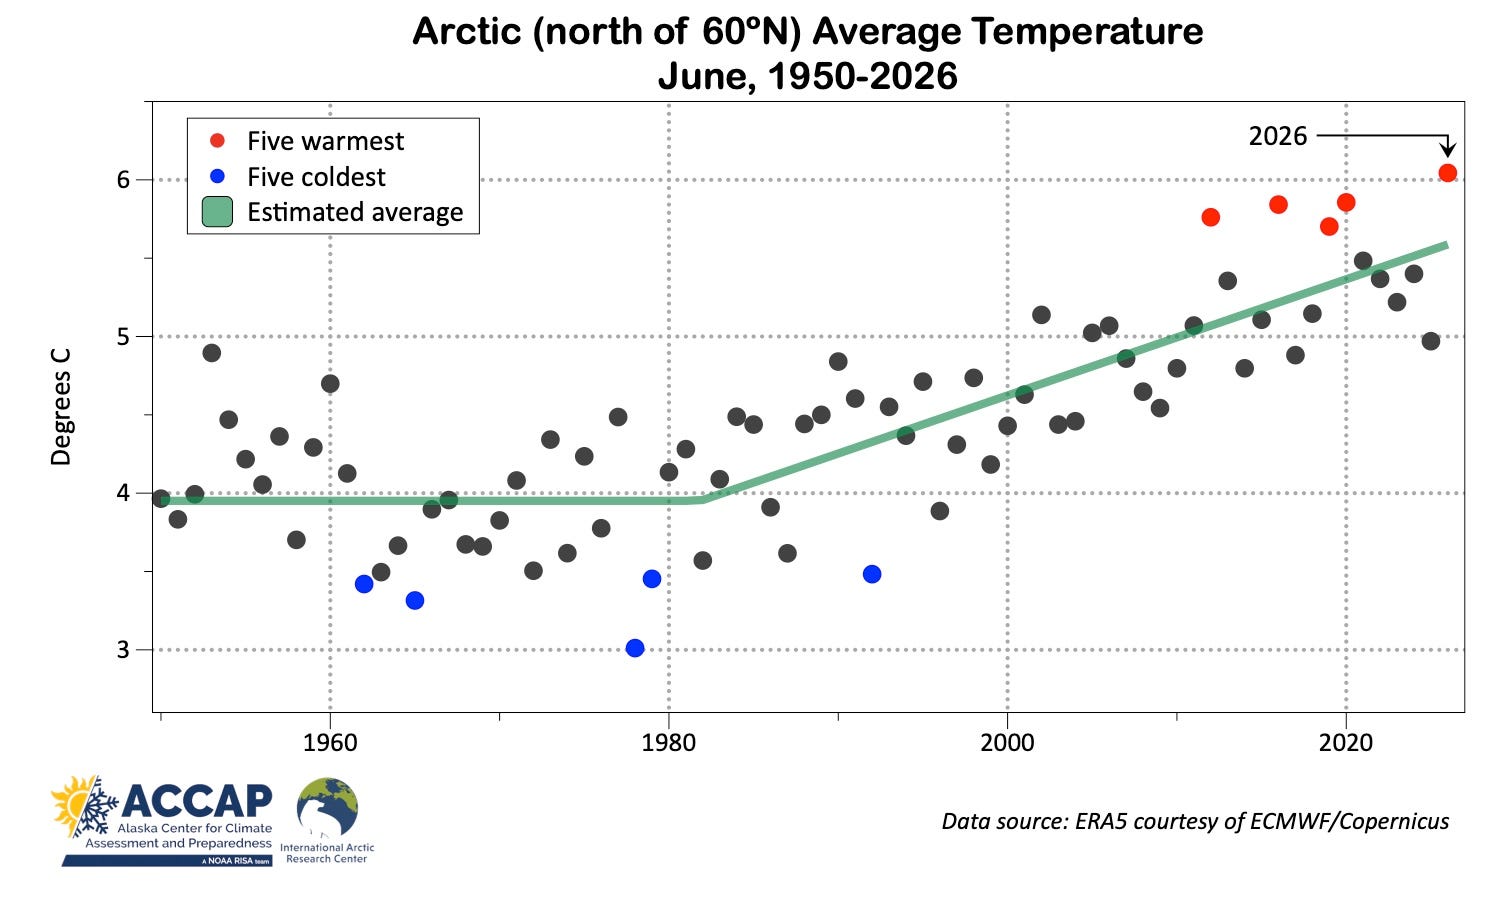
Because so much of the Arctic Ocean basin is still sea ice covered in June but low elevations land areas largely snow-free, the different in temperature trends in June is especially large: in the past 50 years, Arctic lands have warmed by an average of 2.8C while ocean areas poleward of 60°N have warmed by just 0.9C.
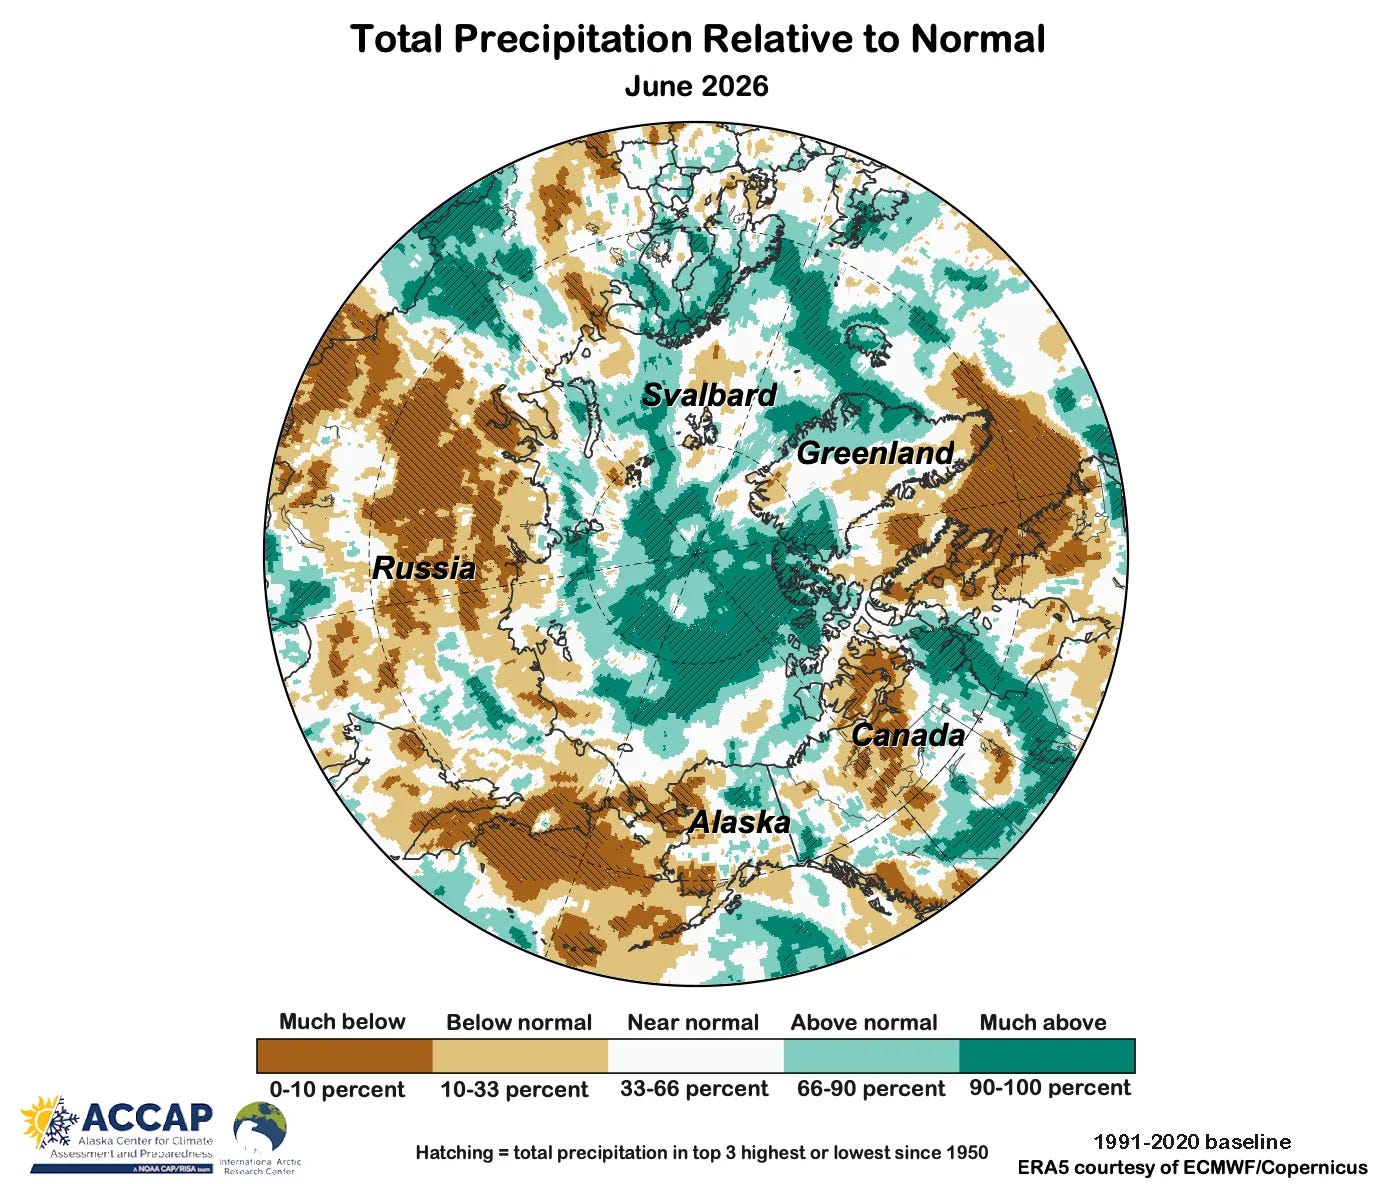
For the Arctic overall, precipitation was only about two percent below the 1991-2020 baseline average (Fig. 3). Over land areas though it was a different story. With much of the Asian Arctic and parts of the North America Arctic much drier than normal, the June average Arctic lands precipitation was the lowest since 1993, 13 percent below the 1991-2020 average. Wet areas included much of the Nordic Arctic, Iceland as well as parts of Greenland and northeast Alaska and northernmost Canada.
Most areas in Alaska were saw June temperatures average near to a little below normal (Figs 4a and 4b). The primary exceptions were in the Yukon-Kuskokwim delta, where this was the mildest June since 2022, and the North Slope, where this was the coolest June since 2018. Coastal Northwest Arctic Borough temperatures were well below normal but milder weather inland kept the region-wide average from being notably low.
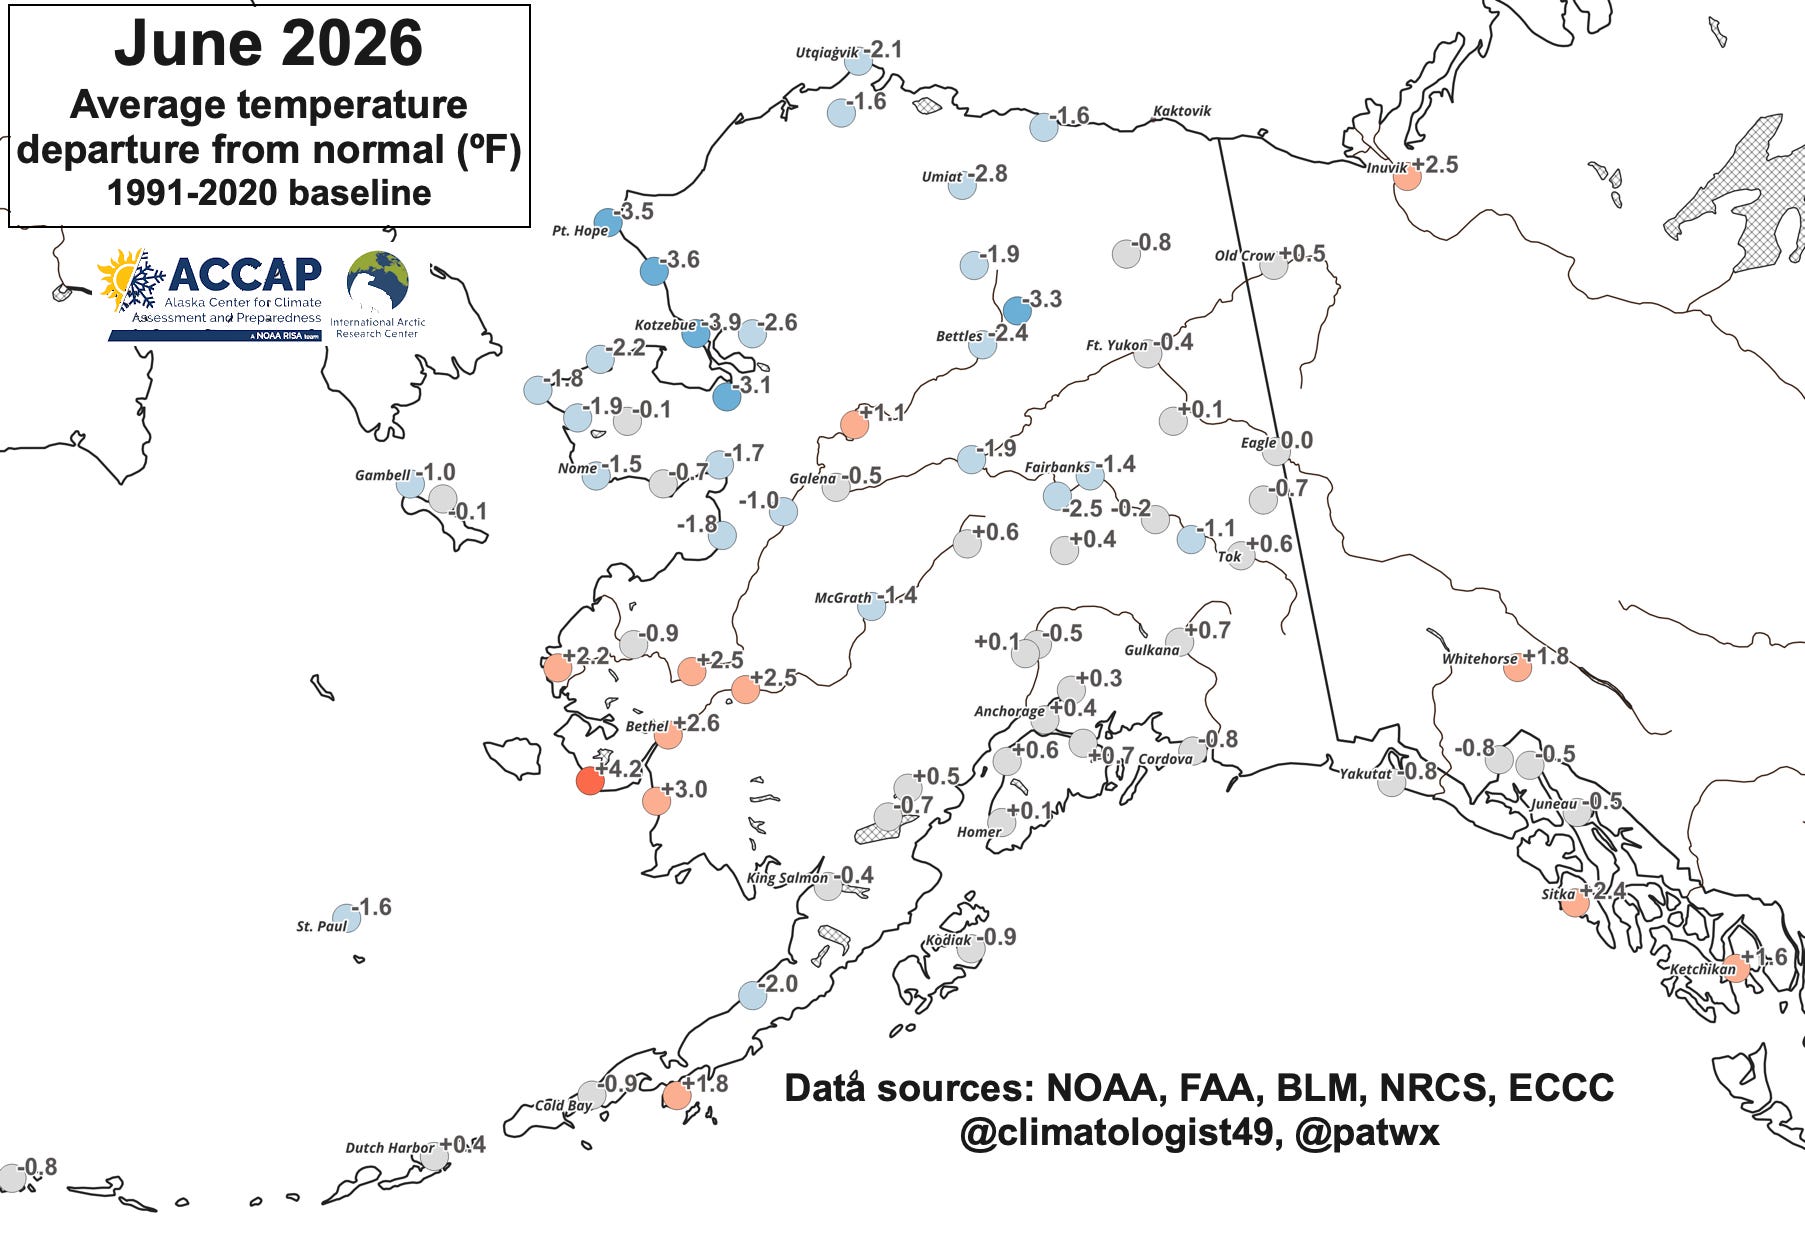
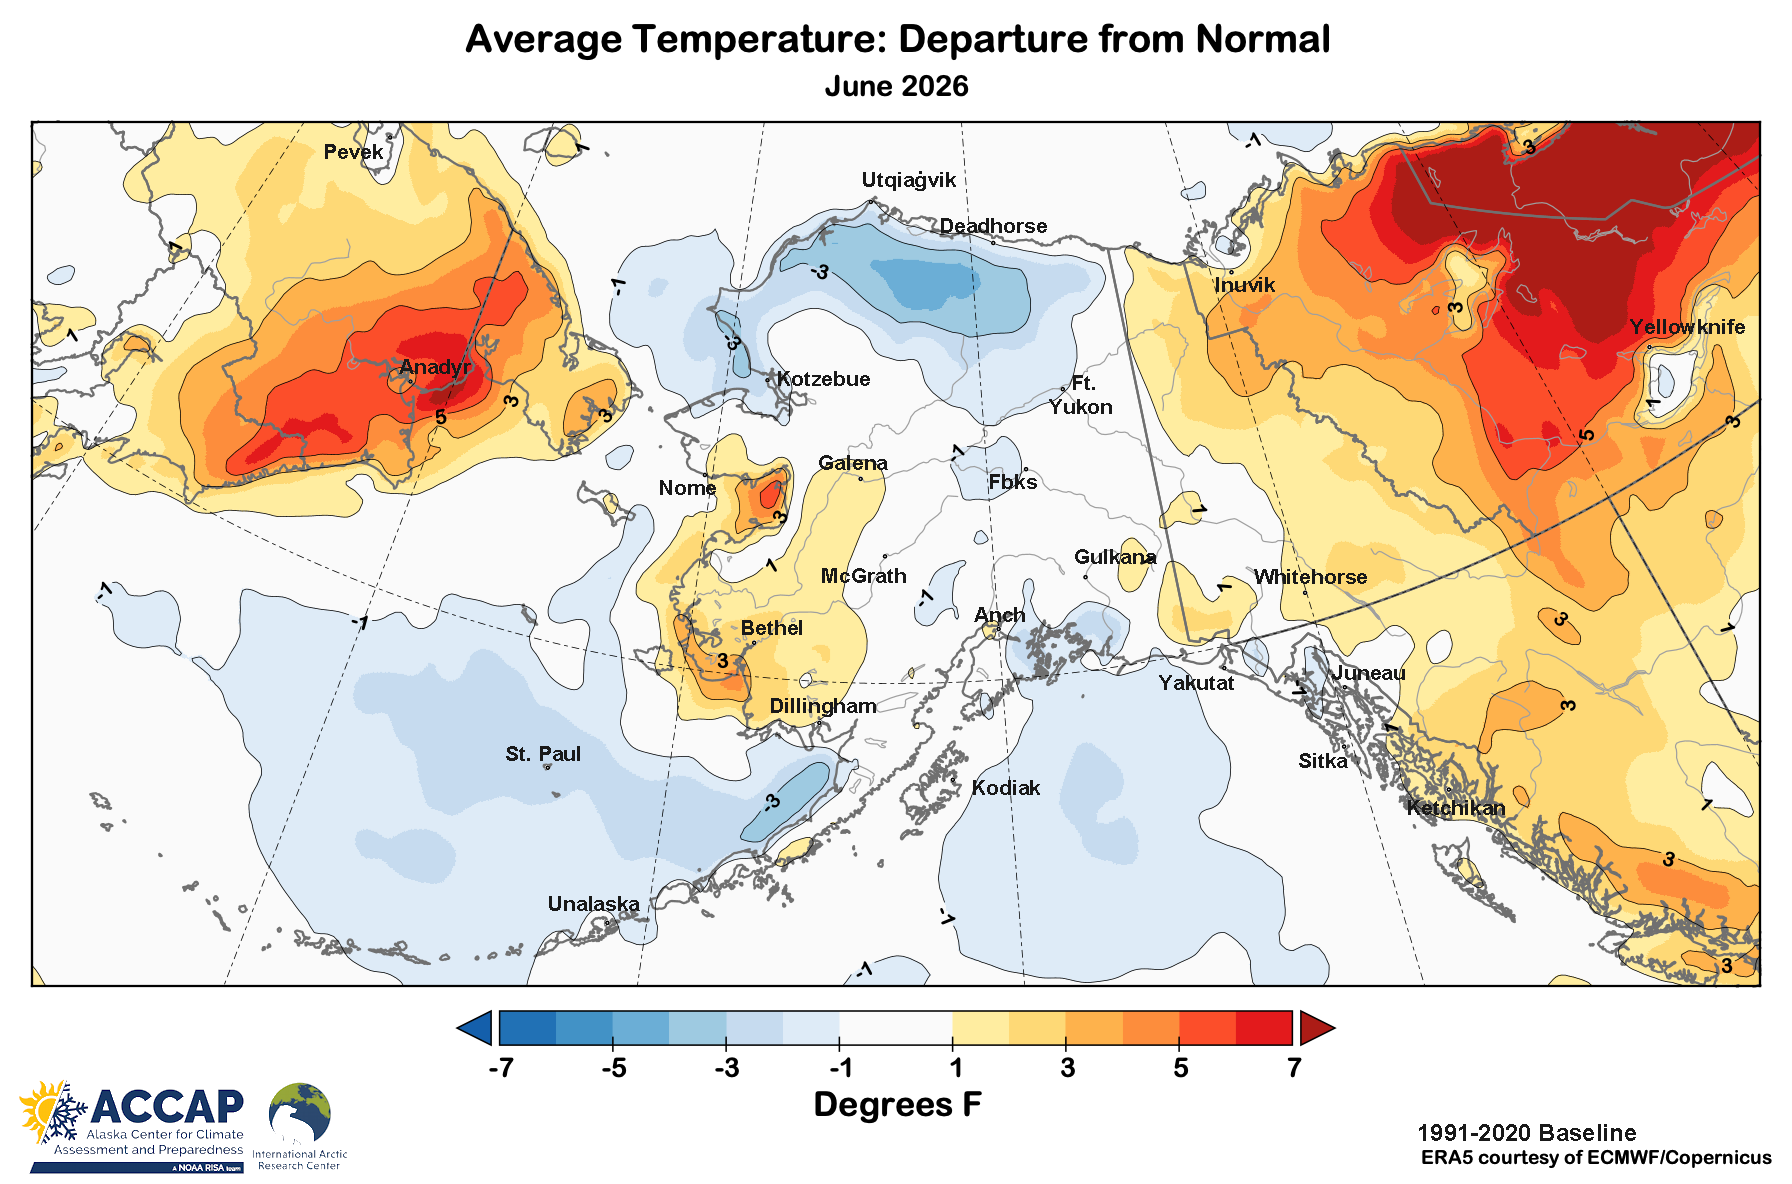
Except for a short-lived warm spell the first week of month, which set daily records in southern Alaska from Sitka to Bristol Bay, there wasn’t much in the way of notable heat. Reliable temperature reports in June ranged from 85F at Eagle on the 27th to 17F at Utqiaġvik on the 1st.
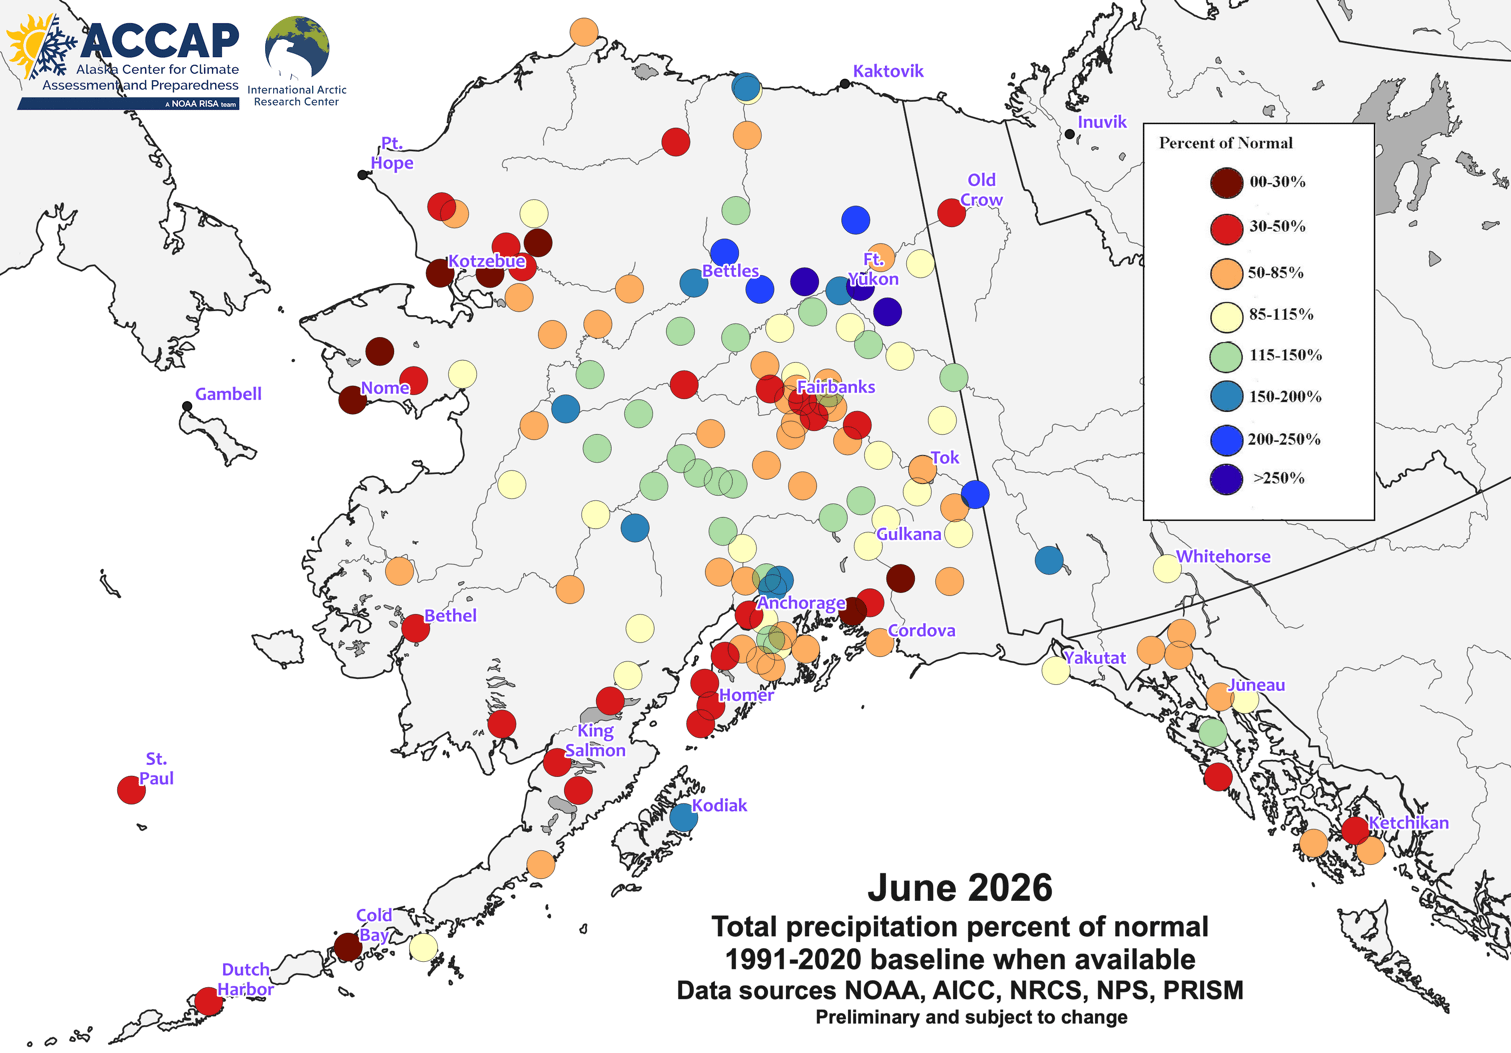
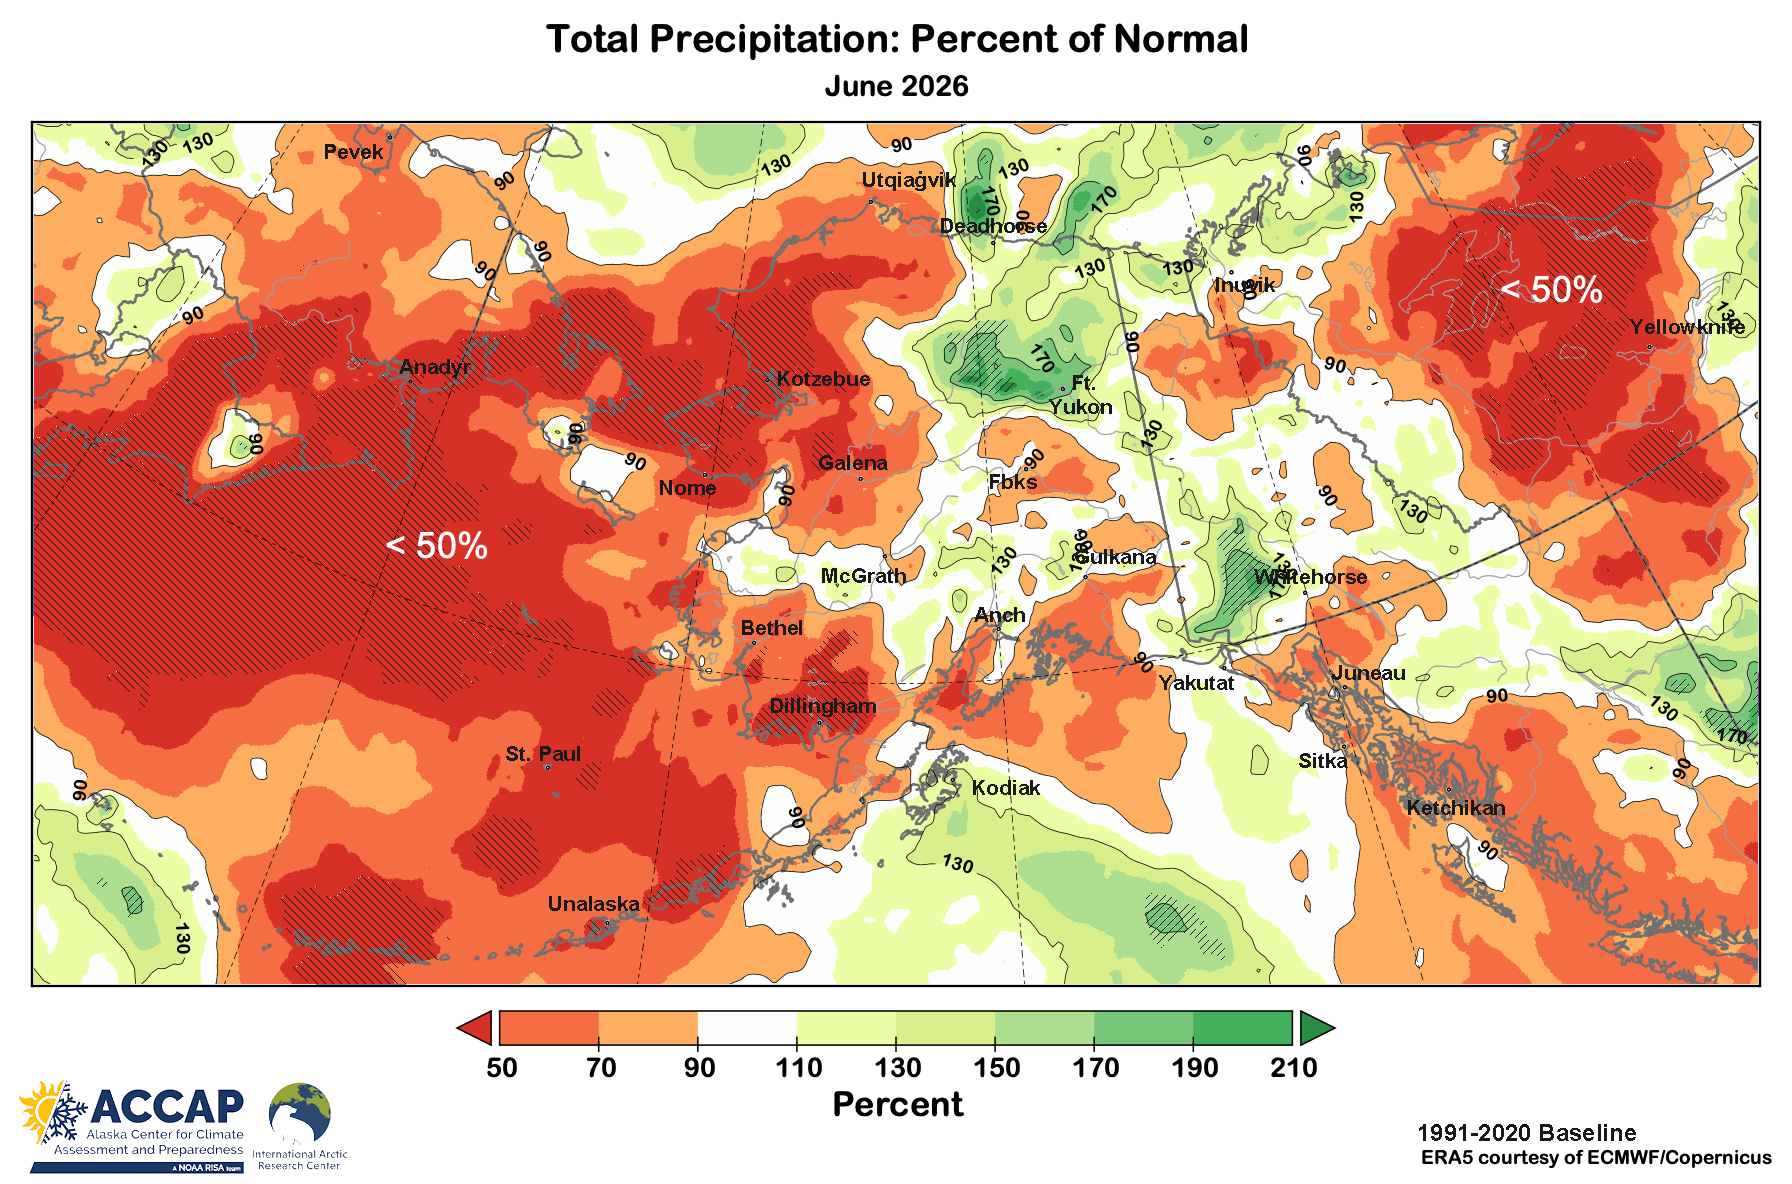
Precipitation, even relative to the long term average, which accounts for stable elevational and terrain effects, is often highly variable over short distances in early summer due to the prevalence of convective rainfall as the source of precipitation across much of mainland Alaska.
June 2026 followed that generalization (Figs. 5a and 5b). While western Alaska was generally drier than normal, and in some areas with less than half of normal, in the Interior and Southcentral departures from normal were all over the place, from much below to much above normal. Southeast was more generally drier than normal.
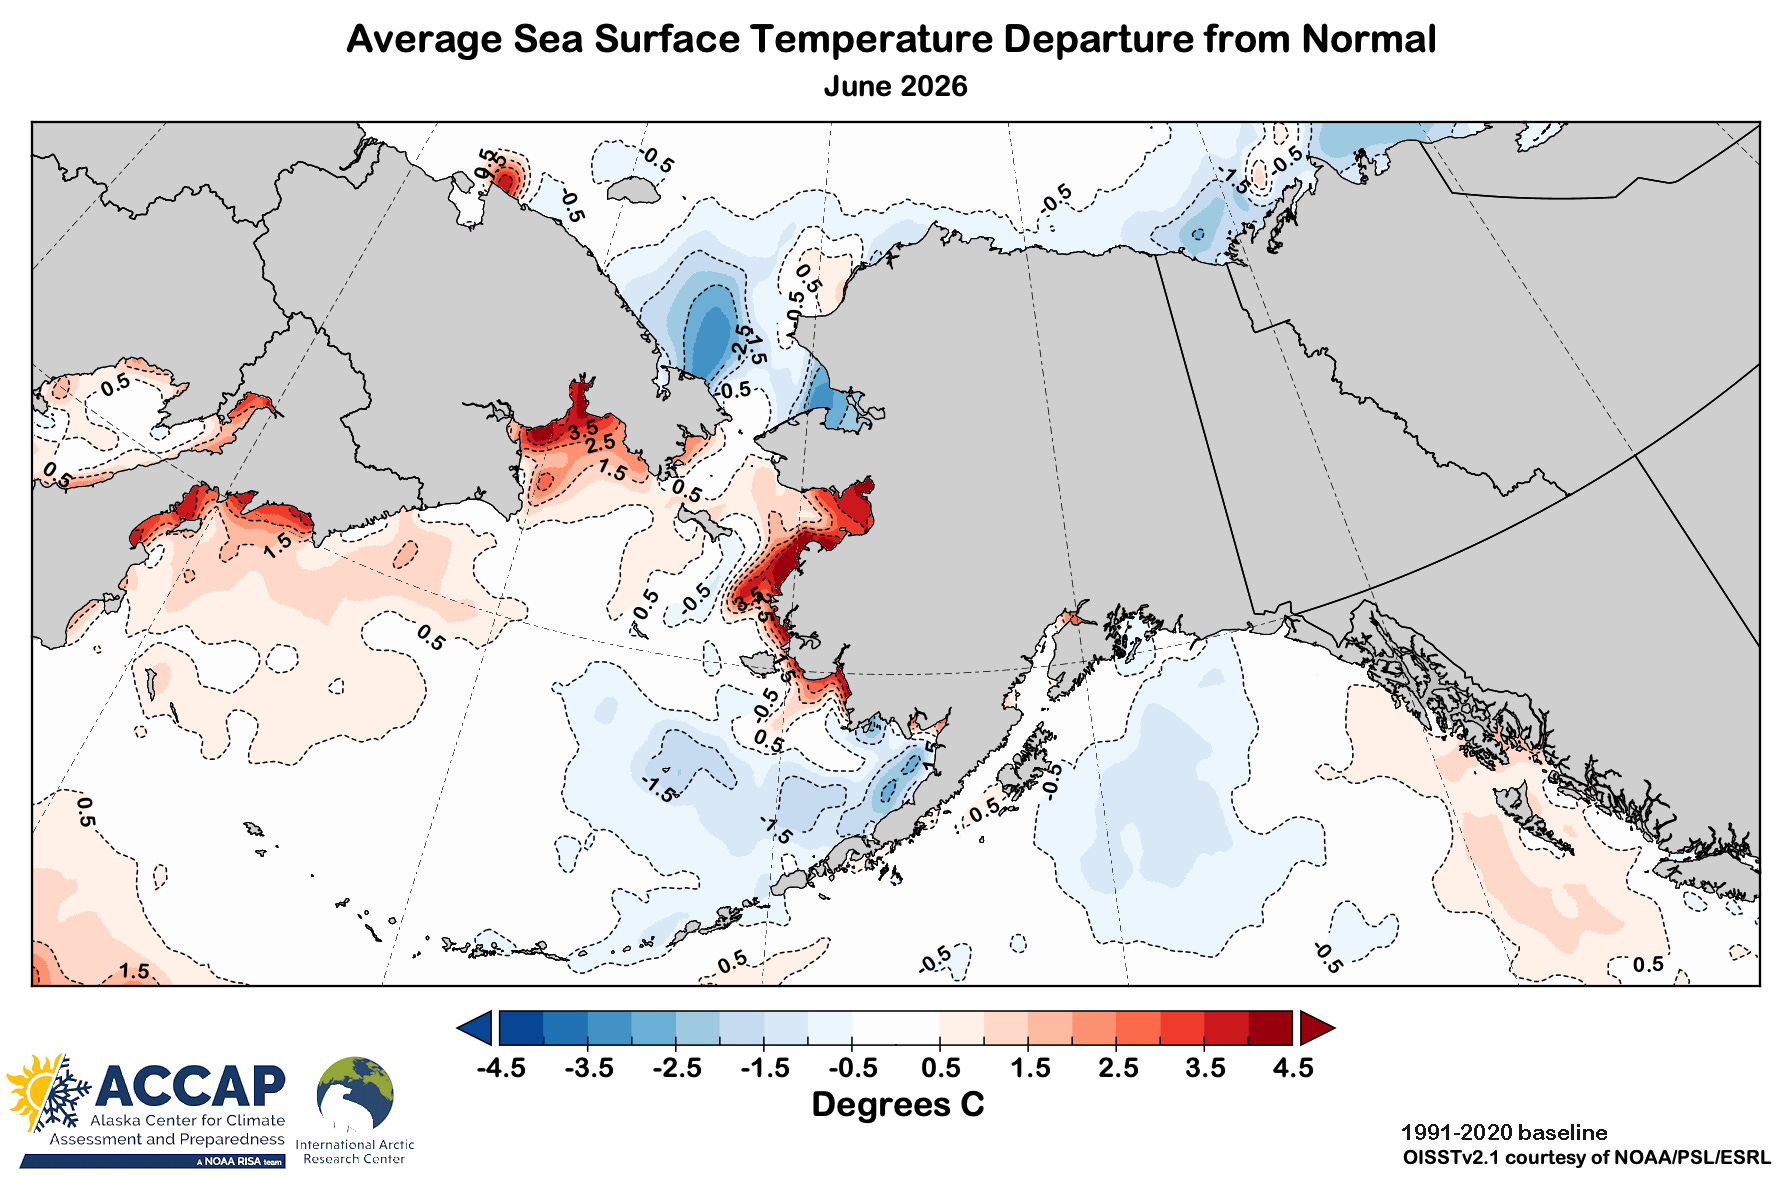
June average sea surface temperatures around Alaska were near to above normal in the northern and western Bering Sea but near to below normal in the southeastern Bering and western and central Gulf of Alaska (Fig. 6). Above normal sea surface temperatures in the eastern Gulf of Alaska extended as far north as northern Baranof Island.
Technical Details
As usual in this newsletter, Arctic means “poleward of 60°N” unless otherwise specified except for sea ice, where “Arctic” means all northern hemisphere sea ice.
ERA5 monthly temperature and precipitation data available through the Copernicus Climate Data Store, here.
AgERA5 landing page is here.
Code by B. Brettschneider/NWS Alaska Region allowing rapid ERA5 regional analysis is invaluable for my work.
Site-specific Alaska climate statistics and factoids from NOAA Regional Climate Center’s ACIS website here. Monthly temperature departures from normal use the published NOAA/NCEI 1991-2020 values wherever available. Where there are no published 1991-2020 normals, e.g. at most FAA airport stations for temperatures, normals were extracted from the 1981-2010 PRISM data (Oregon State University) and then estimated for 1991-2020 baseline period. All PRISM derived normals courtesy B. Brettschneider.
Precipitation data also from ACIS when available, as well as the NRCS SNOTel stations and the more than 100 Remote Automated Weather Stations maintained by Alaska Fire Service and National Park Service.
The NOAA Optimum Interpolation Sea Surface Temperature version 2.1 available in near-real time from the NOAA/Physical Sciences Laboratory, here.
No posts
Comments
Nothing yet. Say the first thing.
Sign in to join the conversation.