
In April I posted about Arctic summer climate during El Niño since 1970, here. This posts adds a bit more on temperatures and sea ice and a new analysis of summer precipitation during El Niño. See that post for some of the details on what summers El Niño was present and the strength of those events.
Temperatures
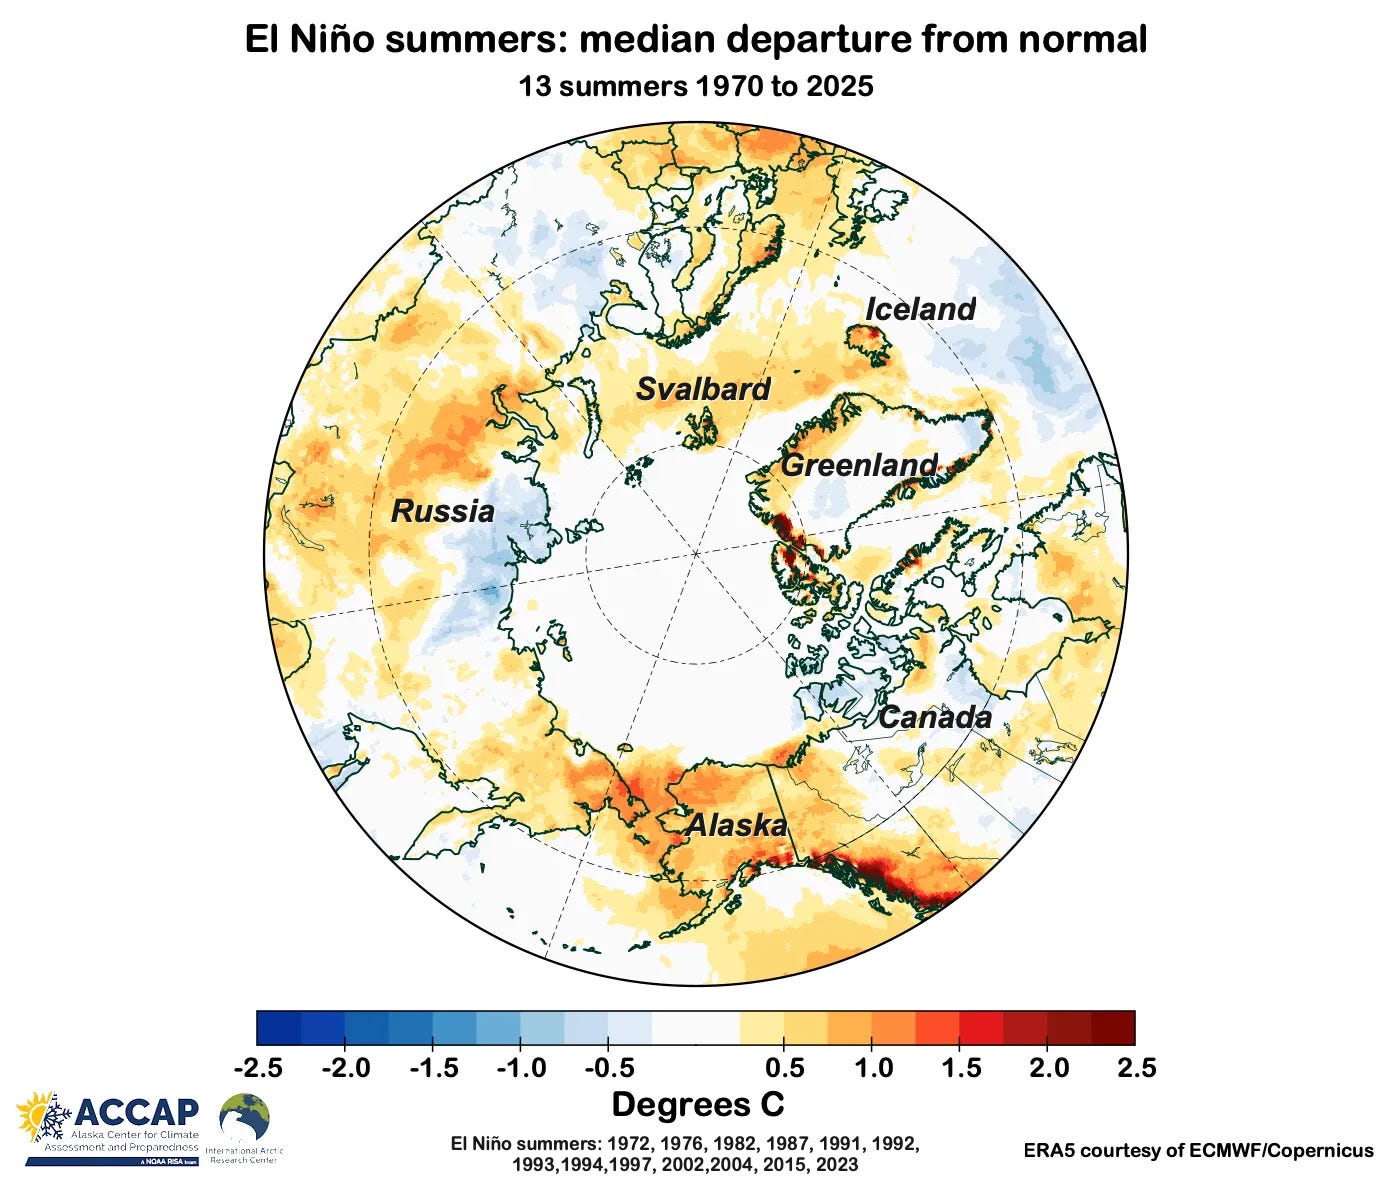
From my previous post on Arctic summers during El Niño (Fig.1), the general impression is the El Niño summers tend to be warmer than average over most land areas in the Arctic. However, in this framework we don’t a reference for typically variability, so it’s hard to know what’s significant and what’s not.
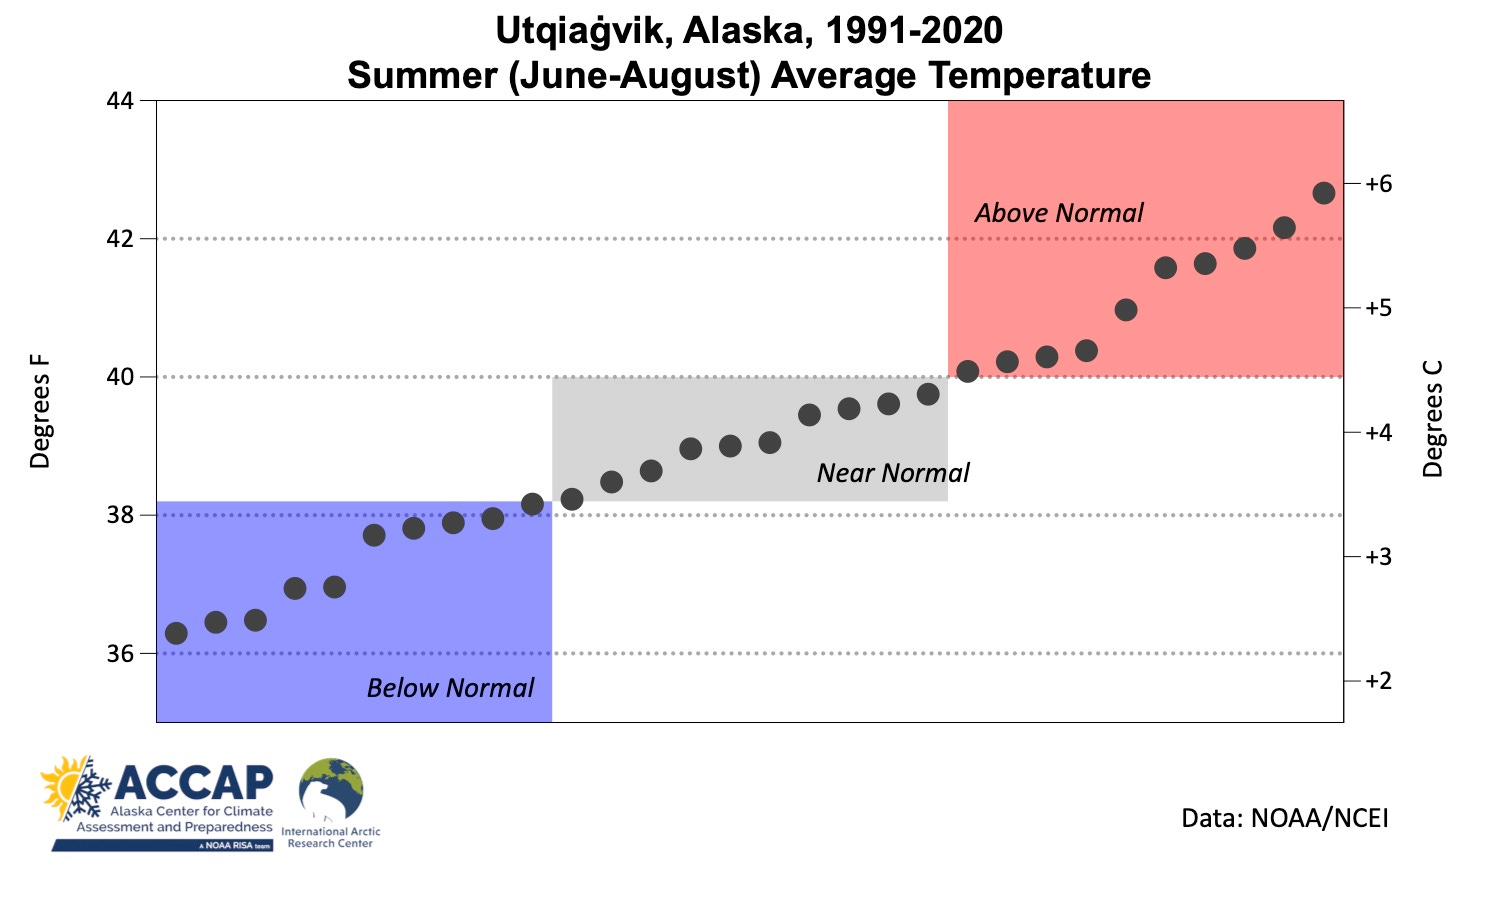
We can account for variability by using the common climate analysis technique of grouping observations relative to the variability within a given baseline period. To keep it simple, I’ve used three categories: significantly below “normal” (the lowest ⅓ of the observations), significantly above “normal” (the highest ⅓ of the observations) and near “normal”, which are the middle ⅓ of the observations. These categories are entirely defined by the distribution of observations during the baseline period, in this case the canonical 30-year periods, e.g. 1941-70, 1951-80, etc. To illustrate this, here’s an example using observations from Utqiaġvik, Alaska (Fig. 2) that puts all the components together. For the 1991-2020 baseline period, we rank order the observations and then split them into three classes with ten observations in each class. For gridded data, the software performs the same kind of ranking and splitting at every grid point, which is a large undertaking: in ERA5 there are about separate 175,000 grid points in the Arctic.
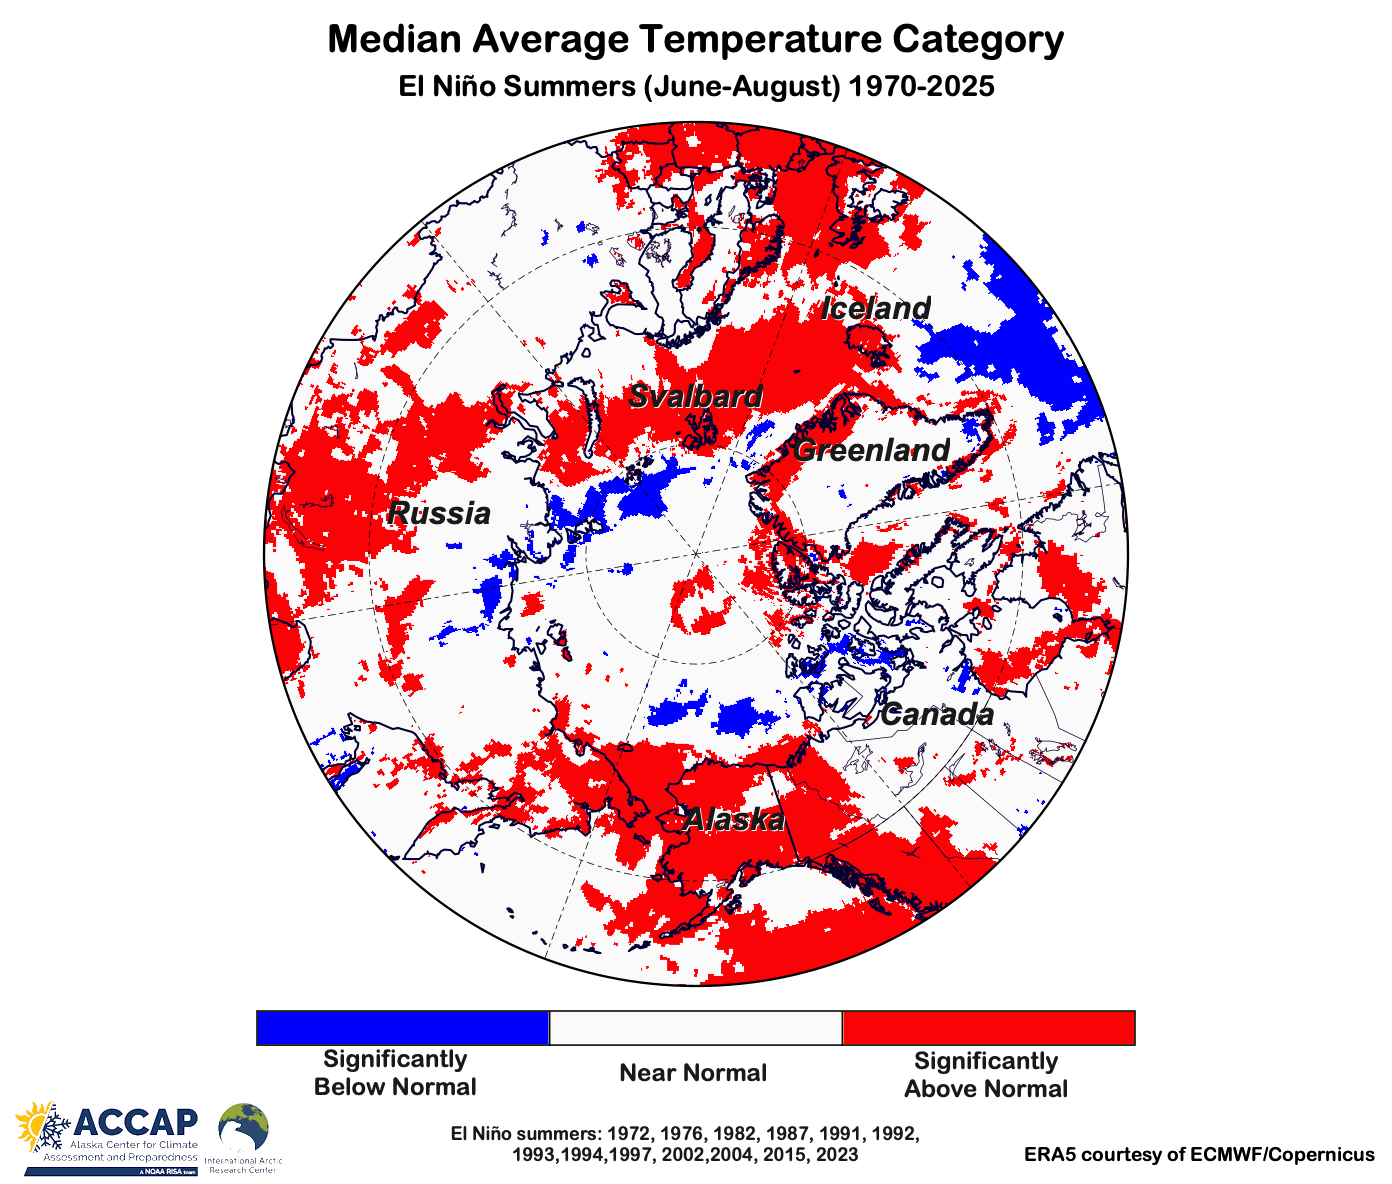
Constructing a three-category temperature analysis for each of the 13 El Ninõ summers since 1970 using the era appropriate baseline and then finding the median category gives us a better sense of the “tilt”, if any, during El Niño (Fig 3). This highlights that hardly any Arctic lands have been disproportionately on the cool side during El Niño summers, though this is favored over the parts of the high latitude oceans. In contrast, most of northwest Canada, Alaska and far northeast Russian have favored above normal temperatures when El Niño is present, as has the Atlantic Arctic from eastern Greenland across Iceland to Svalbard, though most of the Nordic Arctic has not favored significantly warmer than normal summers.
Precipitation
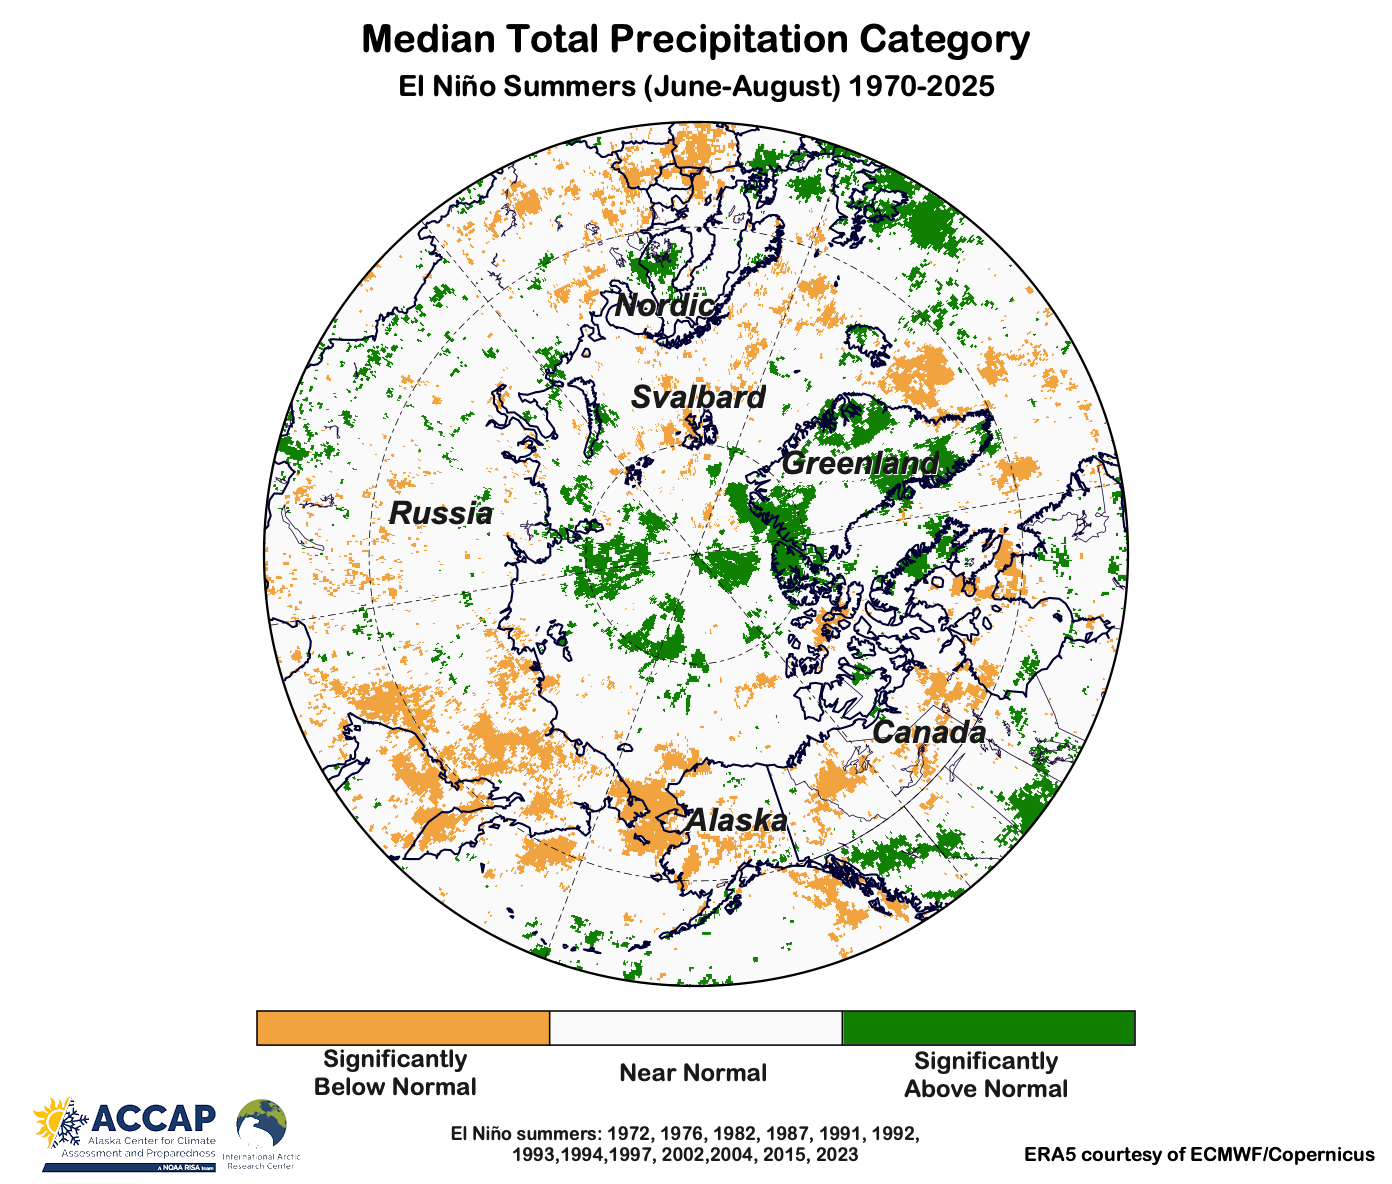
Precipitation varies over short distances much more than temperatures, even after accounting for orographic influences that are part of the climatology. “Normal precipitation varies greatly around the Arctic, in summer averaging less than 40 mm on the inland northern Greenland Ice Sheet to over 400 mm on the western Norway coast, southeast Iceland and the northern Gulf of Alaska coast. So here the category approach to departures is especially useful.
During the 13 El Niño summer since 1970 (Fig. 4), there is a general tilt to favor significantly below normal precipitation from the Canadian Arctic west of Hudson Bay westward across Alaska all the way into eastern Siberia. Significantly above normal totals are mostly confined to Greenland and easternmost Arctic Canada but with smaller areas in Finland and the high Arctic Ocean. The European and western Asian Arctic are mixed without much of any coherent pattern.
Sea Ice
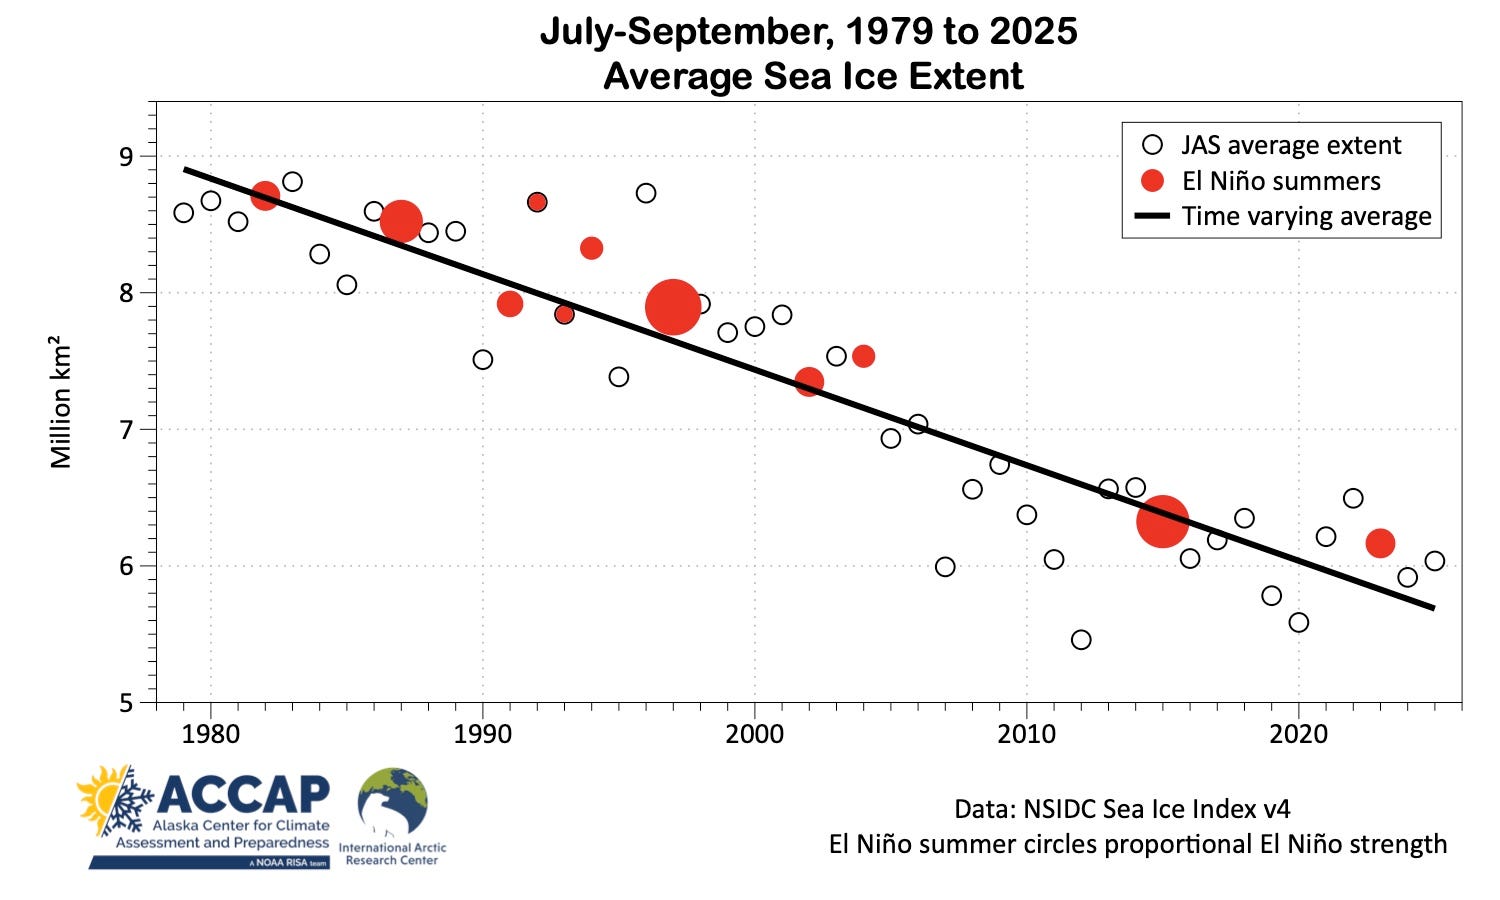
Previously I looked at the September sea ice minimum extent that followed El Niño summers, and found that after accounting for the multi-decade trend there was no correlation between extent and the presence of El Niño. Broadening the analysis to look at ice extent for the later summer (July-September) season, instead of a single day, a (possibly) different story emerges (Fig. 5). During the 11 El Niño summers since 1979 (the start of the satellite era for sea ice monitoring), the July-September average ice extent was below the trend line only three times. However, it would be unwise to read too much into that: 11 occurrences in 47 years is not a lot. Even if there is no correlation at all, there’s still about a 10 percent chance of having eight of 11 above the trend line. Additionally, only two of the 11 El Niño summers have occurred in the past 15 years. Still, even with those caveats, it’s suggestive that El Niño summers favor at least “not low” late summer ice extent.
Technical Details
As usual in this newsletter, Arctic means “poleward of 60°N” unless otherwise specified.
ERA5 monthly temperature data available through the Copernicus Climate Data Store, here.
Code by B. Brettschneider with NWS that allows for rapid ERA5 regional analysis is invaluable for my work.
NSIDC Arctic Sea Ice information, graphics and data available here.
Thanks for reading Alaska and Arctic Climate Newsletter! Subscribe for free to receive new posts and support my work.
Comments
Nothing yet. Say the first thing.
Sign in to join the conversation.