
A few months back, our Postgres instance started throwing FATAL: remaining connection slots are reserved errors at the worst possible time — during a traffic spike. The database itself was fine. CPU at 40%, plenty of memory. The thing that fell over was the one resource nobody graphs until it breaks: connections.
That incident is what eventually led me to AWS RDS Proxy, and this post is everything I wish someone had told me before I deployed it — how it actually works under the hood, when it’s worth the money (and when it isn’t), how to build it properly with CDK, and the monitoring gotchas that confused me for a solid week.
The problem RDS Proxy solves
Every Postgres connection is a forked OS process on the database server. Each one costs real memory (a few MB), and the server has a hard ceiling — max_connections. On a typical production instance that ceiling might be 5000, but the practical limit is lower because memory pressure builds long before you hit the number.
Now think about how a modern fleet talks to that database:
4 API servers, each running a connection pool of 20
8 Celery workers, each forking subprocesses that each open their own connection
A handful of cron jobs and one-off scripts
Auto-scaling, which means this multiplies at exactly the moment your database is busiest
Application-side pools (SQLAlchemy’s pool, Django’s CONN_MAX_AGE, pgbouncer-per-host) help, but they only pool within one process or one machine. Nobody coordinates across the fleet. When you scale from 4 API instances to 12, your connection count triples and your database never agreed to that.
RDS Proxy is AWS’s answer: a managed, highly available connection pooler that sits between your fleet and your database. Your applications connect to the proxy; the proxy maintains a small, warm pool of actual database connections and shares them across everyone.
How RDS Proxy actually works
The mental model that finally clicked for me: RDS Proxy decouples client connections from database connections.
App fleet (hundreds of connections)
            │
            ▼
┌─────────────────────────┐
│       RDS Proxy         │   ← terminates client connections
│  ┌───────────────────┐  │
│  │  Connection pool  │  │   ← small pool of REAL db connections
│  └───────────────────┘  │
└───────────┬─────────────┘
            ▼
      RDS / Aurora            ← sees only the pooled connections
Three mechanisms make this work:
1. Multiplexing. A client connection to the proxy does not own a database connection. When your app issues a query, the proxy borrows a connection from its pool, runs the transaction, and returns the connection to the pool. Two hundred mostly-idle client connections might be served by fifteen real database connections. This is the whole value proposition in one sentence.
2. Pinning (the fine print). Multiplexing only works if a database connection is interchangeable between clients. The moment a client does something that changes session state — SET statements, session-level advisory locks, prepared statements in some configurations, temporary tables — the proxy can no longer safely share that connection.
It gets pinned to that client for the rest of the session. A pinned connection is a wasted connection: you’re paying for the proxy but getting none of the multiplexing. Heavily-pinned workloads are the #1 reason teams deploy RDS Proxy and see no benefit. We’ll come back to this in monitoring.
3. Warm pool + failover handling. The proxy holds connections open even when clients disappear, so a Lambda cold-start burst or a worker fleet restart doesn’t stampede the database with connection setup (which is expensive in Postgres — fork, auth, TLS handshake). On Aurora, the proxy also tracks failovers and reconnects to the new writer faster than DNS-based clients typically do, often cutting failover-visible downtime by more than half.
One operational detail worth knowing: a proxy is itself backed by multiple ENIs/instances inside your VPC across AZs. That matters later when we talk about Performance Insights.
Pros, cons, and when to actually use it
I’ll be honest about this.
What it’s genuinely good at
Fleets of small consumers. Lambda, Fargate tasks, multiprocessing workers — anything where connection count scales with compute instances. This is the canonical use case.
Surviving deploys and scale-out events. A rolling deploy that restarts 50 workers no longer causes a connection storm.
Faster, cleaner failover on Aurora — the proxy absorbs the reconnect dance.
A central knob for connection budgets. This one is underrated, and it’s the core of the design I’ll show below: you can give each workload a hard cap on how much of the database it’s allowed to consume.
Credential isolation. The proxy authenticates to the database via Secrets Manager; clients can authenticate to the proxy via IAM if you want, and apps never need the raw DB password on disk.
What it costs you
Money. You pay per vCPU of the underlying database, per hour, per proxy. Run seven proxies against one large instance and the bill is real. Check the math before you copy a many-proxies design.
Latency. Every query takes one extra network hop. For most OLTP workloads it’s single-digit milliseconds and invisible. For a chatty service doing thousands of tiny queries per request, it adds up — measure it.
Pinning erases the benefit. If your ORM or framework sets session state on every connection, you get all the cost and none of the pooling. Audit this first.
Same-VPC requirement. The proxy must live in the same VPC as clients reachable to it; it’s not a public internet-facing pooler.
My rule of thumb
Use RDS Proxy when your connection count scales with infrastructure rather than with load, and your transactions are short and stateless. Skip it if you have a small, fixed fleet with well-behaved long-lived pools — pgbouncer or your ORM’s pool is free and one hop shorter.
The design: one proxy per workload, not one proxy for everything
Here’s the architectural decision that shaped my whole implementation, and I think it’s the most useful idea in this post.
The naive setup is one proxy in front of the database and every service connects through it. It works, but it recreates the original problem one layer up: a runaway worker fleet can still starve the API of connections — they’re all drinking from the same pool.
Instead, I create one proxy per workload, all targeting the same database, each with its own slice of the connection budget via max_connections_percent:
api proxy            →  3% of max_connections   (~150 conns)
celery proxy         →  6%   (~300 conns)
batch-workers proxy  →  10%  (workers fork subprocesses — needs headroom)
common proxy         →  4%   (everything else)
Now the connection budget is an explicit, reviewable, version-controlled contract. When the batch workers go haywire, they exhaust their 10% and the API doesn’t notice. It’s the bulkhead pattern applied to database connections.
The trade-off is cost (each proxy bills separately) and a little more cognitive overhead — which is exactly why this entire thing lives in its own small CDK app, deployable independently of the application stacks.
Monitoring: the metrics that actually matter
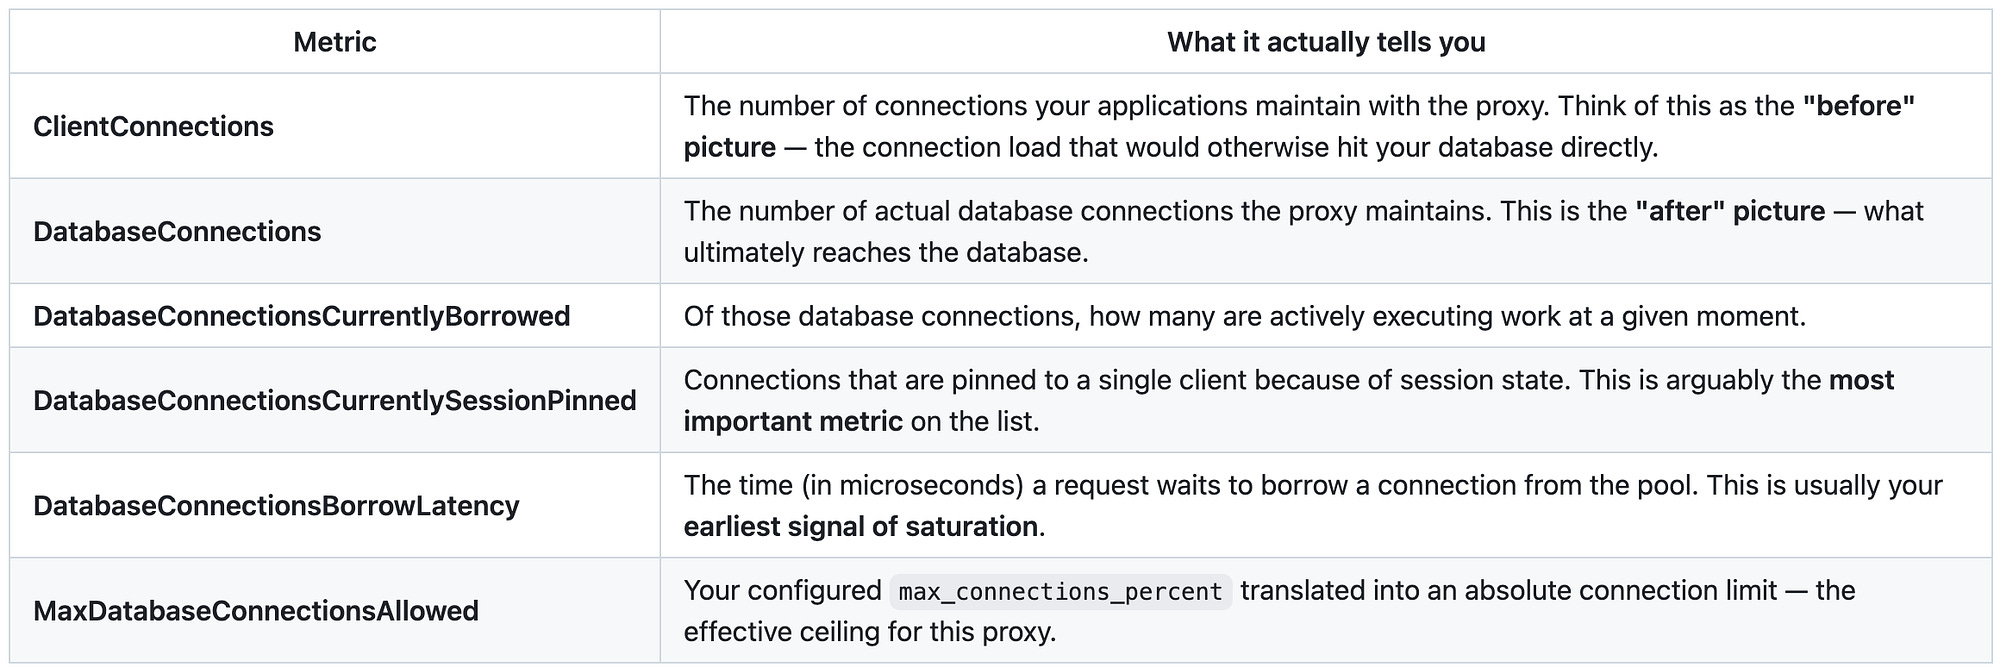
RDS Proxy publishes per-proxy metrics to CloudWatch under RDS → Per-Proxy Metrics. There are roughly 20 metrics available, but in practice, I actively monitor six. The key is understanding what they mean, not just what they count.
Thanks for reading! Subscribe for free to receive new posts and support my work.
How I Read These Metrics Together
1. Multiplexing Efficiency = ClientConnections : DatabaseConnections
This ratio tells you whether the proxy is actually doing useful work.
If 400 client connections are being served by 60 database connections, the proxy is earning its keep. That’s healthy multiplexing.
If the ratio trends toward 1:1, you’re effectively paying for a proxy that isn’t reducing database load — and the cause is usually the next metric.
2. DatabaseConnectionsCurrentlySessionPinned Should Stay Near Zero
Persistent session pinning is a red flag.
It usually means some code path is introducing session state that prevents multiplexing, such as:
SET search_pathSession-level locks
Certain prepared statement patterns
Temporary tables or session variables
When a connection becomes pinned, the proxy can no longer safely reuse it across clients.
A practical debugging trick: temporarily enable debug_logging on the proxy. RDS Proxy logs the exact statement responsible for pinning. Fix the offending query, and you’ll usually see:
Session pinning drop
Multiplexing recover
Database connection pressure reduce
This is a metric worth putting an alarm on.
3. Rising DatabaseConnectionsBorrowLatency = Pool Pressure
Borrow latency rises before failures happen.
If this metric starts climbing while DatabaseConnections sits flat against MaxDatabaseConnectionsAllowed, one of two things is happening:
Your connection budget for the workload is too small
Something upstream is leaking or hoarding connections
Eventually, once wait time exceeds borrow_timeout, clients begin failing with connection errors.
That makes borrow latency your best early-warning signal.
4. Watch ClientConnectionsSetupFailedAuth After Secret Rotation
Any time database credentials or secrets are updated, keep an eye on this metric.
If the database password changes but the proxy is still authenticating against an outdated secret, this metric spikes immediately — often before anyone checks logs.
It’s one of the fastest ways to identify broken credential rotation.
5. AvailabilityPercentage Deserves a Low-Urgency Alarm
This metric tracks whether the proxy’s target group can actually reach the database.
Drops here usually point to:
Security group issues
Target health failures
Failover windows
Network reachability problems
You probably don’t need a pager for it, but it’s worth monitoring.
The Performance Insights gotcha
This one cost me an afternoon, so let me save you yours.
In Performance Insights (and in pg_stat_activity), every database connection shows the client IP it arrived from. Before the proxy, that was your application server — so when you sliced load by host, you could instantly see “the celery boxes are hammering the DB.”
After the proxy, every connection arrives from the proxy’s ENI IPs. The host dimension in Performance Insights now shows the proxy’s private IPs — not your app servers. The proxy terminates the client connection and opens its own, so from the database’s perspective, the proxy is the client. Your old “which server is misbehaving” workflow silently stops working.
Two ways to get the attribution back:
One proxy per workload (the design above) pays off again here: each proxy has its own ENI IPs, so “which workload is hammering the DB” is still answerable — map the IPs once, or better, just look at the per-proxy
DatabaseConnectionsCurrentlyBorrowedin CloudWatch.Tag at the application layer: set
application_namein your connection string per service (psql-family drivers all support it). Performance Insights can slice by application, which is more durable than IP-based attribution anyway.
Closing thoughts
If I compress everything above into the advice I’d give a colleague over coffee:
Check pinning before you build anything. If your workload pins, RDS Proxy is an expensive no-op. This is a one-day spike with one proxy and
debug_loggingon.One proxy per workload, budgets in version control, arithmetic in comments. The bulkhead is the real win; pooling is almost a side effect.
Migrate via secrets, not code. The companion-secret pattern made each service’s migration a config flip with a built-in rollback. Whatever your config mechanism is, build the equivalent.
Alarm on
SessionPinnedandBorrowLatency, glance at the client/database connection ratio weekly, and re-learn host attribution in Performance Insights before the first incident, not during it.
RDS Proxy didn’t make our database faster — that was never the point. It made the connection layer boring: deploys don’t stampede, scale-outs don’t starve the API, and the failure mode of a runaway worker fleet is now “that workload’s pool saturates” instead of “everything is down.” Boring is what you want from infrastructure.
Comments
Nothing yet. Say the first thing.
Sign in to join the conversation.