
Welcome to the weekly report! This report is targeted at investors that don’t have time to monitor the ebbs and flows of the market day to day and still want to beat the market and avoid bear markets🚀. Just 10 minutes a weekend is all it takes.
I focus on the MAJOR themes and the MAJOR trends of the markets in this report. All the models I present are back tested with results so you can see that they work🤔.
This post is long - so make sure you read it on the Substack App or Website so you get to see the bottom of it - Email can often cut the message short. Let’s get into the weekly models!
This week was a typical, very slow Summertime week that had one major catalyst, and it was the PPI and CPI (Inflation) reports. I covered them in detail in the Daily Notes as the data came out but the TL/DR of it is that a lot of the data is simply not matching up with past instances of inflation here and frankly even private providers of inflation data are saying the data is not right and likely to need revisions later.
I am going to do a deeper dive soon on the CPI and PPI reports since Trump fired the Chief Statistician of the BLS. It’s still unclear who is going to lead them. Trump’s initial idea was to appoint a flunky and that was broadly met with Boos. Now he’s onto trying to smooth things over and appoint a Data Nerd back into the job, but the damage is extraordinary from the last year and a half at the BLS - a third of the leadership is gone from DOGE stuff, budget cuts, and hiring freezes that have led to early retirements and brain drain.
Stock markets are taking the data at face value, and we are seeing a reliable bid back into the stuff that was leading up until the start of earnings season (when everyone realized the AI stocks are very, very overvalued), but that stuff is now hitting resistance in many places.
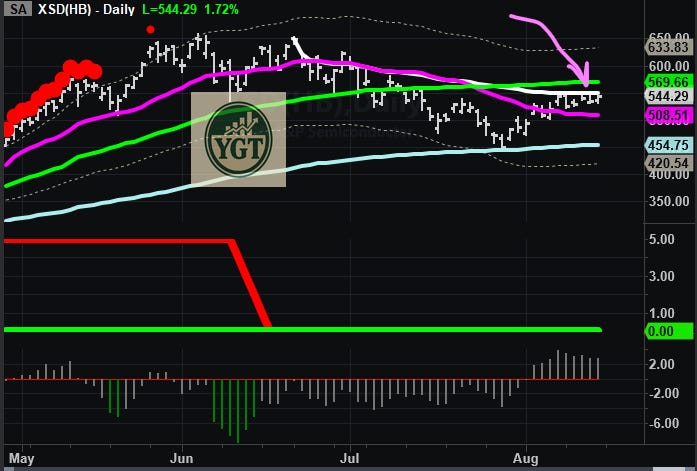
The XSD 0.00%↑ XSD (Semis ETF that is more broad-based than SOXX) is actually hitting the Anchored VWAP from the Highs and finding predictable resistance. This is where a low risk short could be played with a stop just overhead around the Green Line. This looks like a setup for Chop to me, with support at the Gray Line (Yearly VWAP) and Resistance at the Green Line / Falling White Line.
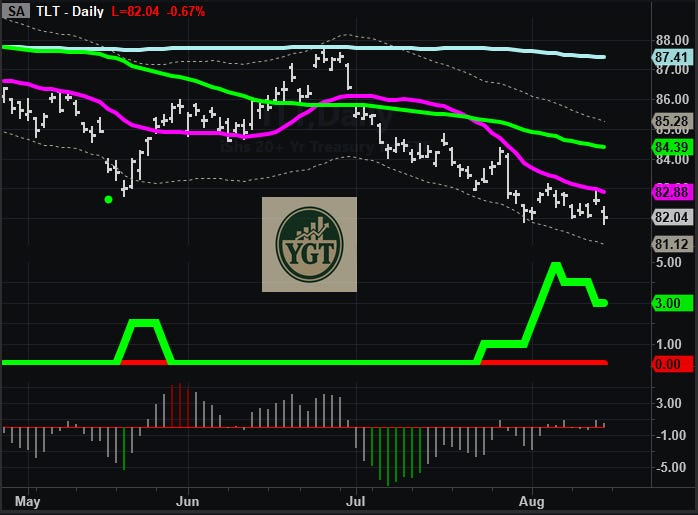
Despite stocks eating up the inflation data, the bond markets are not having any of it, and that’s the theme we are going to covering this week. Bonds were down almost 1% this week despite data that would suggest inflation has peaked. They remain mired in a major downtrend.
People probably forget because we all have the attention span of a toddler these days, but back in January Trump ordered Fannie and Freddie Mae to start trading again in the Mortgage Bond markets in order to “keep mortgage rates down.” Here’s how that went - he pretty much bottom ticked the Mortgage Rates (top ticked the Bonds).
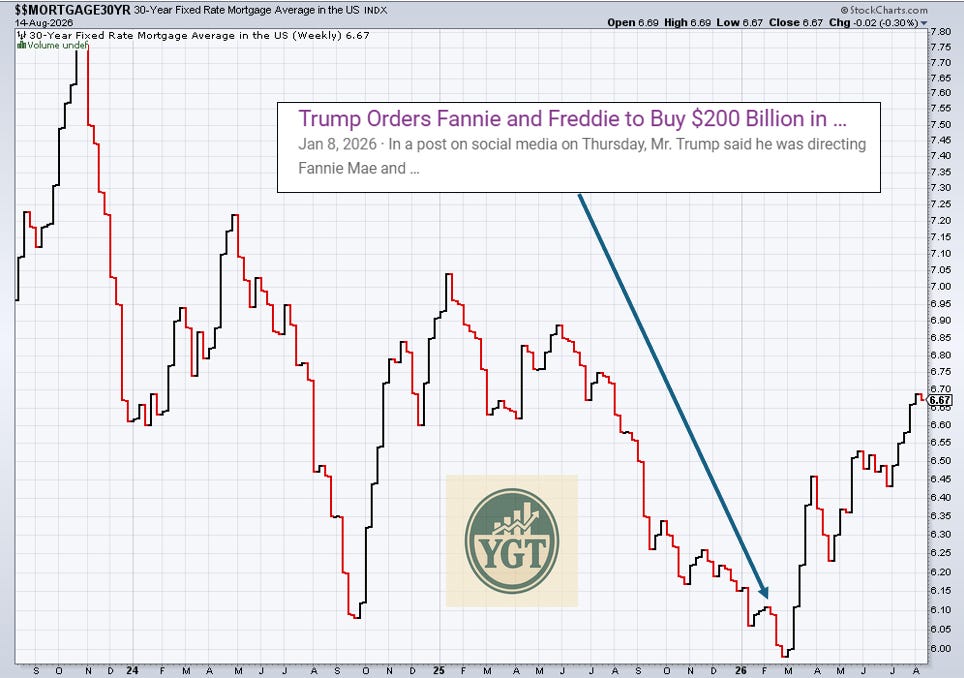
So, now we have Fannie and Freddie sitting on losses most likely in these Bonds (remember if rates go up, bond prices go DOWN). That’s how they went bankrupt in 2008 and had to be rescued (and it’s why they are still owned by the US Government to this day).
So - why does this happen? It seems completely illogical for markets to act this way. Well, not really. Markets are forward looking, and one big effect that continues to be under reported (because it’s difficult to quantify) is the premium being charged for US assets simply due to the uncertainty associated with basic policy that shouldn’t be difficult to get right. Things that were just never questioned before are now being loudly talked about as uncertain.
When Trump does something like firing someone as important as the Nerd that crunches the numbers for inflation and unilaterally declares (without proof) that the numbers are being politically motivated as fake, then it causes markets to charge a premium to assess the uncertainty that now the numbers going forward could very well be MORE fake than usual. Right now, SOFR Swaps for the 10-year Treasury expiring in a year are still trading at 4.23% while the 10-Year Treasury itself is trading at 4.6+%, which is almost a 0.5% premium - it’s real.
Firing the BLS nerd ripped the Economic Policy Uncertainty Index (EPU). These kinds of sharp increases are widely associated with reductions in Industrial Production, GDP, etc. because businesses spend less when things are uncertain. Different Economists have calculated that this caused about $20 billion in damage to the economy, which is like 20x more than the entire budget of the BLS.
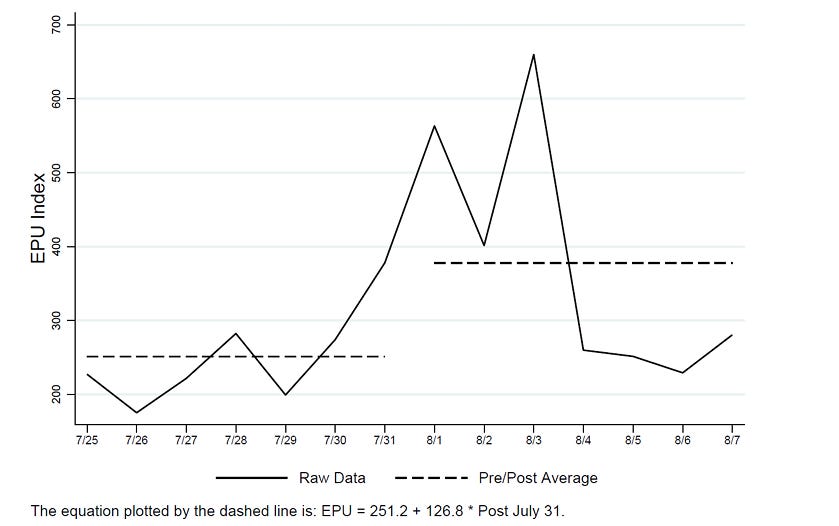
I’ll talk more about this kind of thing in a deeper dive later but suffice it to say that it’s a theme that has been running through the markets for a while now and has gotten acutely worse. It is one reason why the US Bond markets simply will not get off the mat and go up (even when the rest of the world is seeing their bond markets rally over the last couple weeks). It does matter.
The big thing I’m looking at this week is a swath of Consumer names that report this week. We got HD 0.00%↑ HD and LOW 0.00%↑ LOW as well as TGT 0.00%↑ TGT and WMT 0.00%↑ WMT. BJ 0.00%↑ BJ also reports.
Of note, the Consumer Discretionary Sector peaked at the election in 2024 and has done nothing since, almost 2-Years of malaise.
These names should supply use with an excellent read on the Consumer. I’ll cover these setups for subs in the Daily Note - we might get some earnings trades out of them.
Absent that, we do get FOMC minutes on Wednesday - but I think the market already knows what they say. Remember the end of the month has NVDA 0.00%↑ NVDA earnings as well as the “Jackson Hole” Speech by Kevin Warsh - typically Jackson Hole has served as a place where FOMC heads announce major policy shifts / stuff. Warsh needs to do major damage control after he rope-a-doped markets into believing he was tough on inflation (he is not).
Each week I review a chart or model that I would normally keep behind the paywall, I hope you can make a couple bucks off of it! 🤑
Today we are going to talk about an area of the market that is pretty heated now and it’s Singapore. Singapore?! No one is talking about Singapore. So, why is this thing going nuts? Well, in a time of considerable Geo-Political uncertainty, Singapore stands out as very stable (and VERY rich!). Their currency has done fine this year, and they have a lot of banks that make up their economy (and the Banks have been VERY strong over the last few weeks).
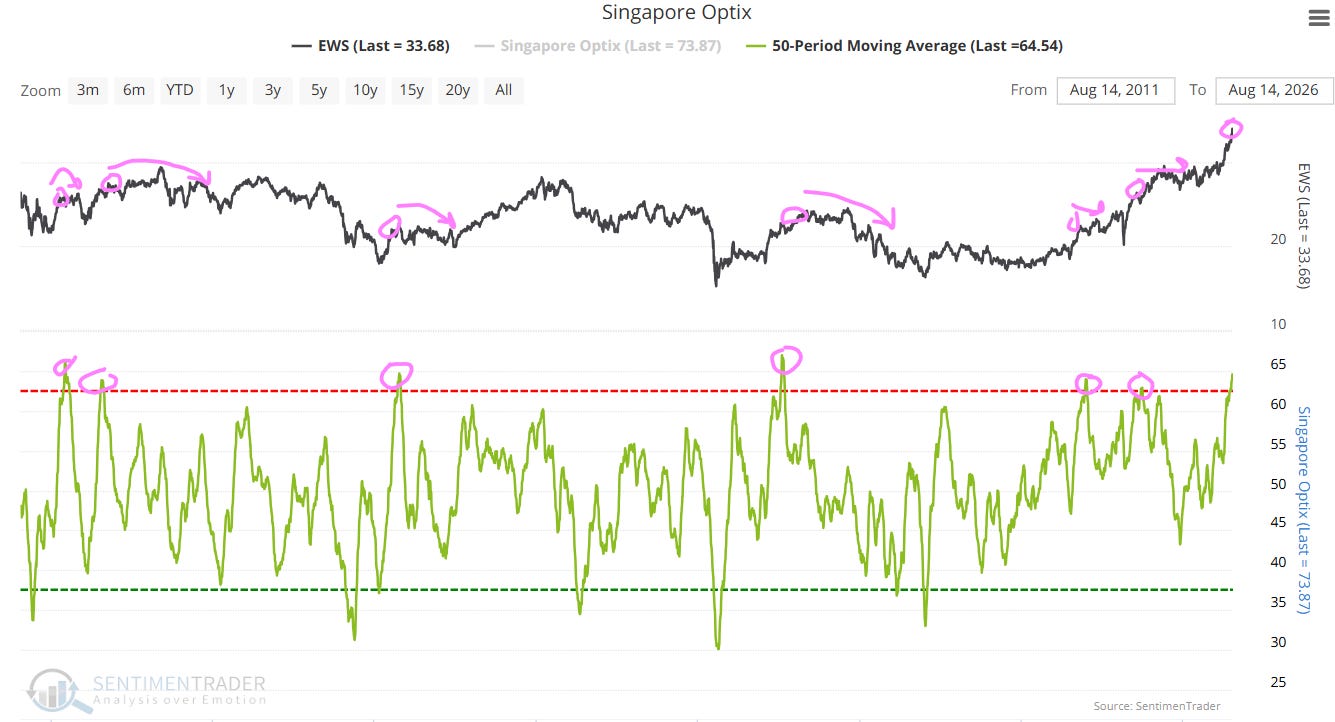
But all good things must come to an end. We are seeing longer term sentiment hit some very extreme levels that are typically associated with weakness over the coming months.
Now - how does this help me trade the US markets? Well, knowing that Singapore (especially since COVID) has become a major banking center lets me use this kind of Sentiment to time the Financials Sector in the US.
Let’s zoom the Sentiment Chart in and replace Singapore’s stock market with the US Financials Sector. Look at the prior two times we got the Sentiment for Singapore up here. Financials in the US topped and went into multi-month drawdowns of about 15% to 20% both times.
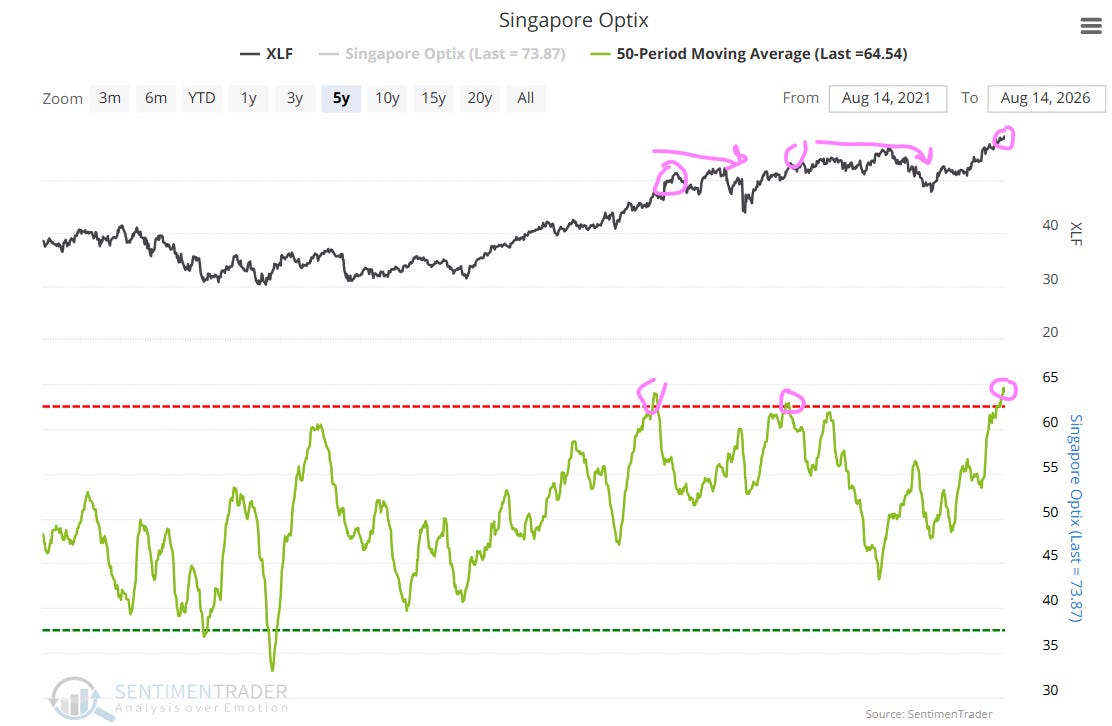
So, how am I using this kind of thing in my own trading? I’m avoiding Financials now. They are setting up to top. If these kinds of “outside the box” idea appeal to you, I can help you spot these kinds of Inter-Market dynamics for all kinds of other stuff!
Comments
Nothing yet. Say the first thing.
Sign in to join the conversation.