
Welcome to the morning report, where I go over the setup for the day as it relates to day trading. I’ll review levels using options gamma and show you where the support and resistance lie along with some other proprietary metrics like options skew and my very own Day Trading Bar Score that have good track records for forecasting bullish or bearish tendencies for the day.
New Folks. If you have questions, go here and watch the videos and read the FAQ. And feel free to send me a message - you’ll hear from me soon if you don’t anyway.
We are treading water so far this morning, but we got some truly terrible Retail Sales data this morning. Let’s unpack it. We are seeing the effects of high gas prices materialize. The CEOs of WMT, TGT, BJ and COST have all said it - material tightening is happening and even middle to high-middle class folks are feeling the pinch.
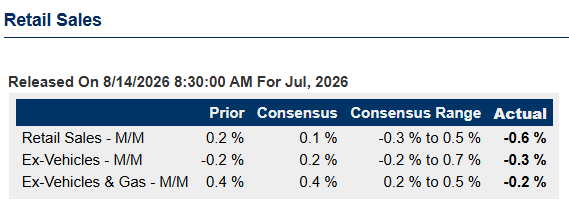
I’ve long argued all we needed to do what knock down the AI trade and we’d see a material pullback in the spending from the Rich - we did that and now we have a terrible Retail Sales print. Contraction is bad. And we now have 2 months in a row of contracting Retail Sales. That hasn’t been seen in a long, long time.
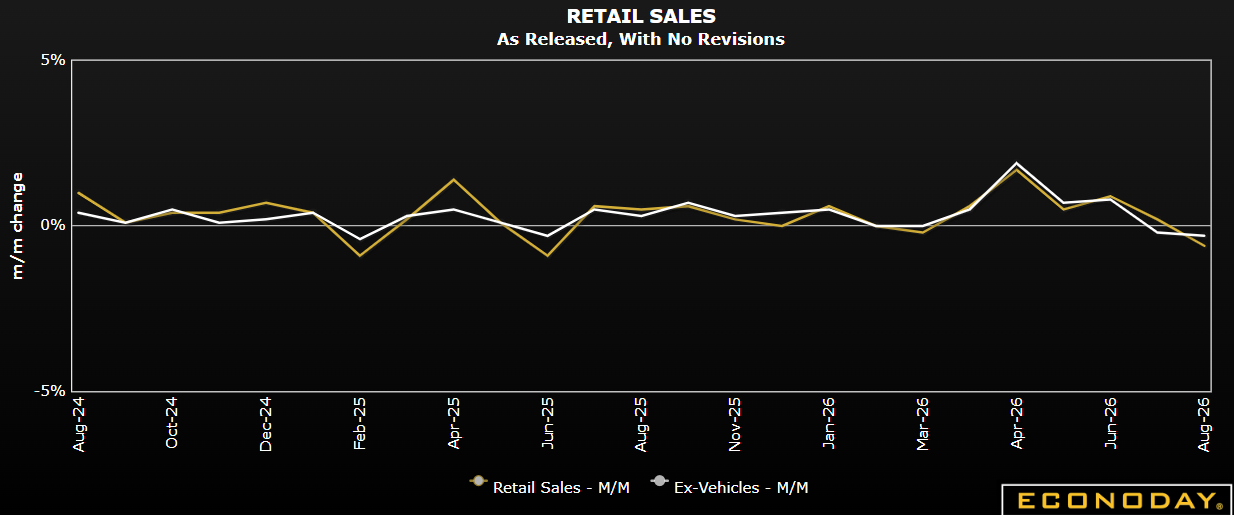
Markets are holding up because - as usual - they only care about if the Fed is going to hike and kill the Bull Market.
If the economy starts to tilt into a recession, then the Fed will have an excuse to ease (which Ironically will make it worse when rates go up). We really need prices to go down and the only way they can move down is either people stop buying stuff (which looks like is happening) or the Fed hikes and knocks the speculation down and we get some credibility back into the Financial System.
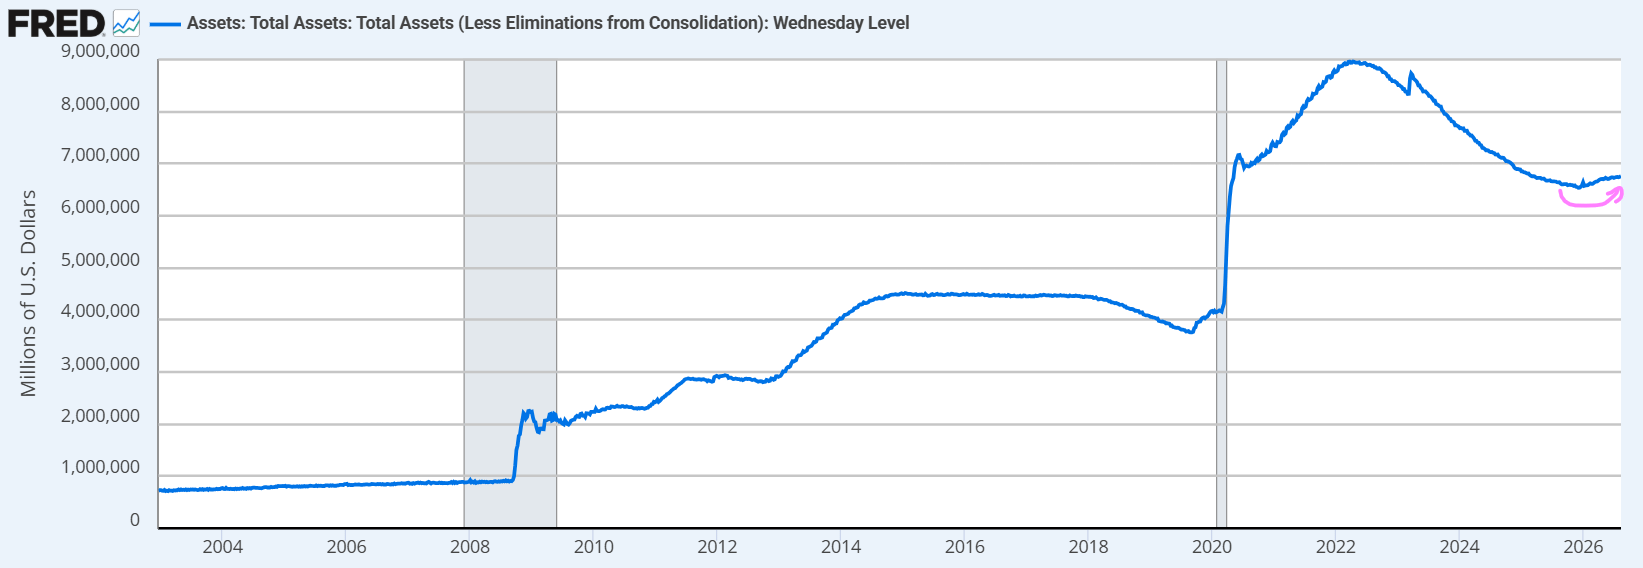
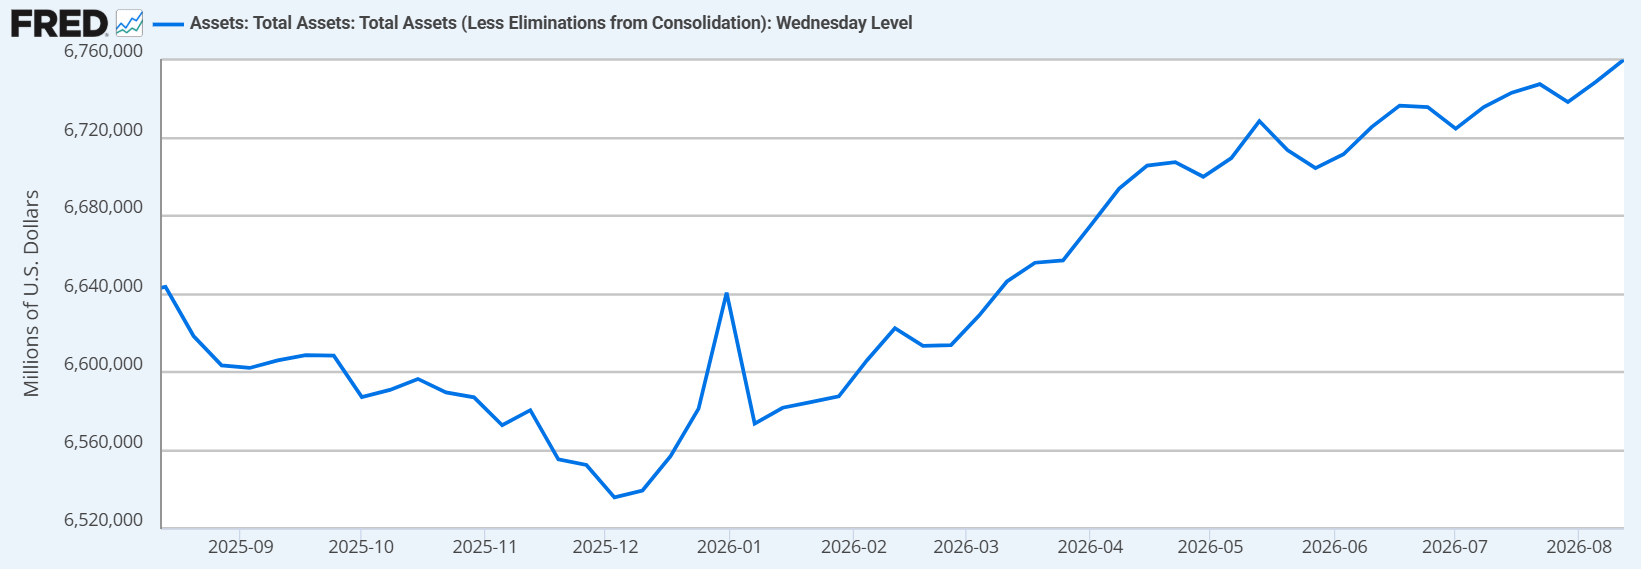
The other thing to make sure you understand in the back of your mind is that we got the Fed Balance sheet data yesterday and it’s moving up materially now week over week. That doesn’t look like much, but when that goes up, it means that money is going to buy stocks (and bonds). It acts like a Rate Cut. There is no reason for them to be doing this - they should be tightening, getting the thing back down to Pre-Covid levels. Not enough people talk about this.
I’ll zoom in on the last year or so.
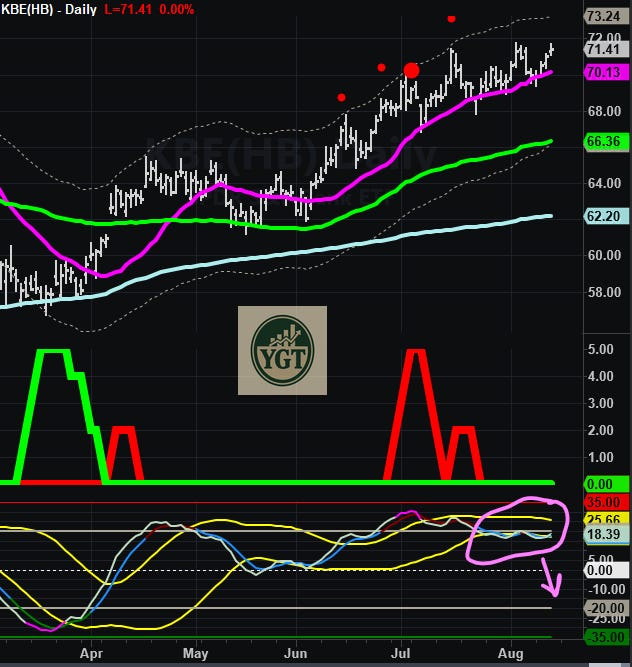
I’m watching the banks for signs of stress. The momentum indicator is getting pinched on the bottom - that usually means a bigger move (directional) is coming. When it’s sitting in the overbought region like it is now, the probability increases for a swift push downward.
Comments
Nothing yet. Say the first thing.
Sign in to join the conversation.