
Let’s start by talking about Canada’s natural and human resources. Both are pretty top notch.
Natural Resources:
Canada is the 5th biggest crude oil exporter ($106B), slightly behind the UAE and slightly ahead of Iraq. Canada is also the 3rd largest exporter of iron ore ($6.73B), 6th largest exporter of coal ($7.5B), 4th largest gold producer, 8th largest exporter of copper ($3.5B), and the 2nd largest exporter of uranium ($3.21B), exporting more uranium than all of Africa combined:
Human Capital:
Canadians, on average, are more numerate than the average OECD country, while Americans are on average behind.
If you rewind to 2012, the average Canadian was slightly richer than the average American, and Canadians were ~25% higher than Brits.
But after 2012, America blew past Canada and the UK caught up with Canada.
Some readers will object and say “Don’t use GDP per capita!”, use “gross national income (GNI) per capita!” or say “Use PPP! Currency fluctuations between the USD, CAD, and GBP are explaining the variation!”
Well I have news for you. Even if I switch to gross income per capita, adjust GDP per capita by purchasing power parity, or do both then Canada never converges with America at all. I was actually being generous to Canada by using market exchange rates.
Regardless, the question is: “what happened to Canada”?
First, it’s worth noting that Canada is mainly a commodity exporter. The 2000-2014 was the China fueled commodity boom that caused global commodity prices to soar.
To put the sheer scale of China’s rise into perspective: between 2011 and 2013, China used more cement than the US did in the ENTIRE 20th century.
Canada, as a net commodity exporter (especially oil), benefited from China’s commodity rush and it strengthened their currency as a tailwind. Back then, since this was Pre-US shale revolution, America was a net oil importer, so high oil prices were a headwind for America’s currency. As a result, the Canadian dollar was trading above or at parity with the US dollar, which was partly why Canada was able to come out slightly richer than the United States.
But after 2014, China’s commodity boom ended and America’s shale revolution flooded oil supply, cratering oil prices and weakening Canada’s currency to the dollar.
While currency fluctuations explain some of the drop, it doesn’t entirely explain why Americans in 2024 make over 30% more than Canadians. Let’s look at both nations’ per capita growth from 2014 to 2024, and decompose the factors:
Scenario 1: The US Dollar view: Measured in USD, America’s income growth over that decade was 63%, while Canada’s was 7%. (Objection: “But the Canadian dollar weakened against the US dollar by 24% over the same time period! That’s not fair!”)
Scenario 2: The Local Currency view: Let’s look at nominal growth in their respective local currencies: America’s growth in dollars was still 63%. But Canada grew from C$56,643 to C$76,564, 35% growth. So even in local currency, America grew nearly twice as fast. (Objection: “What about inflation?”)
Scenario 3: The Real, Inflation-Adjusted View in local currency: US’s inflation adjusted growth was 20% over the decade, while Canada’s inflation adjusted growth in its own currency was 3%.
So even after stripping out population growth (since we looked per capita), currency fluctuations (measured growth in its own currency), and inflation (measured both in chained constant dollars). America still just grew faster than Canada.
We see that growth reflected in disposable income between American states and Canadian provinces. The richest provinces in Canada have lower household income per capita than some of the middling or poorest states in United States.
The petro-state, Alberta, has similar incomes to North Dakota, Ontario is similar to Florida, and British Columbian families have lower incomes than Kansans.
So why is this? There are many reasons, but I’ll start with a small diagnosis.
Canada’s economy is full of industries where there’s very little “creative destruction” and you have a few stable firms that are allowed to dominate market share due to Canada’s regulations. Over time, the incumbency advantage is too overriding and the big firms become complacent & stop investing in innovation. I could give so many examples, but I’ll just use airlines and banking to make my point on “stable oligopoly”. Then I’ll talk about the complacency next.
Canada: Canada’s airline passenger market is a duopoly. Air Canada & West Jet dominate 80% of the air passenger market in Canada.
In the United States, America’s market is more competitive. In US, American, Delta, United, and Southwest control 80% of the US market. Furthermore, America has a secondary market of Ultra-Low Cost Carriers (ULCCs) like Frontier and Allegiant. The ULCCs act as a permanent drag on prices compared to the big 4.
Canada: RBC, TD, Scotiabank, BMO, and CIBC control 90% of the financial services market in Canada.
Canadian banking law effectively shuts foreign banks out of retail deposits, which is the bulk of what most Canadians think of as “banking”.
America is nowhere near as consolidated as Canada in Banking. The big 4 (JPMorgan & Chase, Bank of America-Merrill Lynch, Citigroup, Wells Fargo) have slightly under 50% of all US deposits. The difference is America has 1000s of regional banks, community banks, and credit unions.
I can keep doing this for other industries, but the point is that Canada has these regulatory protectionist moats so it doesn’t get eaten up by the United States.
In short, the way Canada is regulated creates very stable markets, with relatively little risk taking or R&D spending. The regulation acts as protection for Canadian firms to not get swallowed up by American firms. But the lack of competition has led to lower investment into new technologies. Canada’s R&D spending as a % of GDP is atrociously low compared to the United States.
The terrible R&D spending and the major protection of markets from external competition contribute to lower labor productivity. The causality also works in reverse, as well. Poor labor productivity leads to more protectionism as a solution (firms & workers in struggling sectors lobby as a shield) and thinner margins from less productivity means less cash to invest in R&D.
The deputy governor of the Bank of Canada called Canada’s lack of productivity an “emergency”.
Sure, I’ll talk about labor productivity. I’ll actually connect this to the Canada question. Canadian workers are generally less productive than American workers.
This sounds subjective, but it’s a fact, especially once you understand what “labor productivity” means.
Between 2003 and 2023, Canadian labor productivity only increased 15%, which beats UK’s 8% but less than the US. America, which started at a higher base, in 2003, increased labor productivity 30%.
Labor productivity means “output per unit of labor input”. It’s worth noting that labor productivity does not really mean “American workers work harder than Canadians” or “American workers complete more tasks than Canadian workers”.
It’s more like saying "American workers generate more profits for their companies than their Canadian counterparts”. Once you see it that way, I am sure when I say “Americans are more productive than Canadians” provokes less of a knee-jerk reaction.
Labor productivity on the aggregate level is GDP divided by total hours worked. At the firm level, labor productivity is:

Now let’s define value added. For any business, the revenue of a company is used to buy intermediate inputs, pay wages, the maintenance of property, factories, & equipment, pay interest on debt, pay taxes, rent, and the rest is business profit. Let’s break down what I just said in an equation:

I am going to truncate this equation.
Instead of saying “raw materials, energy, logistics, & purchased services”, I’ll say “intermediate inputs”
Instead of saying “depreciation, interest, & rent” I’ll say “capital costs”
I’ll also just simplify “pre-tax profit” to “profit”
Instead of listing all the taxes I’ll just say “taxes”

Now, let’s subtract intermediate inputs from both sides. Look at the equation now:

Now you know what value added means. You can see that Value added is revenue minus intermediate inputs. Or, I can measure value-added by:
This basically means, every “value added”, goes to the employee’s share (Wages), paying for machines/buildings/creditor’s share/rent (Capital Costs), the government’s share (Taxes), and the investor’s share (business profits).
Divide by hours worked and you get labor productivity.

When you understand that equation, you realize that working longer hours actually decreases your productivity score (because hours are in the denominator).
Higher productivity in America usually comes from capital deepening (better tools, more machines, faster computers). Capital deepening increases value add per worker as it increases capital costs. More productive workers means the worker can make more revenue for the firm.
Secondly, Americans are working in more highly productive sectors than Canadians are. Again, when I say “high-productivity” that does not mean “American workers work harder”, it means “America has more industries that make more money with less costs per worker”.
Let’s look at productivity at different industries.
In 2024, Google made $350B in revenue with 183,323 employees. On average, each Google employee generates Google $1.9M in revenue.
If we subtract the intermediate inputs, in this case the $146.3B cost of sales (i.e. traffic acquisition costs paid to distribution partners [Apple, Mozilla, Samsung, mobile carriers, web publishers via AdSense], content acquisition costs, data center costs, etc), then Google’s Value added was $203.7B. Divide value add by the number of employees, and Google’s value add per employee is $1.1M.
If you divide Google’s value add per employee by 2000 hours (40 hrs per week * 50 working weeks per year), you see that Google workers on average generate, $556 of value added per hour worked.
We can do the same math for Ford. Ford makes half the revenue of Google with roughly the same amount of intermediate inputs and employees.
Ford made $185B, intermediate costs of raw materials, parts from suppliers, energy costs, etc. were $158B. This means Ford’s total value added was $27B. Divide this number by its 171K employees, and Ford’s value added per employee is $158K per worker. Divide by 2000 hours again, and the average Ford worker generates $79 of value added per hour worked.
The average Google worker is “7x more productive” than the Ford worker. Now, that’s not because Ford workers are lazy, it’s just that Google is literally in a higher productivity industry. There’s less intermediate costs to generate revenue.
Now if we iterate this to a bunch of top companies in the United States and Canada, we get a picture of productivity:
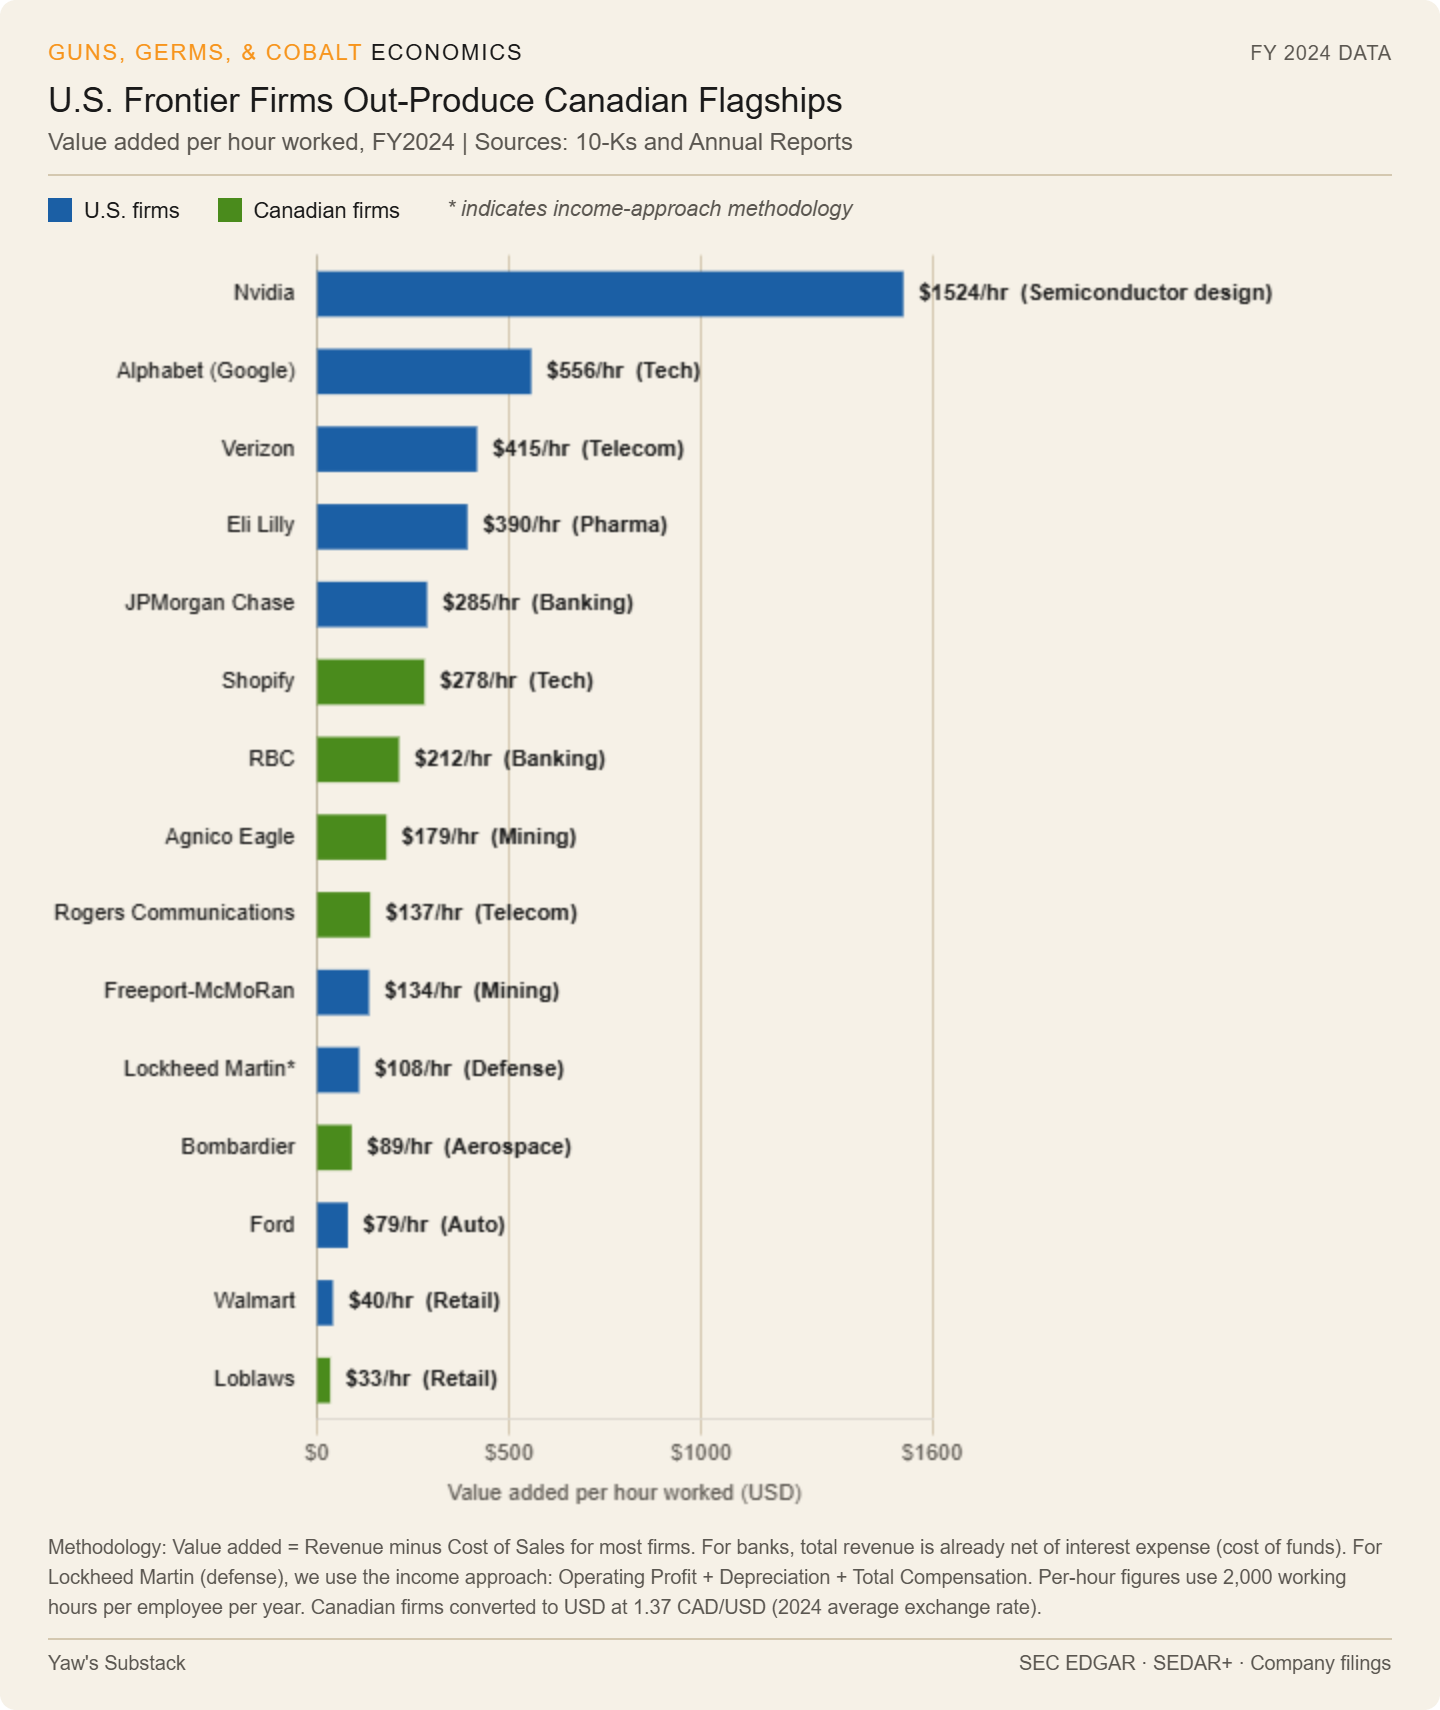
Generally speaking, the gap between America and Canada has two big explanations. Firstly, America has high-productivity sectors that Canada doesn’t even have, like semiconductor design and pharmaceuticals. Secondly, in general, American top firms make more money (and thus higher productivity) than their Canadian counterparts. That is true whether we look at retail (Walmart vs. Loblaw), technology (Google vs. Shopify), and telecommunications (Verizon vs. Rogers).
If you look at the chart below, you will see how underweighted Canada is in high productivity sectors (tech, semiconductor, pharmaceuticals) and how overweighted in low-productivity sectors (construction, food, beverages, & tobacco, and real estate).
The TLDR is America has big tech (Google/Amazon/Meta), big pharma (Eli Lilly/J&J/Pfizer), and big semiconductor design (Nvidia/Qualcomm/AMD), while Canada lacks those industries and has too many low productivity sectors such as mining, construction, logging, public-sector employment, and food & beverages.
This mismatch is one of the many drivers of America’s brain gain from Canada. Canada’s top talent usually flocks to the United States to work in highly-skilled, highly paid industries like in tech, AI, and other industries. America has the firms but doesn’t have enough domestic talent. Canada has the talent but not enough domestic firms.
There’s so much more I could talk about, like Canadian housing issues (which are even worse than America’s) or Canada’s chronically higher youth unemployment rate compared to the US. In April 2026, Canada’s was over 14%, while in America it was 9.5%. But, I’ll stop here for now.
One thing is, I don’t have academic training in history. My background is actually in aerospace engineering. I worked as an aerospace engineer then did real estate finance, followed by an MBA and my current work in product data science.
But I think my unconventional background is exactly my “moat”. I don’t approach history purely through a traditional academic lens; I look at it the way an engineer looks at a complex system. When I research African history, I break it down into its structural components across four phases: Country Overview, Pre-colonial history, Colonial history, and Post-Independence History. My source material and approach shift across these eras, adapting to what data and information exists.
Here’s how the stack breaks down:
The overview: This is the easiest part. I pull demographic, financial, and resource data from a standard stack: UN Population Prospects, UN’s Food & Agricultural Organizational Stats, World Bank, IMF Article IV Economic reports, Trading Economics, Our World in Data, UN Trade & Development Stats, Transparency International, and MIT observatory for Economic Complexity. Then after pulling the information, it’s just storytelling from there.
Pre-Colonial History:
Know the Map: I start by mapping the specific pre-colonial states using historical map timelapses on “Map of Africa” videos on YouTube as a visual checklist (which are not comprehensive but a good start!).
Build the Skeleton: Then, I build a skeleton from encyclopedia-style books like the UNESCO General History of Africa, Library of Congress Country Studies, and Fortunes of Africa.
Learn the Region: Then I look at regional books like a “An Economic History of West Africa” or “A History of West Central Africa to 1850”. Next, I tailor the deep dive, with some pre-colonial books.
Get Specific: For Rwanda, that meant reading about the pre-colonial Rwandan Kingdom in the book, A History of Rwanda: From the Monarchy to Post-Genocidal Justice. For Nigeria, it’s reading books on the pre-colonial Kingdoms in the South ( Igbo, the Benin Kingdom, and the Yoruba) and in the North (Bornu, a whole book on the North which discussed the Hausa, and the Sokoto Caliphate). For Tunisia, I track the Berbers, Carthage, Rome/Byzantine eras, Islamic Conquests, the Mediterranean and Trans-Saharan slave trades, and more.
Know about the different forms of slavery: The Transformations in Slavery: A History of Slavery in Africa by Paul Lovejoy covers the Trans-Atlantic, Trans-Saharan, Indian Ocean, Red Sea, and the Internal African slave trade in different African societies. Also, The Shell Money of the Slave Trade talks about how African coastal Kingdoms would exchange slaves for Maldivian cowrie shells, which served as the “reserve currency” in West Africa.
Colonial History: The Encyclopedia books still have great info on colonial history, but I lean on the specific books. “A History of Rwanda” is still very good on pre-colonial history. For Nigeria, I used “A History of Nigeria” & “Nigeria: Background to Nationalism”, and for Tunisia, I read a “History of Modern Tunisia”. I also supplement the books with NYT Archive articles from 1880-1960, Colonial Annual Reports, and JSTOR articles, when I want a deeper dive on a specific topic in that period.
Post Independence: The data gets richer, and the books get more specific. I shift to deep dives on specific leaders (Like I read Ernest Harsch’s Thomas Sankara: A Revolutionary in Cold War Africa for my Sankara article), and for 1970-1980s Nigeria I read Oil and Nationalism in Nigeria 1970 to 1980 and The Nigerian Oil Economy: From Prosperity to Glut, plus the World Bank’s comparative Nigeria-Indonesia study. At this point, since every country has to report their stats to the World Bank & IMF, you can also read World Bank archives or IMF Article IV economic report to see what macroeconomic trends, loans, and other stuff on what the country was doing at the time. In addition, I look at Washington Post, Reuters, AP, Financial Times, and Bloomberg articles on the country as we get closer to the modern day. A final supplement is that I also pull from broader continental books that have country-level case studies like Dictatorland, The Fate of Africa, How Africa Works, and Dead Aid.
As a sanity check, I reach out to my MIT Africa alumni WhatsApp group, and speak to individuals who are from that country and ask them to read. If the person has good feedback or thinks I missed something vital I add it. But it gives me confidence to post something knowing that I can go to someone from Uganda, give them the article and then they say “Yep that checks out” or “Oh my goodness! I didn’t know that!”
I am a product manager at a well-known entertainment-technology company, though my role is not a “traditional” product manager job.
From what I have noticed, Product Management is a very broad job across tech firms. Usually, when I think of product management, it involves planning roadmaps for new features, defining success metrics, coordinating feature delivery timelines with different teams, and running “standups” with engineers (which involves checking on their work progress). In the previous company I worked at, I did all of that.
But, that’s not what my job is today. AI has really transformed what my job has become. Here are three things I do at my job:
Building Databases(25%): I designed and built a unified experimentation database consolidating thousands of A/B tests from different sources across the company. I had to figure out how to structure the data and classify it so all the data would fit nicely in a unified database. The whole point of this data is to feed into a reporting system for experiments. We call this an “Extract-Transform-Load” (ETL) pipeline. I extract raw data, transform and clean it up, and load it in a structured destination. In case you wonder what tools I use, I use python & SQL to do a lot of this. I build everything on Databricks, with Claude Code as my good friend.
Data Analytics & Data Science(50%): The more traditional product managers that I work with will need me to do a deep dive analysis on an experiment or a launch they did. I help figure out what was successful or unsuccessful about that launch. I’ll have to think about counterfactual actions, understand the product flow intimately, and breakdown the analysis by different attributes of the customer (tenure, tier, engagement, geography). Sometimes, I’ll do more predictive modeling like linear/logistic regression, random forests, or gradient boosting.
Creating or Making Requirement Docs for Dashboards (25%): Depending on my bandwidth, I will either make a dashboard on Looker or Tableau for a more traditional product management team, or I will build requirements of what a dashboard should look like and then pass it on to a more dedicated dashboard team.
In other companies, what I do would probably not be called product management. Right now, I do the data architecture of a data engineer, the predictive modeling of a data scientist, the deep analysis of a data analyst, and the stakeholder communication & requirement writing of a technical product manager.
I genuinely enjoy this kind of work more than traditional product management, and I can see myself doing this for as long as this job exists.
The synergies between my Substack and my job are real. I use Claude Code to build my own databases of country data. I model counterfactuals for some of my articles. I write requirements docs for myself when I'm trying to organize what I want to build. The visualization muscles transfer in both directions.
Comments
Nothing yet. Say the first thing.
Sign in to join the conversation.