
Alexandre designed and conducted the research and wrote the first draft of the post. Xiq provided the research direction, supervision, and edited post.
In our previous blog post, we shared the motivation behind ClaudeConnect, a tool to share private context with friends securely. To bring you up to speed in one sentence: we want to build a porous membrane to increase your luck surface area, by inferring your wishes, and connecting them to opportunities within your trusted social network.
Buckle your data analysis seatbelt, today we’re validating our vision by building a quantitative model of opportunity mining. We’ll follow a proper by-the-book approach in four steps:
formulating a quantified hypothesis
modeling a peer-to-peer problem-solving network
calibrating the parameters on Facebook and Twitter data
using the calibrated model to answer our hypothesis
But first, let’s rewind to why we set out on this journey in the first place.
Once ClaudeConnect was reliable enough, we excitedly asked our OpenClaw personal assistant to install the CLI. It created a cron task to regularly sync our friends’ context and explore the files to surface new opportunities. To bootstrap, we initialized our personal context by loading our Obsidian notes, Substack archives, and Google Docs.
This is why, every morning, I receive an emoji-rich, overly eager Telegram message from my OpenClaw assistant along the lines of “🍀 Daily Serendipity Mining. Wild connection discovered: Your planarian bioelectrics ↔ community-archive memory architecture!”
While the first messages were interesting to read and did spark one or two good chats between Xiq and me, they didn’t create lasting value. After a few days, it only produced what felt like gimmicky connections between our past and present research interests.
So to fix this, we decided to set up a real-time ingestion pipeline, schedule user interviews to smooth the onboarding, and convince all our friends to join …
… and walked back on this decision. We realized we needed more clarity on the potential of the tool.
After all, there are so many existing ways to solve people’s problems. Even without a dedicated product, you can always message friends directly, post in group chats, or broadcast your needs on social media and hope someone replies.
We wanted to know how much counterfactual value an early prototype of Claude Connect could create with a small user base. We narrowed down our uncertainty to one core hypothesis: A network of 1000 users or fewer is enough for an average user to receive one juicy opportunity per week.
With our target set, it’s time to build the framework we’ll use to prove or disprove it. Let’s model a peer-to-peer problem-solving network!
The model works as follows:
Every day, a user generates P problems
Each user broadcasts their problems to friends one by one until a solution is found. Every friend has a probability S of solving it.
Matchmaking: If no friend can solve the problem, the search extends to friends of friends. This simulates the matchmaking feature, where opportunities can be mined across shared contexts even between users who aren’t directly connected.
At the end of the simulation, we tally up the events: 1 point for each problem a user solved or got solved, and 0.5 points for acting as a matchmaker.
To generate the social graph, we use the Barabási–Albert model, a classic choice for scale-free networks with the kind of hubs typical of social networks. The two key parameters are the number of nodes (total users) and the average degree (average number of friends).
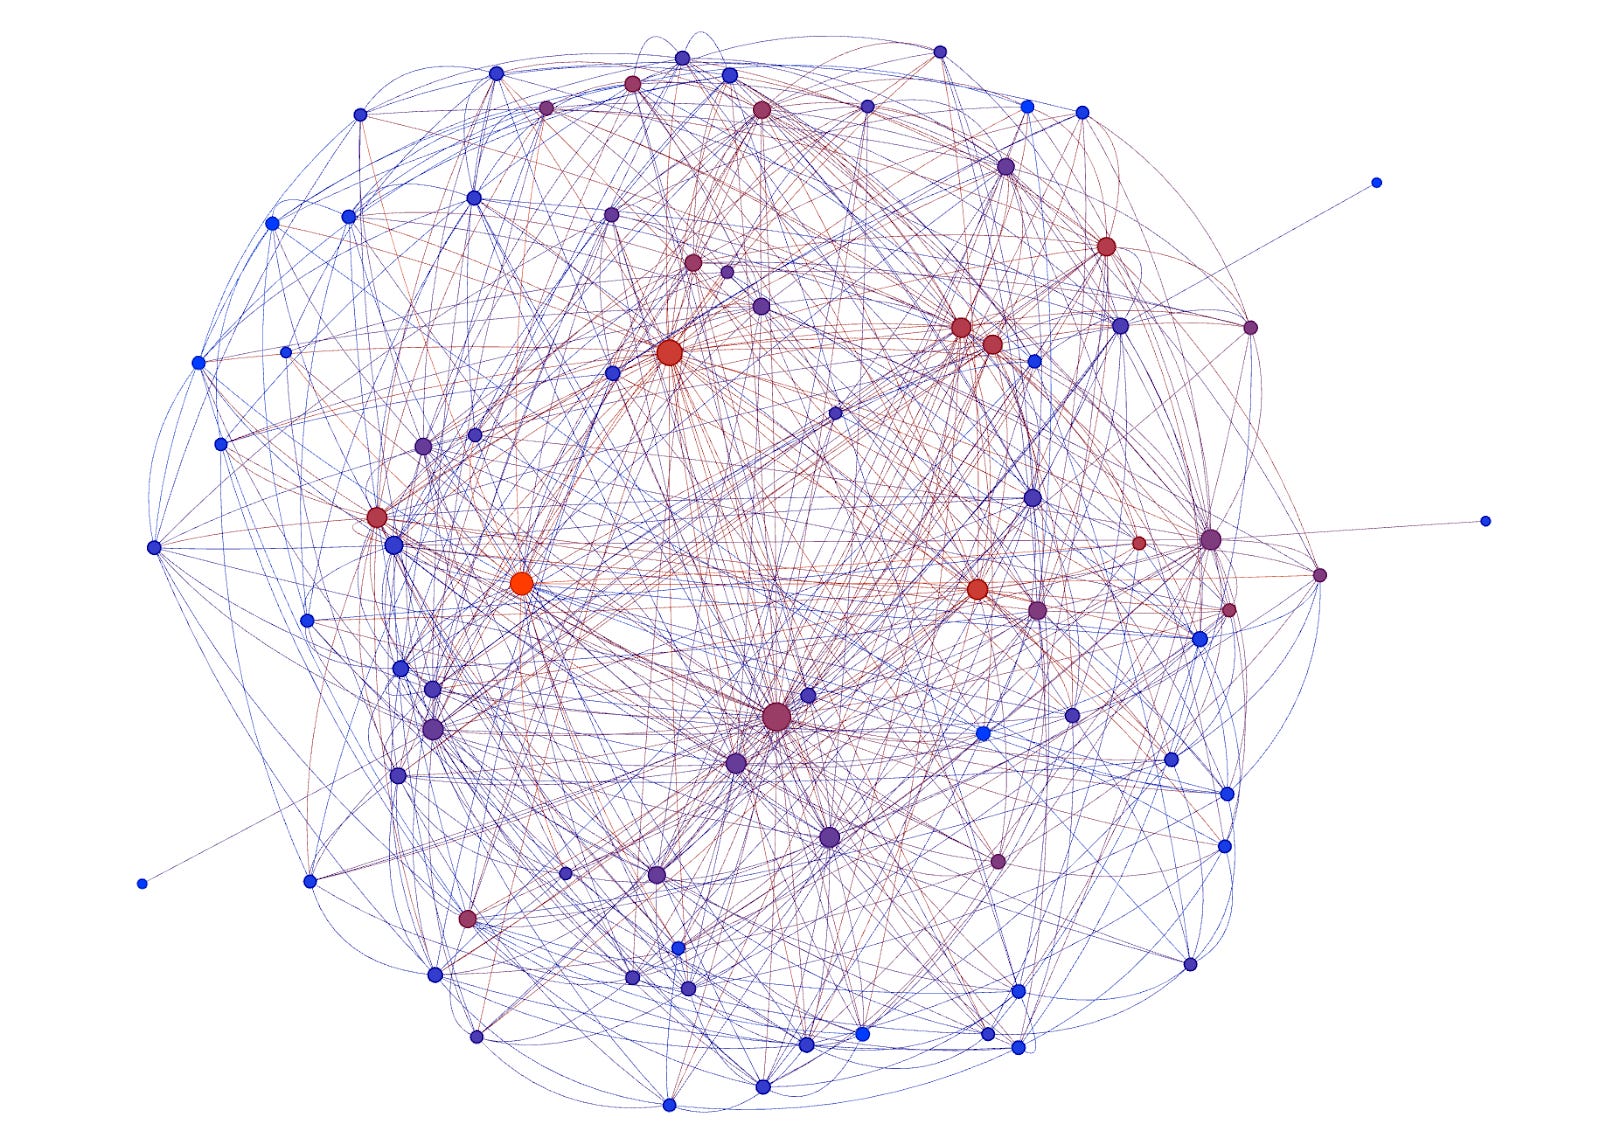
A social graph with 80 nodes. Red: many events, Blue: no events. As expected, the more connected you are, the more opportunities you get.
Our model now reduces to two key parameters: P, i.e., how many problems a person generates per day that their friends or mutuals could realistically solve, and S, i.e,. how likely any given person is to solve a problem when it lands in front of them.
(Technically, the average number of friends is also a variable, but it feels far less uncertain. We can reasonably expect something in the 10–50 range.)
To test our hypothesis, we need a realistic estimate of how the number of events per user per day scales with network size. That means grounding P and S in real-world data.
Social media platforms are natural places where problems and solutions get matched organically, making them the most promising source to extract real-world values for P and S.
We studied two datasets:
Facebook group. Two years of posts and comments from a large group (several thousand members) acting as a marketplace. Members post problems, often paired with an outcome-based reward, and others respond with solutions. In total: 747 posts and 5,724 comments.
Twitter Community Archive (CA). 53,000 top-level tweets from the 50 most prolific members of the CA, covering June, July, and August 2024, the period with the most comprehensive record.
Here are a few example problems, along with a summary of the community’s response:
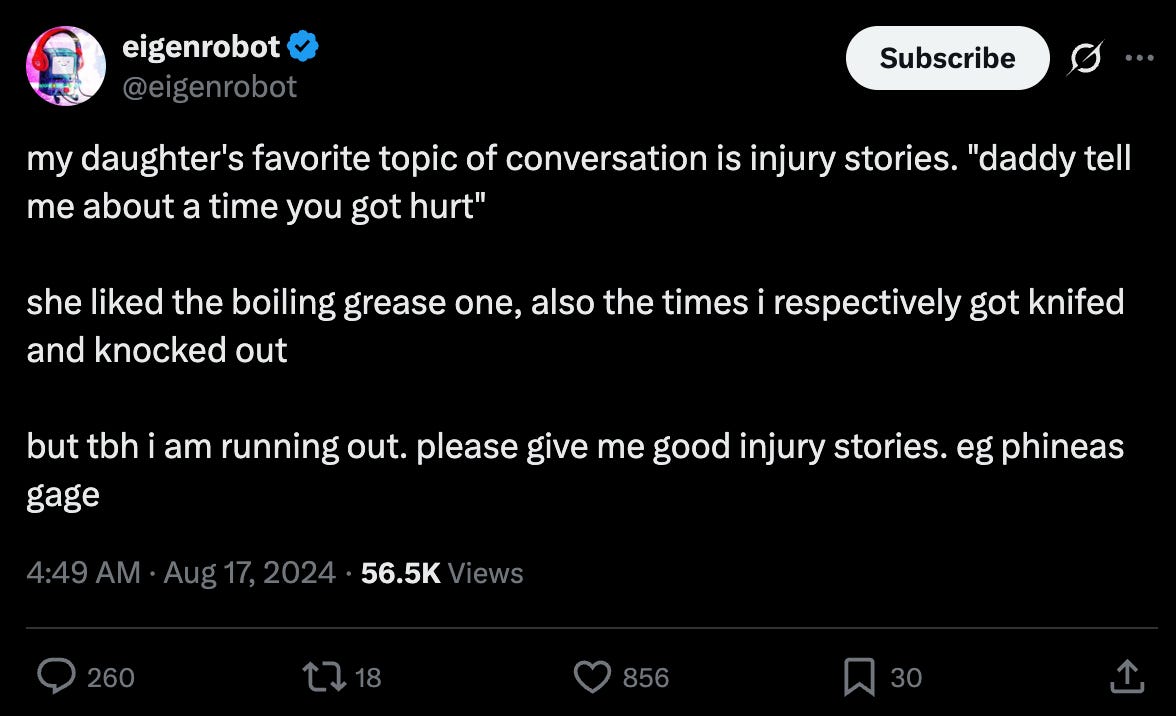
Reactions: Replies poured in with a mix of personal injury stories (being run over by a semi, a child losing a fingertip, water intoxication from spite-drinking) and suggestions to branch into disaster history like Pompeii.

Reactions: Got a characteristic Internet answer, “the deeper tldr is that the collective attention span is incredibly low and can be swayed by basically anything,” but not an actual explanation.
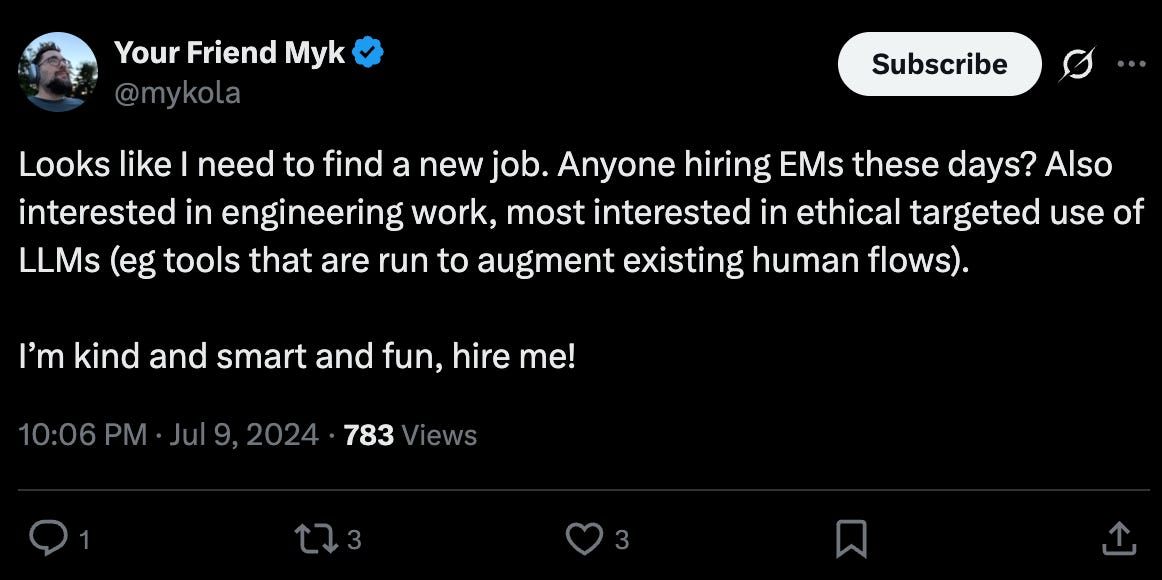
Reactions: No one appears to have responded with leads or offers; the only replies in the thread are @mykola elaborating on their own management and engineering philosophy.
Examples from the Facebook group (anonymized):
ArXiv Citation Bounty. A user offered $5 per academic paper (post-June 2022), citing LessWrong or Alignment Forum posts, capped at $500 total.
Multiple community members submitted dozens of qualifying papers and received payments, with one commenter also surfacing a simple Google Scholar search trick to find more.
Bounty for a silent mechanical timer with a single chime. Someone offered $100 for a fully mechanical, electricity-free timer that can measure multiple intervals quietly and ends with a single pleasant sound.
Several options were suggested, but none fully met the requirements; the closest candidates either had buzzer-style alarms or used electricity.
ML Benchmark Testing Consultation. A user offered $200 for an hour with an ML/AI engineer experienced in benchmarking language models.
One commenter suggested a potential referral, and another sent a direct message, but no confirmed resolution was indicated.
We have our raw material: extensive records of people sharing problems and receiving solutions. To extract estimates of P (problems per user per day) and S (the probability that any given contact solves a problem), we first need to process it further.
Does it solve your problem?
We analyzed both datasets using the two-step pipeline:
Classify as a problem (CA only). We manually labeled 50 top-level tweets as problems or not, then used the 10 most informative as few-shot examples in a classification prompt with Deepseek-v3. This filtered 53k top-level tweets down to 3,409 that contained a problem, like the example tweets shown above.
Classify if resolved. We gathered replies to each post (and quote tweets for the CA), then classified the outcome of community engagement using the same few-shot technique. Three possible outcomes:
Solved by the community. A clear signal that the author is satisfied, or that the responses constitute clear solutions. Examples: @eigenrobot’s tweet and the ArXiv citation bounty.
Serious engagement. Multiple relevant community responses, but no clear signal on whether the problem was actually solved. Examples: @danielbottman’s tweet and the silent mechanical timer bounty.
Unsolved by the community. Everything else. Examples: @mykola’s tweet and the ML benchmark testing consultation.
For the CA dataset, we had to account for missing data. We only see replies from tweets within the community archive. Since CA members are tightly connected, we capture most replies on average, but manual inspection of 10 tweets suggests we underestimate the resolve rate by roughly 25%. The CA resolve rate should therefore be treated as a lower bound.
With our pipeline complete, we have each user’s problems and their outcomes. This is enough to estimate P, the number of problems generated per user per day. But estimating S requires more than just knowing whether a problem got solved.
Remember that in our model, S is the probability of solving the problem when asking a single friend. Of course, the more people see a problem, the more likely it is to be solved.
This brings us to the last question of our calibration phase before we can challenge our hypothesis: how many views did each post get?
For the Facebook group, we assumed each post was seen by 10% of the total membership. It’s a rough guess, but since views are capped by the group size, we can’t be very wrong. Somewhere between 5% and 50% seems reasonable.
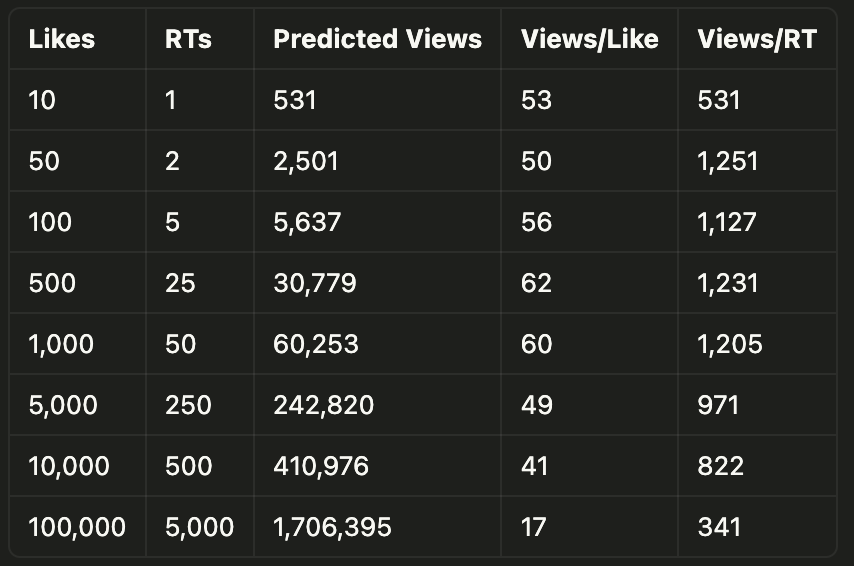
For Twitter, there’s no such upper bound, but we do have access to likes and retweet counts. To convert these into view estimates, I calibrated a simple log-log regression model on 2,600 tweets scraped from my timeline.
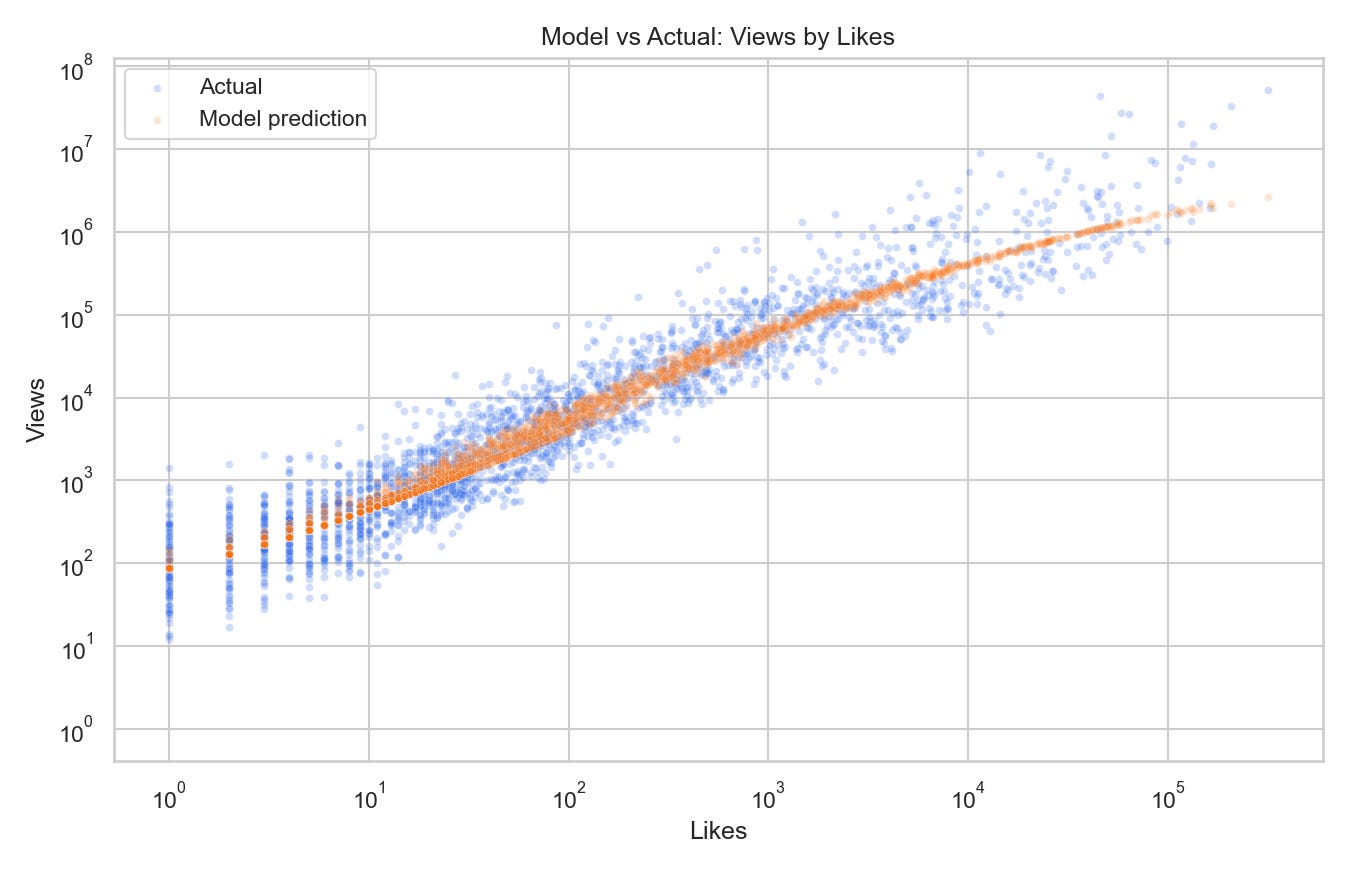
By eyeballing the graphs, the relationship between likes, retweets, and views in log space seems regular enough that I am willing to trust it. Quantitatively, the 95% relative confidence interval of the model is [-80%, +395%], which means we likely capture the right order of magnitude even if precise estimates are out of reach. Good enough for our purposes.
Just for fun, I also extracted ratios to convert likes and retweets into view counts. This is not exact; the model is non-linear, so going from 0 to 1 retweet when a tweet has no likes is worth more views than the same increment on a tweet with 100 likes. But for the curious, here’s the table:
We have our quantified hypothesis (1000 users to get to 1 opportunity per week), our model, and … drumroll please … our fresh estimates of P and S!
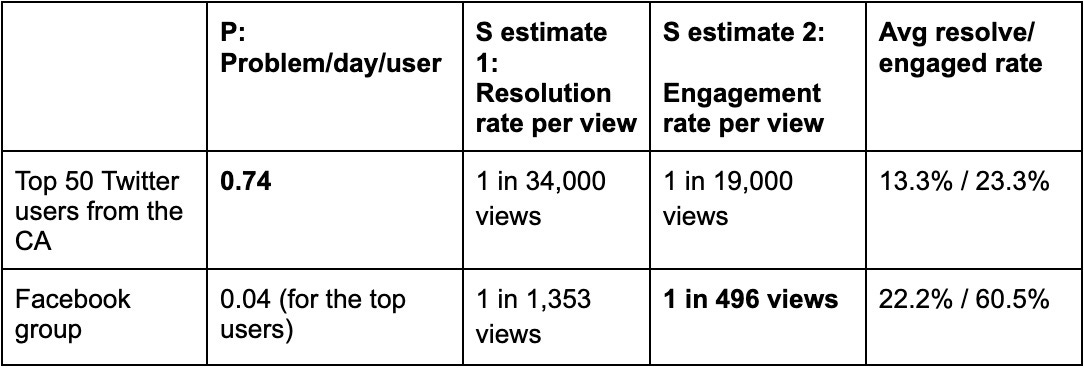
Table 2: Estimates for P and S in the Community Archive and the Facebook group.
We define “engaged” as a problem that has been either resolved or met with serious engagement. This gives us a more optimistic estimate of S that doesn’t require full resolution, just a meaningful lead toward one.
For readability, we express S as its inverse (1 in X views). This means, for instance, that a tweet needs on average 34,000 views to have a 50% chance of being solved by the community, and 19,000 views for a 50% chance of being solved or seriously engaged with.
As is often the case with social media data, the aggregated results hide strong heterogeneity across users.
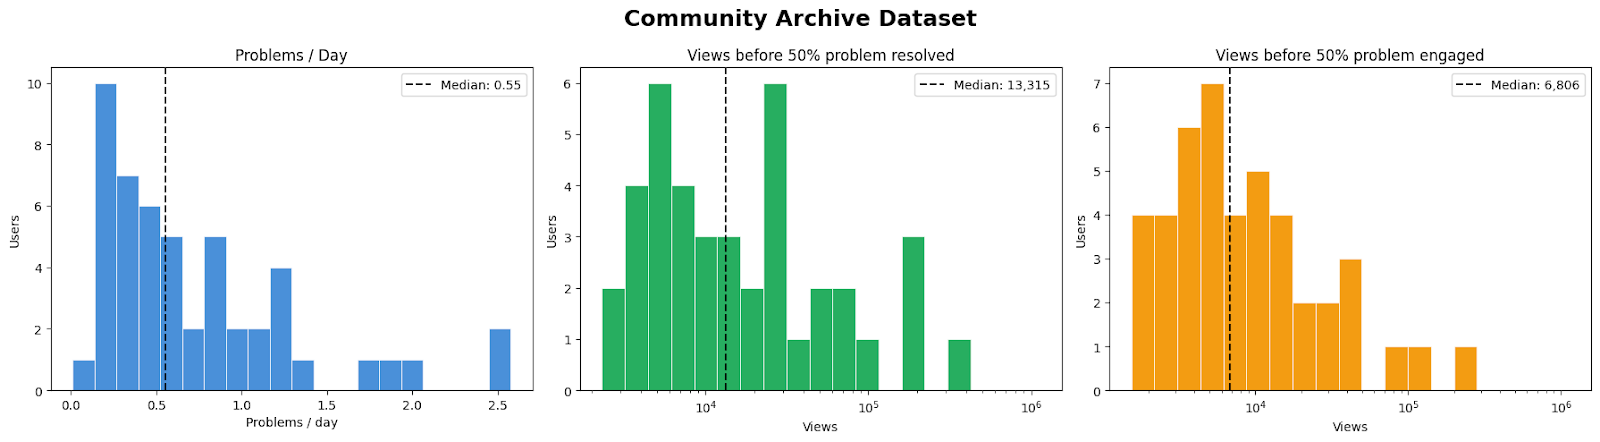
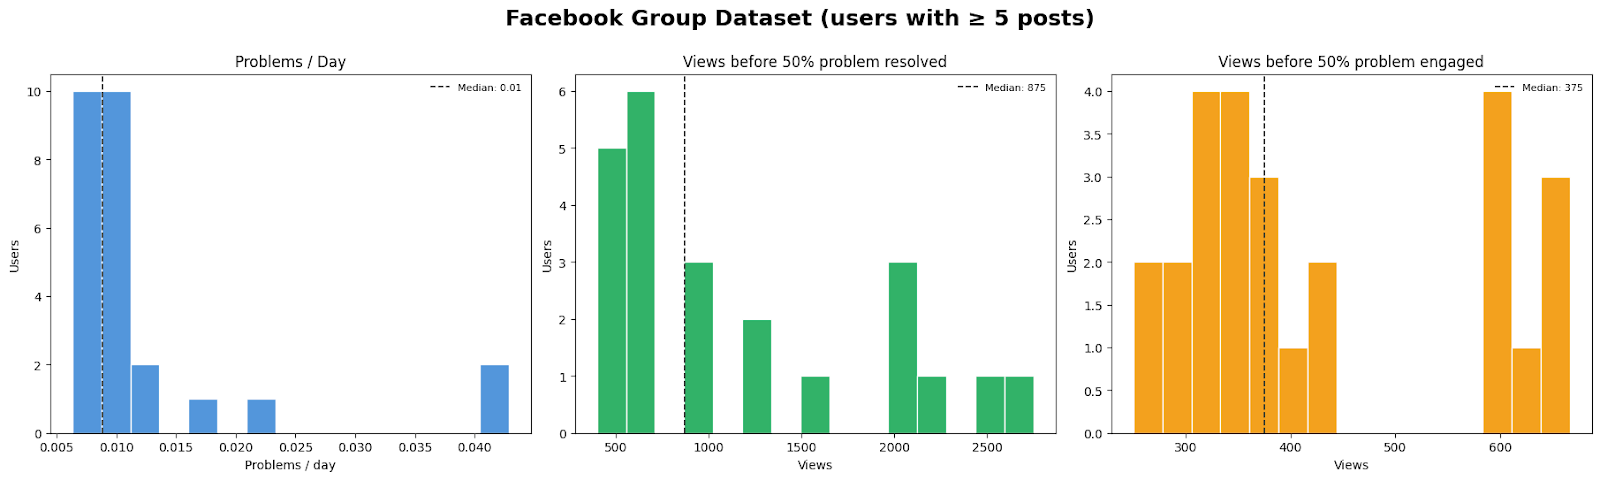
We also expect strong heterogeneity across problem types. Smaller problems are likely both more common and easier to solve than harder ones. Quantifying this, however, is beyond the scope of our analysis.
As a sanity check, it is also good to validate our model’s assumption that more views means a higher likelihood of solving the problem.
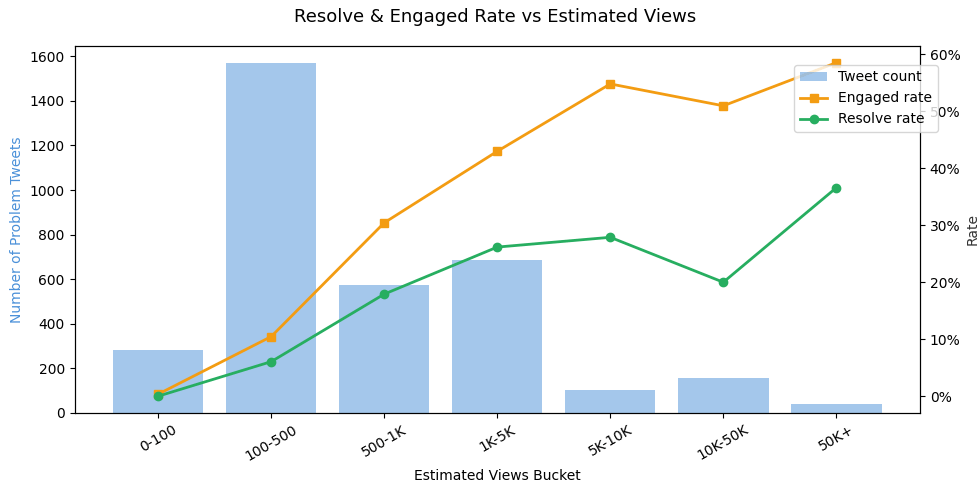
Reliable serendipity is limited to high-visibility Twitter accounts that can easily broadcast their problems to thousands of people. For anyone unable to reach more than 1,000 views per post, the response rate would simply be too low to rely on.
With our parameters calibrated, we’re ready for the final step. If we build a Claude Connect network that generates problems at the same rate as our datasets, with a similar resolution rate per view, does a 1,000-user network produce at least one opportunity per day per user?
We ran the simulation with an average of 20 friends per user. This might sound low compared to the thousands of connections you might have on Facebook, but remember, we are building a peer-to-peer network of fewer than 1,000 users from scratch. For the smallest networks, 20 friends is already a significant fraction of the total. For these cases, we set the average degree to 20% of the network size.
If you’d like to explore different parameter choices, you can play with the model yourself. The app is online.
Community archive simulation.
P = 0.7 problem/day
S = 1 in 20,000 views
We picked an optimistic estimate of S, the probability of solution per view (close to the estimate 2 in the table). This way, we compensate for the missing data problem mentioned above that causes underestimation.
Here is the average number of events per week per user, depending on the network size. An “event” happening means that a solution was provided. “With matchmaking” means that a solution was provided by a friend of a friend, and that counts 0.5 points.
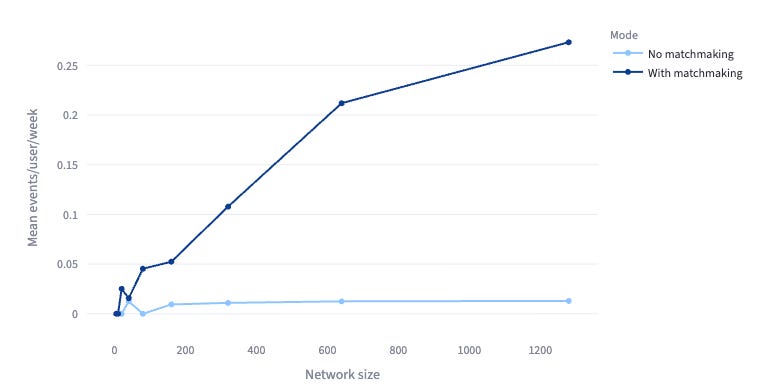
In this graph, the Y axis doesn’t make a difference between “engaged” and “solved” anymore. We have only “events,” which is our proxy to operationalize the notion of “juicy opportunities” from our hypothesis.
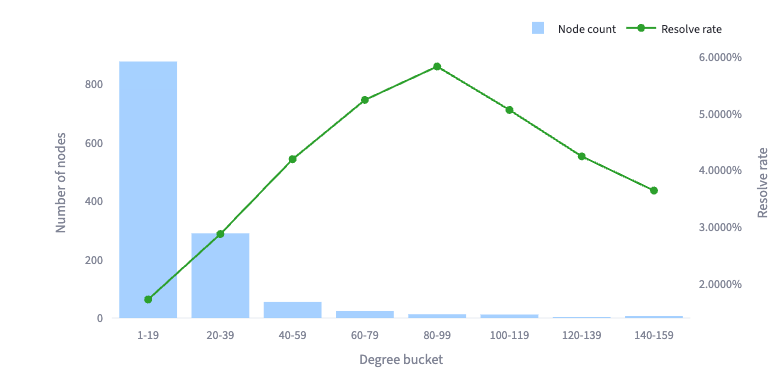
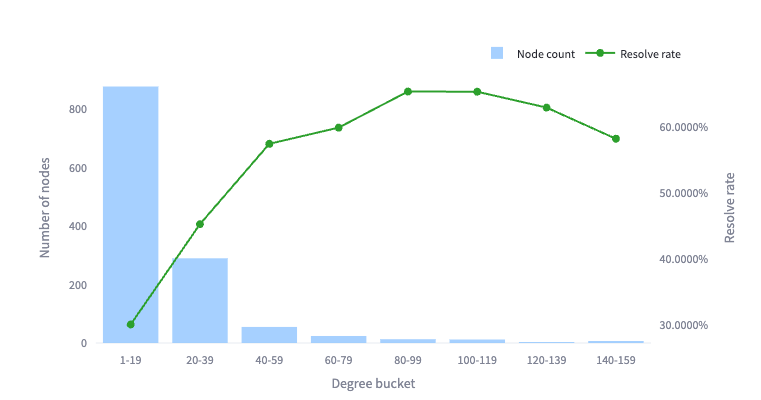
And how the number of friends influences the problem resolution rate:
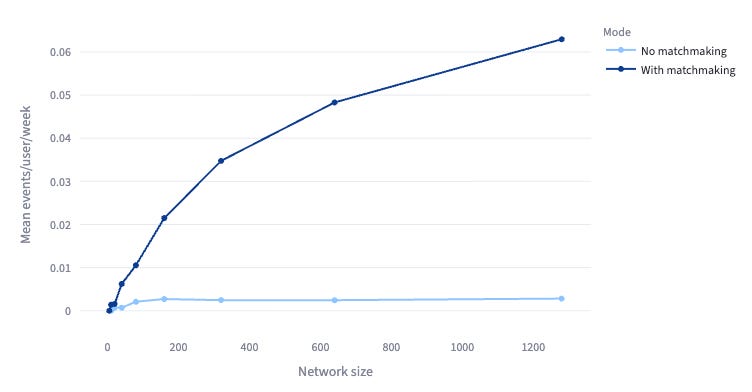
Facebook group simulation.
P = 0.01 problem/day
S = 1 in 1000 views.
Interpretation.
By looking at the raw numbers, our quantitative hypothesis is disproved. 1000 users are not enough to reach the target of 1 opportunity per user per week with the parameters calibrated from Twitter and Facebook data.
In the CA case, this is because the reach of a peer-to-peer network is far more limited than on Twitter. Within a 1,000-user network, a problem is seen by at most a few hundred people (already a significant proportion of the total network), far from the tens of thousands commonly reached on Twitter. As a result, the resolve rate drops to 2.26%, well below the 13-20% observed in the dataset.
We don’t have this problem with the Facebook group’s base rates. Even 300 users are enough to reach a resolution rate of 20%. The bottleneck here is different: users simply don’t generate enough problems. Even with a perfect resolution rate, this alone would fall short of our target.
But by taking the best of both worlds, we can salvage our hypothesis!
If we combine the prolificness of Twitter with the attentive resolution rate of the Facebook group (made possible through LLMs carefully leveraging user context), a network of just 150 users is enough to reach one event per week per user. With 1,200 users, we get nearly one event per day.
In one sentence: we can reach critical mass with as few as 100 users, but we need i) an ingestion pipeline that surfaces opportunities as frequently as top Twitter users share problems, and ii) matchmaking that connects people at a rate comparable to an active, incentivized Facebook group.
A real challenge, but a great sign of life!
Do we now feel ready to go head down, iterate, and onboard users to reach this critical mass?
Much more so than before. We now know there is genuine demand for the tool, and these two communities are prime candidates for early adoption. The numbers also don’t seem out of reach, given the base rates.
That said, we’re not quite ready to charge ahead. By answering one question, we displaced our uncertainties: Imagine ClaudeConnect works beautifully, and users receive one meaningful event per day. What does that actually look like? A 30-minute call? A one-liner piece of information? Poll results? Reading recommendations? A paid service? A warm intro? An invitation to a group chat? We expect the answers inform our product design.
These are all examples present in our datasets, but they answer very different types of problems. Our next step is to map the shapes of these problems, understand what kinds of answers they prompt, and identify where ClaudeConnect is best positioned to deliver something social media simply can’t.
Stay tuned!
No posts
Comments
Nothing yet. Say the first thing.
Sign in to join the conversation.