
These two articles looked at the relationship between fertility and social liberalism in Europe:
They showed a paradox. Social liberals have fewer children than conservatives, but over time, Europeans have become much more socially liberal.
To understand these dynamics, we really need to know whether social attitudes are handed down from parents to children. That requires a survey with at least two generations, which is quite rare. But there is a possible shortcut, which has less demanding data requirements: we can relate people’s opinions to how many siblings they have, instead of how many children. The idea is that, if conservative parents have many children and pass on their attitudes to them, then people with more siblings in the next generation will be more conservative. Better still, there is a neat trick to find out how strong this effect is: we can compare the actual distribution of opinions to a counterfactual distribution, where everybody has the same family size.
I didn’t invent this clever idea: I stole it from Vogl and Freese (2020). They use it to show that differential fertility made the US more conservative on the issue of gay marriage. (This framing does seem a bit like a Jonestown cult member worrying that mass suicide will hurt their recruitment drive. But I’m sure it helped sell the paper to the PNAS editors, and I don’t want to be mean about gay marriage….)
This approach isn’t a perfect substitute for looking at parents and children directly. People with more siblings might be more conservative for other reasons than their parents (socio-economic differences, say). But whatever the causal mechanism, it does let us understand how family size differences spread ideas.
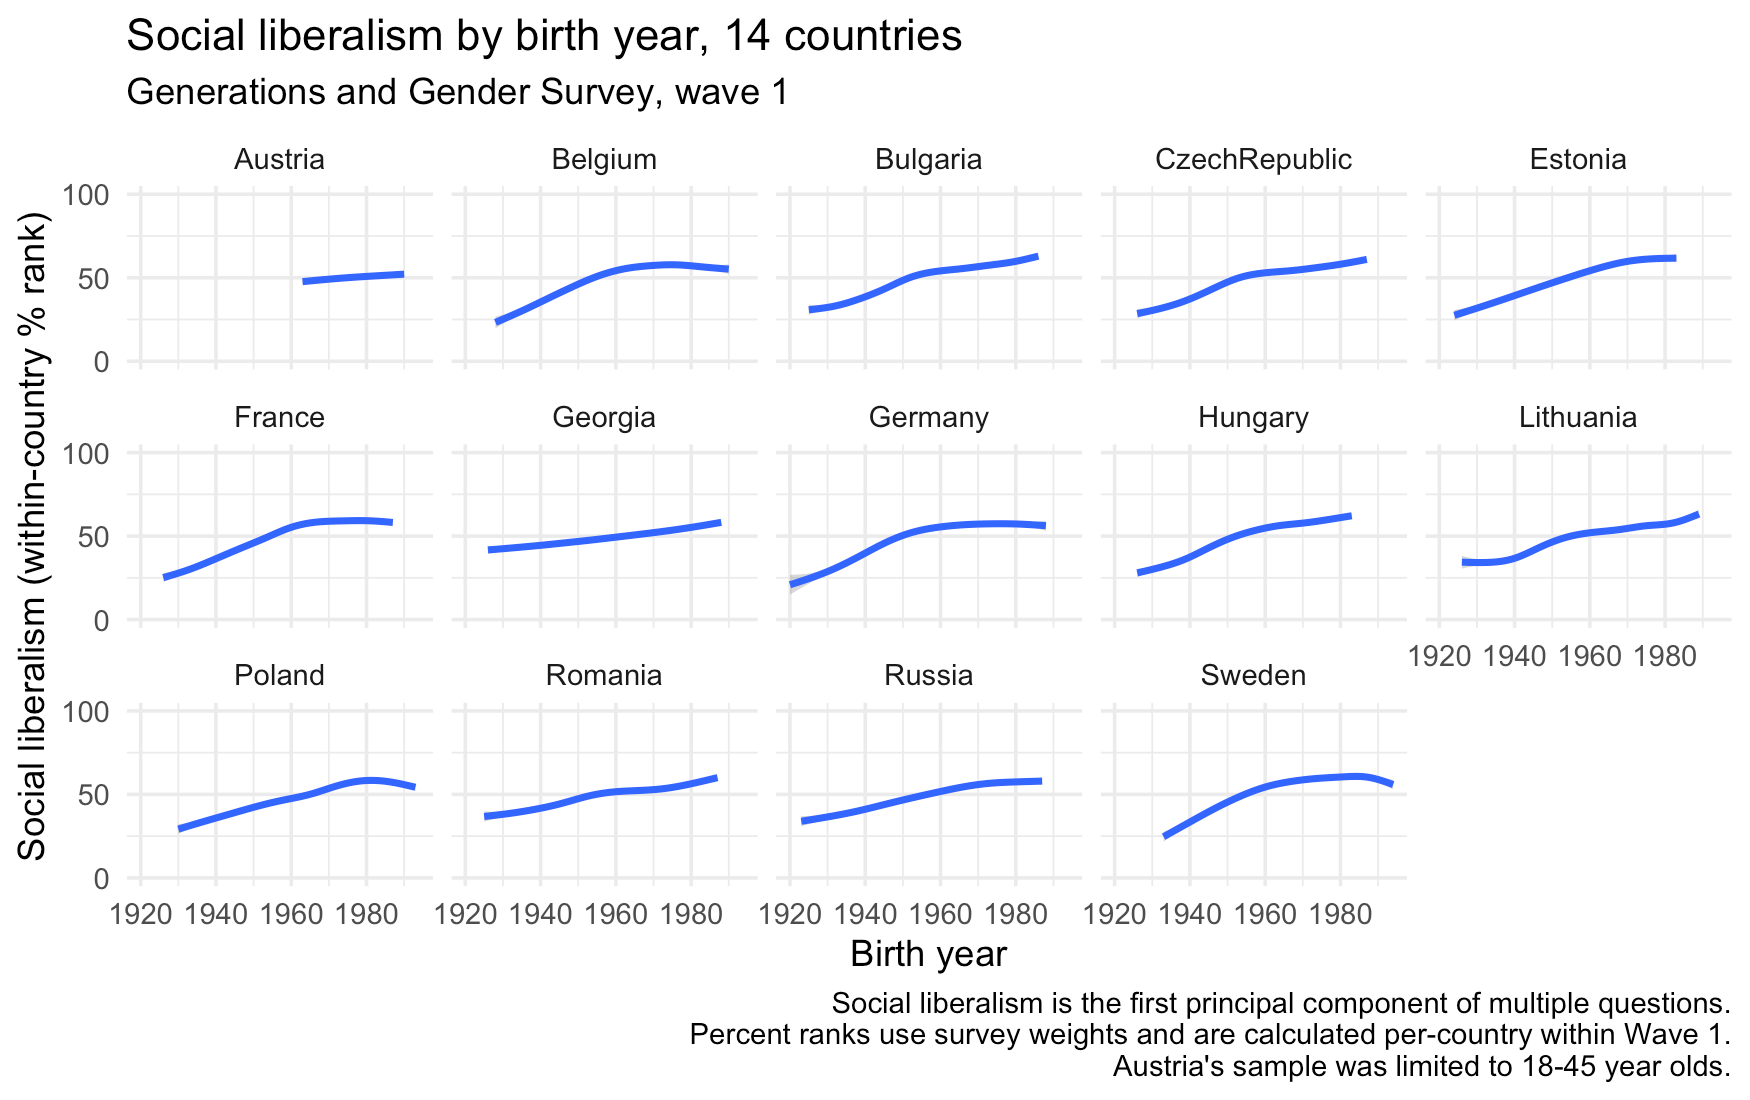
The Generations and Gender Survey covers a grab bag of European countries, and has questions on social attitudes as well as on numbers of siblings. It ran in multiple waves, but we’ll just use wave 1, which is from the 2000s. It’s somewhat focused on older people:
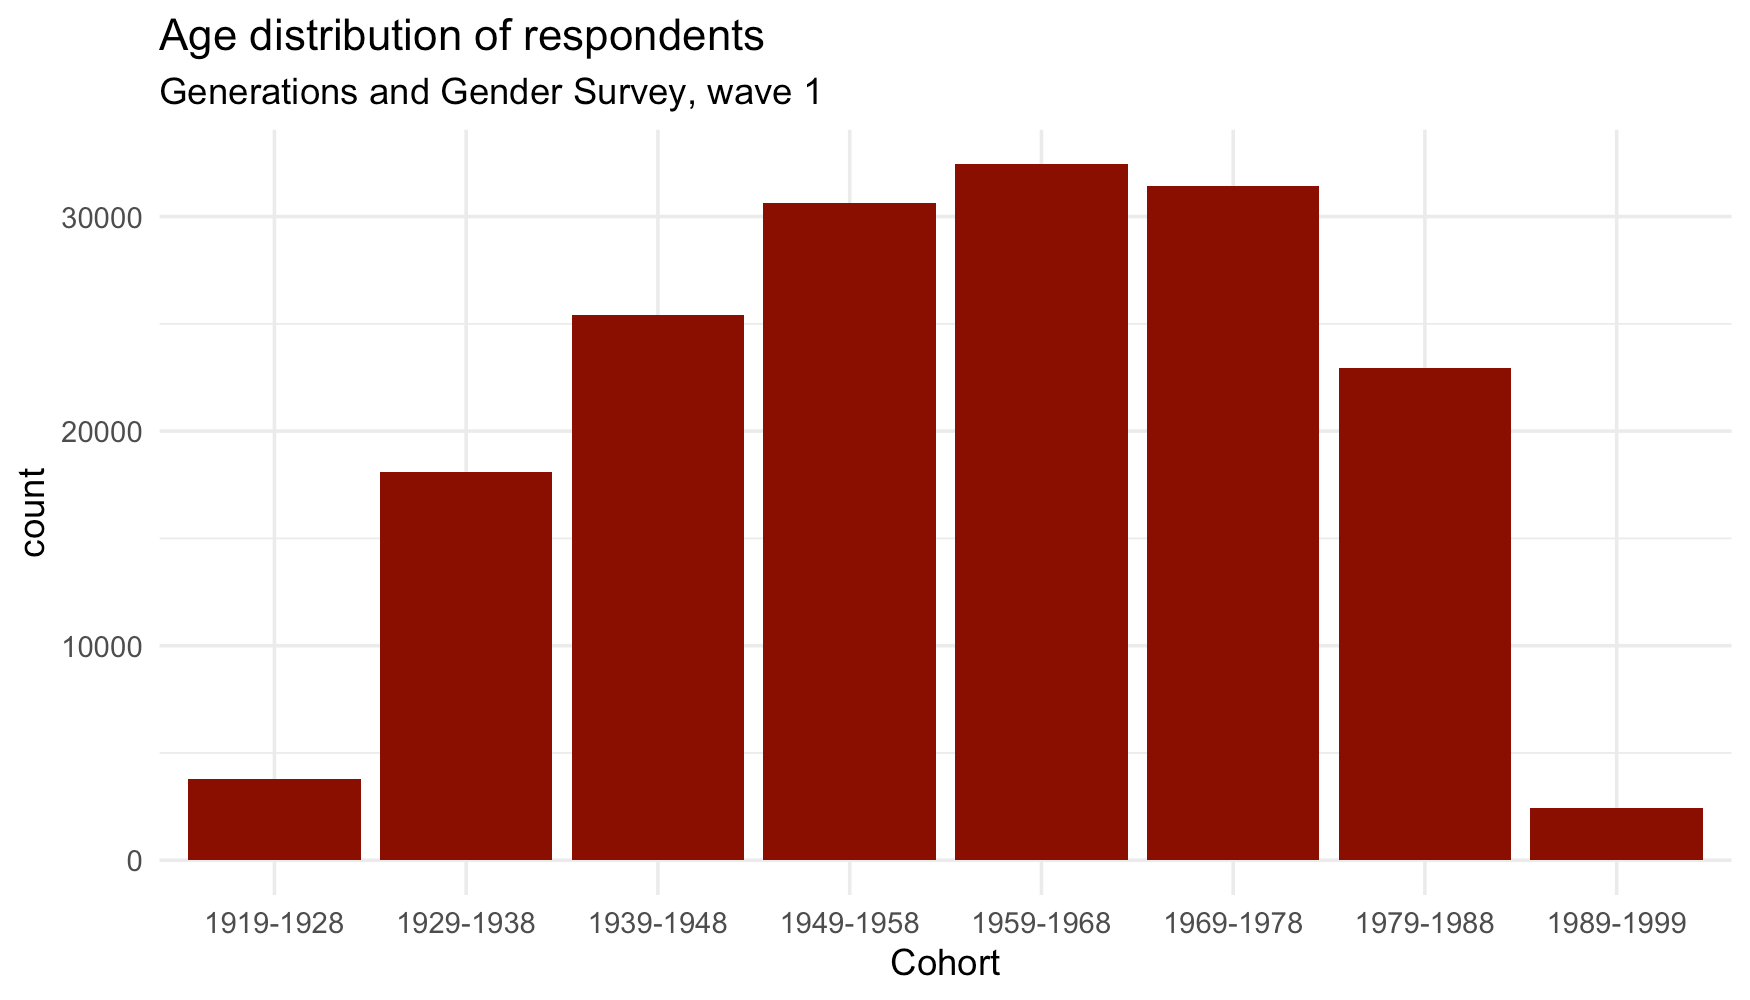
So you can think of this as covering roughly 1930-1990.
As before, we’ll sum up different attitudes to create a single index of social liberalism, using principal component analysis. Here are the attitudes. The numbers show their “loadings”, i.e. how much does a 1-standard-deviation change in agreement with the statement add to the principal component?
Marriage is an outdated institution 0.16
It is all right for an unmarried couple to live together 0.27
Marriage is a lifelong relationship that should never end -0.26
It is all right for an unhappy couple to divorce, including if they have children 0.16
A woman must have children to be fulfilled -0.40
A man must have children to be fulfilled -0.40
A child needs both a father and mother to grow up happily -0.32
In a couple it is better for the man to be older -0.29
A woman earning more than her partner is bad for the relationship -0.21
A preschool child suffers if the mother works -0.28
Children suffer when fathers concentrate too much on work -0.16
When jobs are scarce, men have more right to a job than women -0.30
When jobs are scarce, younger people have more right to a job -0.24
The graph below plots social liberalism against number of siblings in each country.
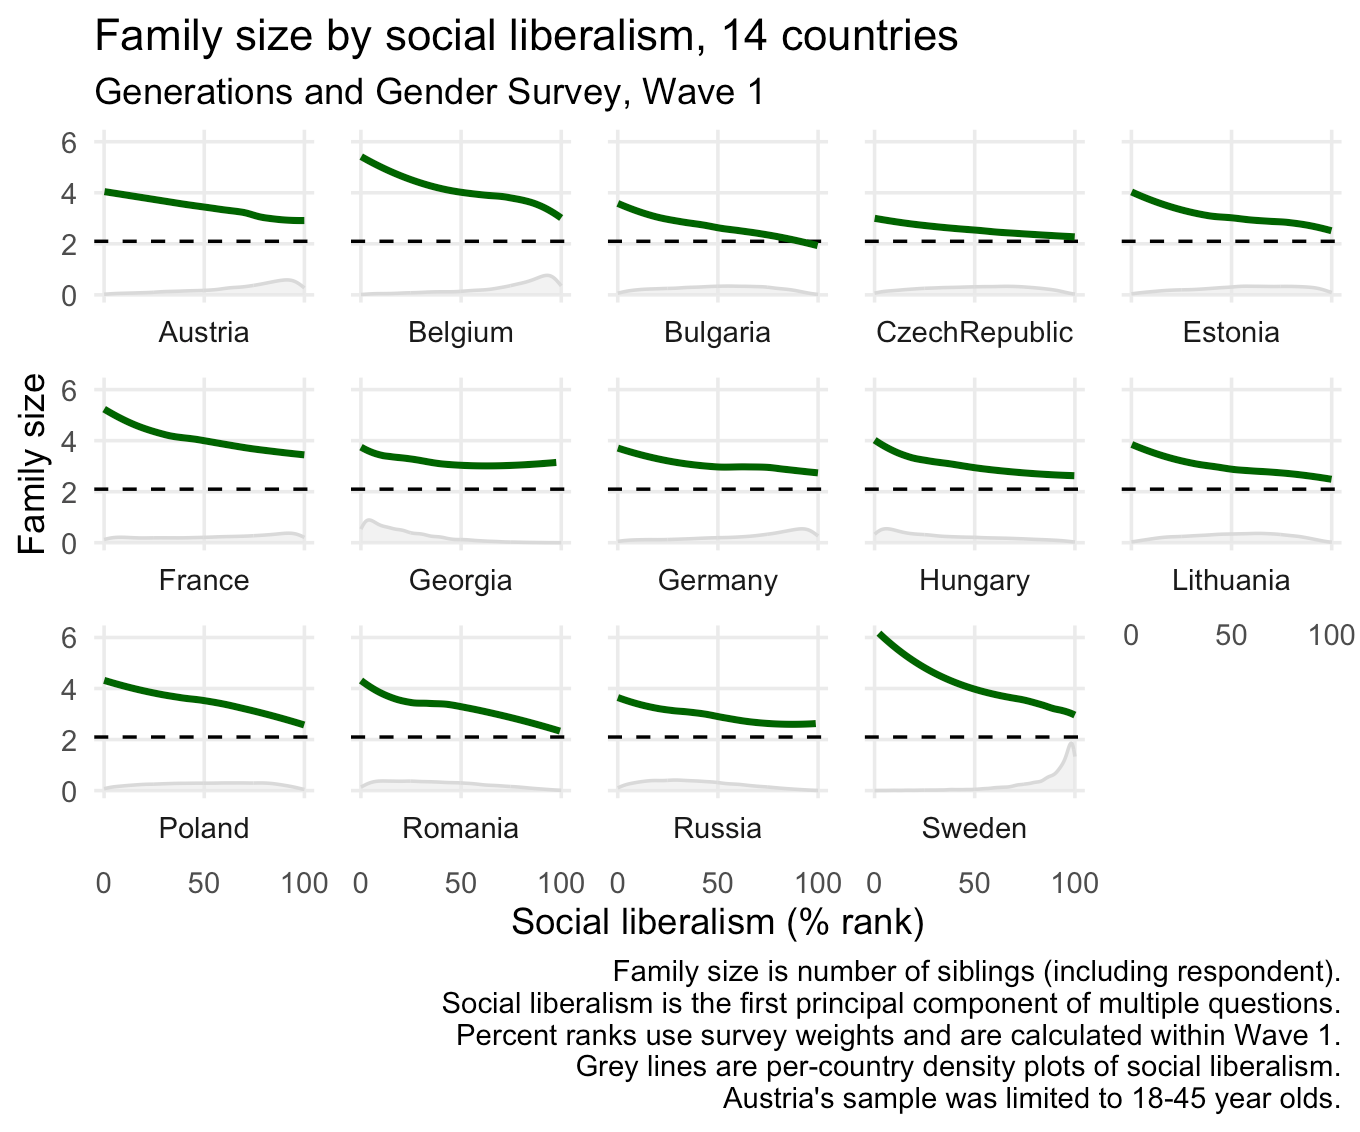
As expected, socially liberal people have fewer brothers and sisters. The differences are pretty big in most countries — maybe 1-2 fewer siblings if we go from the most conservative to the most liberal person. Of course, most people aren’t at those extremes, and where they are varies by country. Swedish conservatives have a very high number of siblings, but most Swedes are very liberal, so the conservatives are a rare bunch to start with.
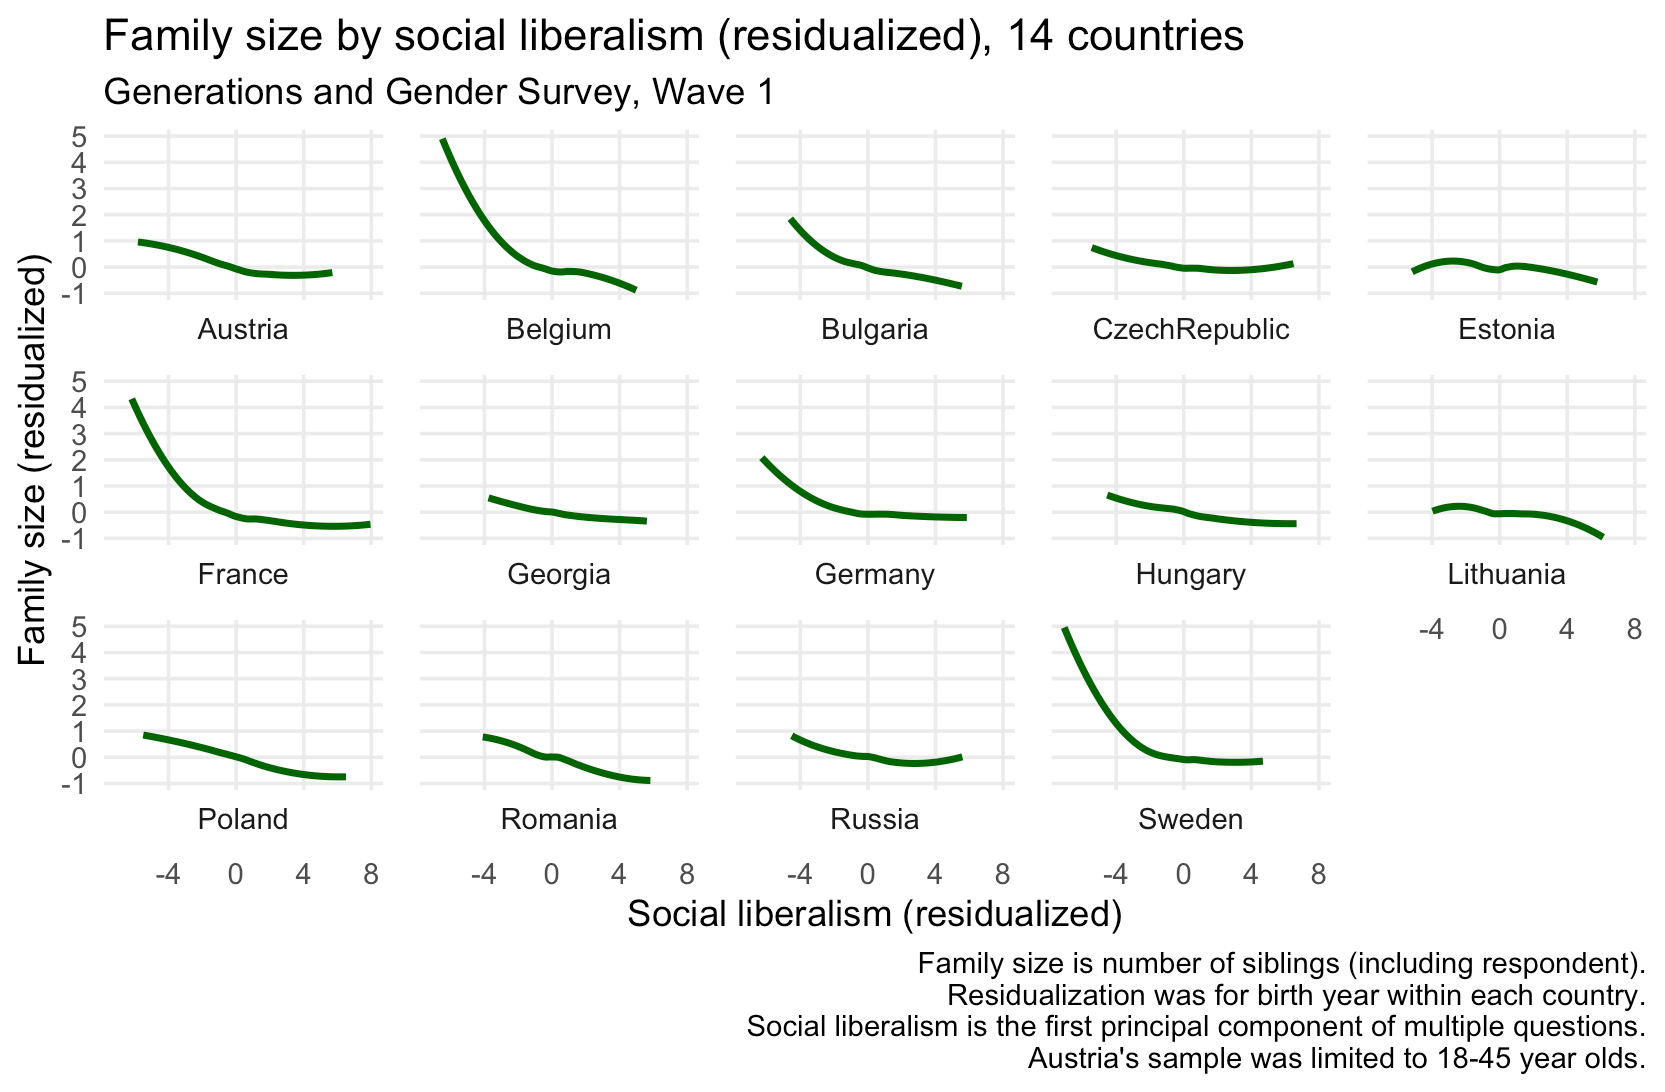
Maybe this is just a generational difference? Later generations have fewer siblings, later generations are more liberal? If so, then different family sizes might not be affecting the level of social liberalism at all: cultural evolution only happens if some people are having more children than others within a given generation. I checked this by residualizing family size and social liberalism for birth year within each country (details below). It turns out that there are still big differences between liberals and conservatives, though birth year accounts for about one third of the difference.
When I saw this graph, my intuition was that family size differences must be making society quite a lot more conservative. These look like big effects!
So then I did the trick. I created a new within-country rank of social liberalism, so every respondent in that country is ranked from 0% (most conservative) to 100% (most liberal), and the distribution is completely uniform. That gives us a neutral baseline. A person’s score on this represents where they are on the distribution of opinion within their country: a score of 60% means you are more liberal than 60% of your fellow citizens.
Next I simulated what would happen if family sizes didn’t differ by social liberalism: I reweighted every survey respondent by 1/(family size). (Intuitively: bigger families “weight” society towards the opinions shared by their members; we are just undoing this weighting.) With this, we can calculate a counterfactual within-country distribution of opinions.
Here’s a graph of the counterfactual distribution:
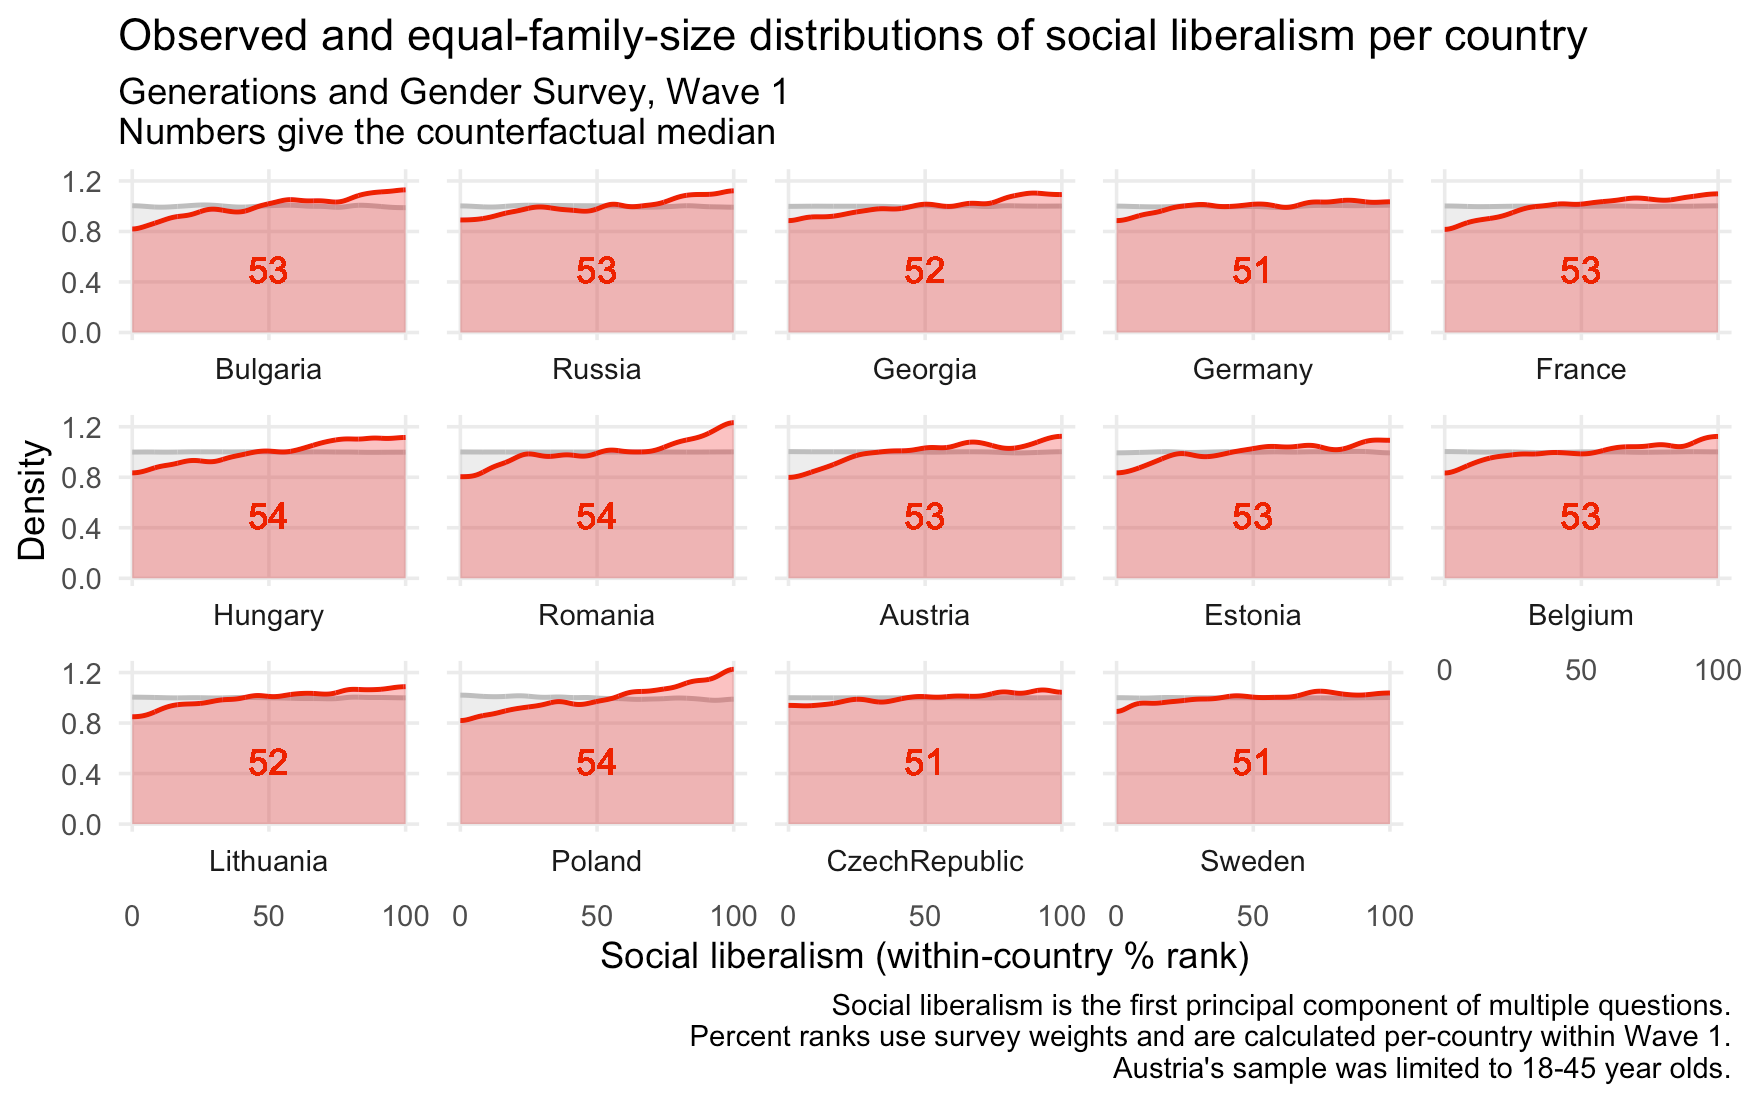
The numbers give the median within-country rank if family sizes were equal. For example, in Bulgaria, if family sizes did not vary by liberalism, then the median social liberal would shift up by 3 percentage points, to be more liberal than 53% of Bulgarian respondents were in reality.
And the numbers are kind of… meh? The changes are a few percent at best. Not nothing, but not huge and certainly not as big as I expected!
Plus, remember, these are within-country measures, but an awful lot of the differences in social liberalism are between countries. (Look back at the grey density plots of liberalism in the first graph: almost all Swedes are much more liberal than almost all Georgians, for example.) If we plot the same graph as above, but using the raw social liberalism score across the whole survey, it’s even less impressive:
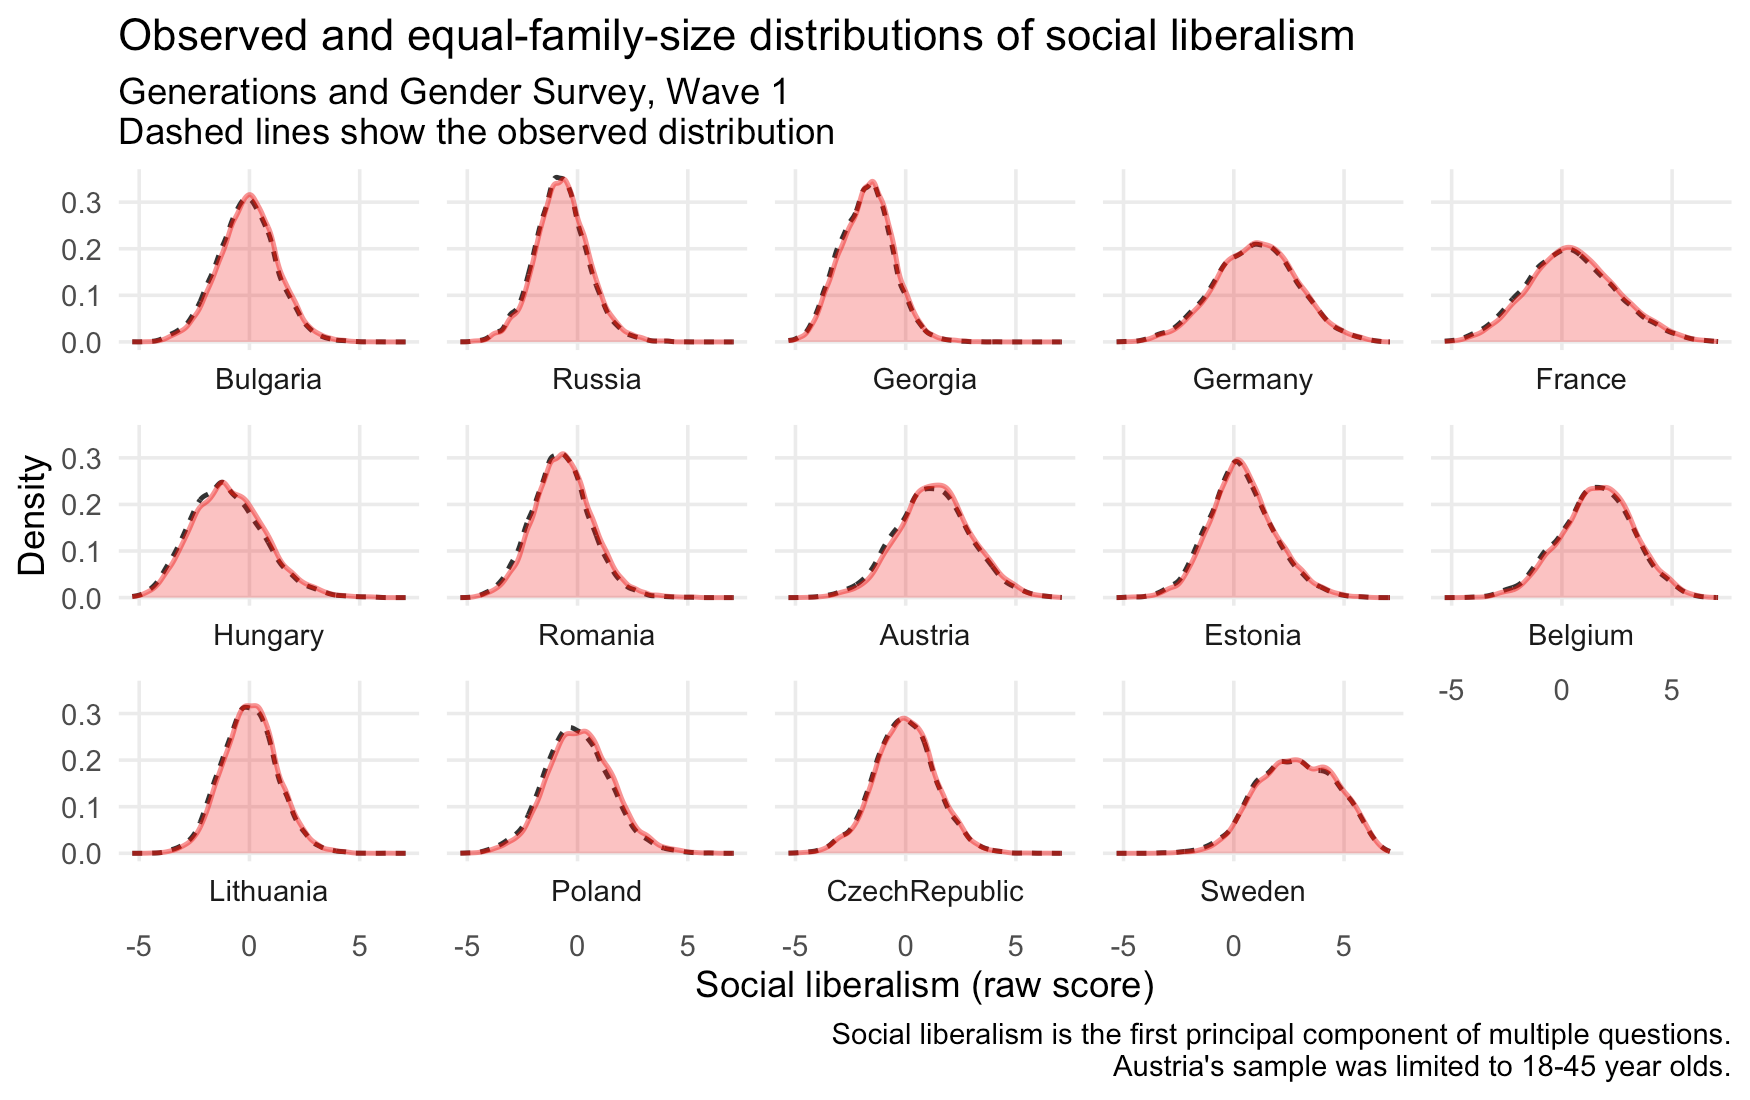
On this shared scale, you can just barely see that there might be small shifts towards liberalism in most countries. But Sweden would still be far more socially liberal than Georgia!
Why do such big relationships between family size and liberalism make such little difference? One reason is the already-mentioned differences between countries. Sure, conservative Swedes come from much bigger families. But there are just very few of them to start with! If almost everyone in Sweden is very liberal, then a tiny minority of hardline Protestants will not change that, that no matter how fertile they are.
Another reason, maybe, is that although the fertility-liberalism relationship is strong, it conceals a lot of variance. Our measure of social liberalism explains just 1.5% of the variation in fertility. (This is another example where the size of an effect is different from its explanatory power, see previous posts in the context of genetics.) I’m not sure how this affects things, but I suspect it dampens the effect of reweighting.
By the way, things are much the same in the original Vogl and Freese paper. Here’s their graph showing how much difference it made that those opposed to gay marriage and abortion had more siblings, using the same methodology as above. This indeed shows that opposition to gay marriage/abortion would have been lower in the absence of fertility differences (the difference between the solid and hollow squares). But it also shows that opposition to gay marriage absolutely plummeted within the space of 15 years!
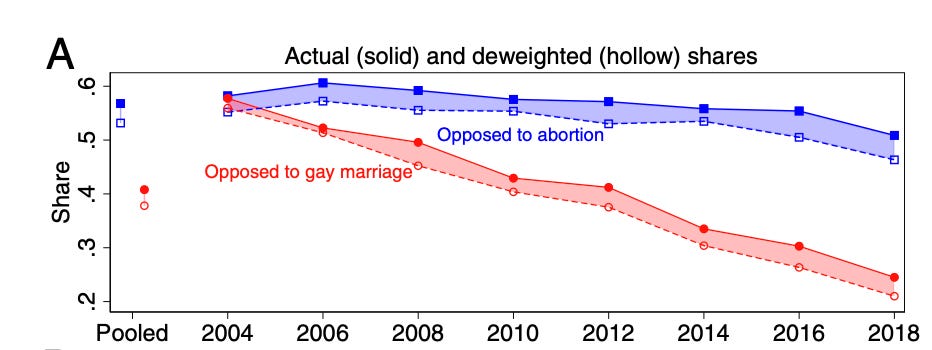
And indeed, younger people are far more socially liberal in these countries, with changes on a scale that clearly outweighs any effects of fertility.
In the very big picture, I think these results chime with the argument Robin Hanson makes: in modern large-scale societies, culture can become highly maladaptive and, to adapt the old saw about the stock market, can remain maladaptive longer than its members can remain fertile.
But this is old data, from the twentieth century. I’ve got some more recent surveys, so I’m planning to look at them soon. Maybe the picture will change!
Code for the post is here.
Appendix
Here’s a plot of residualized family size on social liberalism. I used the raw principal component of social liberalism, rather than taking ranks. The y axis shows you the difference in average number of children between people with different social liberalism scores. You can see there are still big differences, typically of more than 1 child between the extremes. If you run regressions, birth year accounts for about one third of the total effect.
No posts
Comments
Nothing yet. Say the first thing.
Sign in to join the conversation.